

- Date:
- 24 Oct 2023
Intersectionality at Work is a companion report to the Baseline Report 2021, released in 2022 following the inaugural workplace gender audit.
It provides insights and analysis of intersectional data collected by defined entities as part of the audit. This analysis is combined with findings from projects funded as part of the Commission's Research Grants Round 2022.
Intersectionality at Work will assist the Commission, defined entities, and the Victorian community to understand:
- how experiences of disadvantage and discrimination on the basis of intersectional attributes might compound or shape experiences of gender inequality
- where to focus efforts to improve.
Acknowledgement of Country
The Commission for Gender Equality in the Public Sector acknowledges and pays respect to the traditional owners of Country throughout Victoria.
The Commission for Gender Equality in the Public Sector acknowledges and pays respect to the Traditional Owners of the lands on which we are proud to be located. Our office is based on the lands of the Wurundjeri people – the lands on which many of our team members also live and work from home. Other team members live and work on Bunurong land and Dja Dja Wurrung land.
We also acknowledge the Traditional Owners and Custodians of Country throughout Victoria and pay our respects to them, their cultures, and their Elders past and present. We recognise the deep and enduring connection of Aboriginal and Torres Strait Islander peoples to Country and their continuing custodianship of the land, waterways and seas.
We proudly recognise the First Nations peoples as having the world’s oldest living cultures, and acknowledge that the heritage, traditions and customs of Aboriginal communities throughout Victoria are vibrant, rich and diverse. We value this knowledge and consider it a source of strength and opportunity.
We respect that Elders and other leaders of Aboriginal communities in Victoria are critical to redressing inequality and disadvantage and improving outcomes for Victorian women. Their leadership includes First Nations women, lesbian, gay, bisexual, trans and gender diverse, non-binary, sistergirls, brotherboys, intersex and queer folk who drive gender equality across Victoria. We thank them and honour their important work.
As we reflect on the continuing impact of government policies and practices, we recognise our responsibility to collaborate and work together with First Nations peoples, families and communities towards improved economic, social and cultural outcomes.
Message from the Minister for Women
Victoria is the first and only jurisdiction in Australia to have formally integrated intersectionality into equality law. The Gender Equality Act 2020 (Vic) reflects the Victorian Government’s commitment to ensuring that no Victorian is left behind when it comes to addressing the overlapping systemic and structural drivers of gender inequality. This acknowledgement is critical, as it recognises the diversity of lived experience across Victoria – without it, those most vulnerable in our community will continue to be disproportionately impacted by gender inequality.
Last year, the Commission for Gender Equality in the Public Sector released Victoria’s first ever public sector Baseline Report, which highlighted key data from the first workplace gender audits completed under the Act in 2021.
I am pleased to present the Commission’s Intersectionality Report - Intersectionality at Work: Building a baseline on compounded gender inequality in the Victorian public sector, a companion to the Baseline Report.
This report demonstrates Victoria’s leadership in championing intersectional gender equality, a key theme of Our equal state: Victoria’s gender equality strategy and action plan 2023-2027.
This report analyses workforce and survey data about employees who experience compounding forms of disadvantage and discrimination. It also incorporates key findings and recommendations from intersectional research funded by the Victorian Government.
Thank you to the organisations who collected and submitted this crucial information, as well as the researchers who have helped build the evidence base regarding intersectional gender equality in Victoria’s public sector workplaces. I look forward to sharing these findings and recommendations widely as Victorian public sector organisations prepare to report on their gender equality action plan progress and Victoria strengthens its position as a leader in advancing intersectional gender equality.
We want to ensure that the voices of all Victorians, especially those that are marginalised, are heard so we can all live in a fair and equal state.
The Hon Natalie Hutchins MP
Minister for Women
Message from the Commissioner
Victoria's first Public Sector Gender Equality Commissioner is pleased to deliver 'Intersectionality at work: building a baseline on compounded gender inequality in the public sector'.
As Victoria’s first Public Sector Gender Equality Commissioner, I am pleased to be delivering Intersectionality at work: building a baseline on compounded gender inequality in the Victorian public sector, a companion to the Commission’s 2021 Baseline report. In this report, we have analysed intersectional workforce and survey data from across the Victorian public sector, and drawn on research funded by the Commission, to provide an overview of the state and nature of intersectional workplace gender inequality in Victoria.
For the first time in 2021, almost 300 organisations covered by the Gender Equality Act 2020 (Vic) collected and submitted intersectional workforce and employee experience survey data to the Commission. As with many firsts, when defined entities submitted their intersectional data, the Commission found significant data gaps and inconsistencies in the way this data was collected and provided. This made it difficult to collate and analyse the data accurately and meaningfully. As a result, in our Baseline report we committed to funding a suite of intersectional research and to taking the additional time needed for the more complicated data analysis required, with the goal of releasing this companion report in 2023.
I want to thank all the staff who supported their organisations to prepare and submit this data, as well as the researchers who have played a key role in helping the Commission to build a foundational evidence base of intersectional insights. The collection and analysis of this data marks a crucial and long overdue shift in the maturity of how we understand gender inequality. This report shows that compounding forms of discrimination have notable impacts on career progression, pay inequality, and the experience of sexual harassment and discrimination at work. As such, an intersectional approach to gender equality is no longer a nice to have, it’s a must have – without it, our work will continue to reproduce some of the very patterns of inequality we seek to address.
Research we commissioned in 2021 and 2022 found that despite the existence of Diversity, Equity and Inclusion (DEI) initiatives across the Victorian public sector, women facing intersecting forms of discrimination continue to experience disproportionate levels of workplace discrimination. When data on intersectional attributes is collected, these experiences become visible. The use of an intersectional lens in data collection, analysis and interpretation will help us to identify the unique barriers marginalised people face in the workplace. This will, in turn, help us curate impactful, tailored solutions to these issues.
There are significant improvements that need to be made at an organisational level to create a culture of safety across workplaces, so staff feel comfortable sharing intersectional data. Findings from our 2021 and 2022 research grants show that reports of discrimination and harassment are not being properly addressed at the managerial level. Intersectional gender inequality is everyone’s business, and senior leaders in particular, have a positive duty and responsibility to ensure that workplaces take action to achieve gender equality from the top-down. Leaders must actively model, prioritise and drive a culture of safety in their organisation and ensure accountability and buy-in from middle managers. Without this, DEI initiatives will fail to challenge structural inequalities, as staff are expected to assimilate into the existing status-quo.
I want to recognise the effort that has gone into creating this report – the first of its kind in Australia to collate and analyse intersectional public sector workforce data. While there is still much progress to be made, I am confident that Victoria will continue to lead by example in addressing the overlapping systemic and structural drivers of gender inequality within the workforce, inspiring other jurisdictions to do the same.
Dr Niki Vincent
Public Sector Gender Equality Commissioner
Executive Summary
The Commission for Gender Equality in the Public Sector is driving intersectional gender equality through the Gender Equality Act.
Driving intersectional gender equality through the Gender Equality Act 2020 (Vic)
Under the Gender Equality Act 2020 (Vic) (the Act) organisations covered by the Act ‑ known as defined entities – are subject to a number of obligations that require them to take positive and transparent action towards achieving gender equality in their workplaces and in their public policies, programs and services.
One part of what makes the Act nation leading is that it explicitly invokes the concept of compounded inequality (Ryan et al. 2022). The Act states that, where possible, the data that defined entities collect should capture not only gender, but also intersecting forms of disadvantage or discrimination that a person may experience based on Aboriginality, age, disability, ethnicity, gender identity, race, religion, sexual orientation and other attributes. The Act requires defined entities to use this data to drive positive and transparent progress towards intersectional gender equality.
The Commission is committed to supporting defined entities to meet their obligations under the Act through improved training, education, and guidance resources. This report represents the first step in building a baseline for ongoing progress on intersectional gender equality in Victoria. Across 5 chapters, it investigates how the intersection of gender and one other attribute (Aboriginal and/or Torres Strait Islander status, age, ability, cultural and racial marginalisation, and LGBTIQ+ status) shape workplace experiences. These findings demonstrate how gender inequality is compounded by other forms of discrimination in the Victorian public sector, offering useful starting points for organisations considering how to best implement meaningful change.
The pay gaps experienced by people facing intersecting inequalities must be closed
The Commission’s audit data demonstrates that many groups that face intersecting forms of discrimination and disadvantage experience significant pay gaps. Pay gaps were largest between First Nations women when compared with non-Indigenous men, at 21% across all industries covered by the Commission’s audit data. The public health industry recorded the largest pay gap between these two groups at 35%. While the pay gaps between First Nations men and non-Indigenous men (12%), and non-Indigenous women and men (15%) were also high, the much larger gap in salaries for First Nations women clearly demonstrates the negative and compounding effects of inequality based on gender and First Nations status. However, no pay gap should remain unaddressed.
Likewise, the Commission’s audit data demonstrated that women with disabilities experienced large pay gaps when compared with men without disabilities, at 19% across all industries. The pay gap between men with disability and men without disability was approximately half the above at 10%, while the pay gap between women and men without disabilities across all industries was 13%, again demonstrating the negative and compounding effects of inequality based on gender and ability. Women with disability also had lower levels of confidence in the promotion practices in their organisations. This may indicate barriers to accessing career progression that could further impact the salaries of women with disabilities. Further research is required to understand these connections.
Pay gaps were also significant between culturally and racially marginalised (CARM) women and non-CARM men (19%), and between trans, non-binary and other gender diverse employees and cisgender men, both at 18%. The pay gaps between CARM men and non-CARM men (11%) and non-CARM women and men (13%), as well as between cisgender women and cisgender men (15%) – while still high – were notably smaller. As stated above, no pay gap should go unaddressed. However, these findings again highlight the negative and compounding effects of gender and CARM status on pay inequality.
High rates of sexual harassment among certain groups require urgent attention
Younger women, people with disabilities and LGBTIQ+ people reported experiencing markedly high rates of sexual harassment in Victorian public sector workplaces. Fourteen per cent of women aged 15-24 and 11% of women aged 25-34 reported experiencing sexual harassment in the previous 12 months. This compares to 4% and 5% respectively of men in the same age groups.
Twelve per cent of women with disabilities reported experiencing sexual harassment, a figure 4% higher than men with disability, twice the rate of women without disabilities, and 4 times the rate of men without disabilities. These findings reflect existing research, which has described rates of sexual violence against women with disability in Australia as ‘endemic’ (Dowse et al. 2016). The relatively higher rate of the experience of sexual harassment reported by men with disability also demands attention.
While gay men and straight women reported similar rates of experience of sexual harassment (7% and 6% respectively) this was double the rate reported by straight men (3%). All other non-heterosexual women and men reported much higher rates of the experience of sexual harassment (between 10-15%). Transwomen and other trans, non-binary or gender diverse people also reported far higher rates of experiencing sexual harassment (16% and 15% respectively) than transgender men (8%) and cisgender women (6%) and men (4%). Thus, while the experience of sexual harassment is unacceptable for anyone, this is an issue of particularly urgent concern for those who are not cisgendered men and/or straight men.
The underrepresentation of CARM women in senior positions across the Victorian public sector is concerning
Only 3% of CARM women reported that they held a senior management role, and only 9% were in a supervisory position (compared with non-CARM men at 14% and 21% respectively). While CARM women experience even worse leadership outcomes than other disadvantaged groups, such as First Nations women (with representation at 6% and 11% respectively), women with disabilities (with representation at 5% and 12% respectively) and transwomen (at 4% and 10% respectively), the low representation of all these groups of women in senior management and supervisory roles needs to be addressed. It is notable that CARM men are also poorly represented in leadership positions, with only 6% in senior manager roles and 13% in supervisory positions - similar to non-CARM women at 7% and 15% respectively, and with comparable pay gaps in some industries.
Age continues to amplify women's experiences of workplace gender inequality
As noted above, the Commission’s data demonstrates that age and gender combine to increase the risk of sexual harassment for young women in the Victorian public sector. Women at the midpoint of their careers also experience the compounded effects of gender and age discrimination, with pay gaps widening and leadership opportunities diminishing. In this stage of life, gendered norms around care work begin to significantly impact upon women’s ability to prioritise their careers in the same way as men. Over time, the compounding effects of age and gender discrimination result in a gender pay gap favouring men in every age bracket increasing from 25-34 until 55-64, after which it tapers off slightly.
Organisations must do more to address the negative workplace experiences of some LGBTIQ+ employees
There is a troubling lack of available data pertaining to the experiences of non-binary and gender diverse people. These groups report lower salaries than their cisgender colleagues and are the least likely of any gender identity to agree that recruitment and promotion process in their organisation are fair. Better data collection in relation to gender diverse employees will help to make the experiences of this cohort visible. Better data is also crucial to grounding and focussing interventions to address the issues.
Lesbian women are an exception to the wider finding that women facing compounding inequalities tend to experience an income penalty
Lesbian women in the Commission’s data set had, on average, higher salaries than bisexual and pansexual men and women in all other sexuality groups. Lesbian women also held managerial positions at a similar rate to both straight and gay men. This finding could point to lesbian women’s increased ability to avoid traditional heterosexual divisions of labour, enabling them to focus more on their career development. Further research is required to better understand these findings.
The Commission’s data may signal positive change in relation to diversity, inclusion and safety in some areas
Indigenous and non-Indigenous women and men were roughly equally likely to report that the recruitment and promotion practices in their workplace were fair. CARM women and men also reported lower instances of sexual harassment than their non-CARM colleagues of the same gender. However, it is unclear whether these more promising findings indicate that groups experiencing intersectional discrimination face fewer instances of workplace inequality in public sector workplaces compared to other sectors, or whether they are instead indicative of reporting challenges which can skew the accuracy of data.
In the case of sexual harassment reporting in particular, data accuracy is known to at times be limited, because diverse groups may understand or identify incidences of sexual harassment differently (Respect@Work n.d). However, the fact that the People matter survey (PMS) is an anonymous survey that asks questions about experiences of specific behaviours is a positive sign that diverse employees in Victorian public sector workplaces may feel less discriminated against and experience lower rates of sexual harassment than diverse workers in some other sectors. The Commission’s sexual harassment reporting data may have also been skewed in this reporting period by the COVID-19 context, where public sector workers were likely to be working from home rather than in the office. Given the Commission’s funded research highlights the continued negative workplace experiences of both First Nations and CARM women, there is still work to be done to ensure workplace gender equality for all (Bargallie et al. 2023; Cho and Segrave 2023).
Better data is crucial for ensuring better workplace outcomes for everybody
Improved intersectional data collection practices, built on the inclusion of diverse voices, are crucial for driving positive change in organisations. Organisations must carefully consider their approach to intersectional data collection, analysis and interpretation. At every stage of the data collection, analysis and interpretation process, organisations should meaningfully engage diverse voices in their organisation to ensure that their practices and approach to addressing intersectional gender equality are reflective of, and responsive to, lived experiences of disadvantage and discrimination in their workplaces. Demonstrating commitment to consultation and meaningful input from diverse voices will also help organisations to build the trust and accountability necessary for individuals to feel comfortable sharing their personal information.
Introduction
An introduction to the Gender Equality Act 2020 and this Intersectionality at Work report, including methodology and structure of the report.
The Commission for Gender Equality in the Public Sector
The Commission for Gender Equality in the Public Sector (the Commission or CGEPS) was established after the Gender Equality Act 2020 (Vic) (the Act) passed in February 2020. The Commission supports the Public Sector Gender Equality Commissioner (the Commissioner) to oversee the implementation of the Act and promote gender equality in the public sector workforce and the broader Victorian community.
The Act is a ground-breaking piece of legislation that requires certain public sector organisations in Victoria to take positive action towards achieving gender equality in the workplace and the community. It does so by requiring these organisations to:
- Report on key gender equality measures by undertaking a workplace gender audit every 2 years;
- Demonstrate how they plan to improve gender equality in their organisation by developing a Gender Equality Action Plan every 4 years;
- Make reasonable and material progress in relation to the Act’s workplace gender equality indicators every two years; and
- Account for the gendered impacts of all policies, programs and services with significant public impact by undertaking gender impacts assessments.
Organisations with obligations under the Act (referred to as ‘defined entities’) include all Victorian public sector organisations with 50 or more employees as at June 30 each year, as well as local councils and universities.
The Act represents an ambitious step up in equality law in Australia, by imposing a positive duty on defined entities to consider and promote gender equality. It is also the first piece of Australian legislation to officially acknowledge the potential for compounding effects of multiple forms of disadvantage or discrimination. This focus on the way in which gender inequality can be compounded by other forms of inequality was a key request from community groups and other participants during the Act’s consultation process.
For a more detailed background to the Act and the Commission, please see the companion to this report, the Baseline report (2022).
This report
Organisations covered by the Act are subject to several obligations that require them to take positive and transparent action (and make meaningful progress) towards achieving gender equality in their workplaces, public policies, programs and services. For the first time under Australian gender equality reporting legislation, these organisations are encouraged to provide data disaggregated not only by gender, but across a range of attributes listed in the legislation:
- Aboriginality
- age
- disability
- ethnicity
- gender identity
- race
- religion
- sexual orientation
- other attributes.
Through this data collection, organisations are encouraged to consider how experiences of disadvantage or discrimination on the basis of these attributes might compound or shape experiences of gender inequality. That is, organisations are encouraged to consider intersectionality.
In this report, the Commission presents an analysis of the data collected by defined entities as part of the inaugural workplace gender audit under the Act undertaken in 2021. This analysis is combined with findings from projects funded as part of the Commission’s Research Grants Round 2022.
This report is intended to be read as a companion piece to the Baseline report – 2021 workplace gender audit data analysis, which the Commission released in 2022 following the inaugural audit. The Baseline report presented a snapshot of the state and nature of gender equality across the 298 defined entities that were required to report under the Act at that time. In so doing, it offered the Commission, defined entities and the wider Victorian community a starting point for tracking change against the seven gender equality indicators under the Act (outlined below). In addition, it helped to locate the gaps and challenges for progressing gender equality in Victoria and offered insights into how defined entities can best target efforts towards positive change.
Through its reporting platform, the Commission collected 67 million data points in 2021, which represents the most comprehensive gender-disaggregated dataset on public sector organisations in Australia. Despite the significance of the scope of this data, the inaugural audit also revealed several areas of limited data availability and poor data quality - particularly in relation to data about people who experience intersecting forms of disadvantage and discrimination. Many organisations required to report under the Act are continuing to develop the necessary human resources systems to collect data about employee identity in a sensitive manner. These data challenges at the organisational level translate into challenges for rigorous data analysis for the Commission. Additionally, the sensitive nature of data related to the personal attributes of individuals meant that the Commission felt a significant responsibility to analyse and represent this information accurately and meaningfully. For this reason, the Commission chose to release this separate report, allowing time to carefully interrogate the data and ensuring that the data about people experiencing intersecting forms of disadvantage and discrimination were given due focus and attention.
What is intersectionality?
Intersectionality is a term that was coined in 1989 by Professor Kimberlé Crenshaw to explore how systems of power, such as gender, race, and class, ‘intersect’ to shape experiences of the social world. Originally set out in the context of legal scholarship, Crenshaw (1989) was concerned that legal decisions dealing with racial discrimination and sex-based discrimination were failing to conceptualise how, for example, Black women’s experiences are shaped by racism as well as sexism, and by a unique combination of both. In other words, Crenshaw argued that when Black women are treated as purely Black or purely women, the law is unable to account for the specific challenges they face – challenges which diverge from those faced by Black men or white women (see also Moraga and Anzaldúa 1981; Collins 1990).
Since 1989, public awareness of the importance of intersectionality for understanding issues of discrimination and disadvantage has grown dramatically. While there are still debates in relation to intersectionality theory and its application (e.g. Collins and Chepp 2013; Cho and Segrave 2023), understanding how discrimination on the basis of attributes such as Aboriginality, age, disability, ethnicity, gender identity, race, religion, and/or sexual orientation can combine with gender discrimination to influence a person’s workplace experiences and outcomes is crucial to ensuring progress towards gender equality is progress for all.
Measuring and applying intersectionality
Approaches to ‘doing’ intersectionality in the workplace, including applying an intersectional lens to workforce data, are still being developed and often have limitations (Blackham et al. 2024 forthcoming). Despite these challenges, considering intersectionality in workplace equality initiatives is important. The Commission is committed to continuous improvement in relation to fulfilling the intersectional objectives of the Act, and to helping defined entities build their capability to progress intersectional gender equality.
In this report, the Commission has only been able to consider the kinds of inequalities produced by gender-based discrimination and one other axis of marginalisation, for example, gender and disability, or gender and Aboriginality. In reality, the lives of Victorians are much more complex than this. For example, people with disability may also be members of the LGBTIQ+ community, have demanding caring responsibilities, live in rural towns without adequate services, and/or belong to migrant communities (for further information on gendered experiences in rural contexts, see Tischler et al. 2023). Accounting for these differences is crucial to understanding the lived experiences of Victorian employees. However, while generalisations can mask significant variations in the experiences of members within a marginalised group, they are often necessary to identify broader trends. The ‘gender-plus-one-other-attribute’ approach here is designed to focus on patterns of systemic inequality and respond to practical considerations related to the data.
Finally, the Commission shines a spotlight on groups which face discrimination and disadvantage in this report, but it does not mean to imply that these groups are disempowered. Instead, the report strives to centre their voices as well as their ongoing activism and courage in the face of systemic discrimination. In the past, government data collection about marginalised groups was sometimes used against those groups (D’Ignazio and Klein 2020; Kukutai and Taylor 2016). Collecting data about people therefore comes with responsibility, and the Commission is committed to using data to drive positive social change. Better data is key to driving change initiatives which are responsive to the lived experiences of employees. Their voices and partnerships are crucial for providing the necessary scaffolding to accurately interpret quantitative data points. The Commission engaged lived-experience expertise at various points in the development of this report, as outlined below.
Methodology
Background
Under the Act, every defined entity was required to undertake a workplace gender audit in order to assess the state and nature of gender inequality in its workplace as at 30 June in the Gender Equality Action Plan reporting year. The first reporting year was 2021.
The Commission for Gender Equality in the Public Sector published workplace gender audit guidance in 2020 to advise defined entities of how to undertake a workplace gender audit.
The workplace gender audit required the collection of gender-disaggregated data – which is data that is broken down separately for women, men and gender diverse people – against the 7 workplace gender equality indicators set out in the Act. The indicators are:
- gender composition of all levels of the workforce
- gender composition of governing bodies
- equal remuneration for work of equal or comparable value across all levels of the workforce, irrespective of gender
- sexual harassment in the workplace
- recruitment and promotion practices in the workplace
- availability and utilisation of terms, conditions and practices relating to family violence leave, flexible working arrangements and working arrangements supporting workers with family or caring responsibilities
- gendered segregation within the workplace.
If available, defined entities were also required to report data about Aboriginality, age, disability, ethnicity, gender identity, race, religion and sexual orientation and were required to have regard to the disadvantage or discrimination that a person may experience on the basis of these attributes in addition to gender inequality (i.e. compounded or intersectional gender inequality).
Data measures and types
As part of the 2021 workplace gender audit, organisations covered by the Act collected two categories of data – workforce data and employee experience data. The workforce data was extracted from defined entities’ internal data collection systems and provided to the Commission through an Excel template that was uploaded through the Commission’s reporting platform. The employee experience data was collected through surveys.
Information provided to the Commission for Gender Equality in the Public Sector was managed in line with relevant privacy laws. Defined entities were responsible for their own compliance with relevant privacy laws, including the Privacy and Data Protection Act 2014 (Vic) (PDP Act).
Workplace gender audit data quality
The most common issue observed with audit submissions was missing data. The inaugural audit was the most comprehensive workforce data collection exercise many organisations had ever undertaken, so some gaps in datasets were anticipated by the Commission.
Aside from age and gender, the Commission learnt that most organisations do not yet collect the demographic data required for intersectional analysis. Because of this, the anonymous People matter survey, outlined below, is the primary source of data analysed in this report.
Furthermore, the 2021 workplace gender audit also contained very little workforce data in relation to gender diverse employees. While the People matter survey data that is the focus of this report included trans and gender-diverse respondents, the number of respondents in these groups who identified themselves as also being a First Nations person, a person with disability, or from a culturally and racially marginalised background were too few to meaningfully analyse. As such, the experiences of trans and gender-diverse employees are primarily discussed in Chapter 5, which examines LGBTIQ+ workers specifically. In this report, the Commission acknowledges this lack of data on trans and gender-diverse people has meant that issues are generally only able to be analysed and discussed for women and men.
Employee experience data and the People matter survey
In order to fulfil the employee experience data component of the workplace gender audit in 2021, organisations had three options:
- undertake the People matter survey or the People matter survey for local government (collectively referred to in this report as the People matter survey, or PMS) administered by the Victorian Public Sector Commission (VPSC)
- use a third-party provider to independently administer the survey
- conduct the survey in-house.
The VPSC administered the questions required by the Commission for Gender Equality in the Public Sector via the People matter survey to about 90% of organisations covered by the Act. Each organisation covered by the Act was surveyed separately, and the results were reported as percentages of respondents. Items with fewer than 10 responses were suppressed by the survey provider to protect respondents’ privacy.
The VPSC also provided the raw survey data for all participating defined entities to the Commission in late 2022. That is, the Commission has access to a results database that includes the responses to the required 2021 workplace gender audit questions from each individual respondent in a participating defined entity. The analyses undertaken in this report using People matter survey data are based on this raw data. This allows the Commission to calculate percentages for different groups across the whole dataset.
In this report, the Commission’s analysis of the People matter survey data includes data from all defined entities that participated in the survey. This includes local government organisations who opted to take part. It excludes any organisation which was not a defined entity in 2021 but has since become so. It also excludes universities, bodies which do not take part in the People matter survey, or any public sector organisation that was eligible to participate in the People matter survey, but opted out.
It is important to note that the People matter survey data analysed here is a different sample to that used by the Victorian Public Sector Commission. The VPSC’s reporting of the People matter survey results does not include local government organisations. It does, however, include smaller public sector organisations that do not meet the threshold to become defined entities under the Act. These differences are responsible for any discrepancies between these analyses.
It is also important to acknowledge the differences between the analyses contained in this report, and the data presented in the Commission’s 2022 Baseline report. The Baseline report primarily analysed the 2021 workplace gender audit workforce data. As such, workforce figures reported reflect the total number of employees reported on by organisations that completed a 2021 audit. Because the current report draws more extensively on the People matter survey data, the figures are reporting on a different population. Not only does the People matter survey data only cover approximately 90% of organisations with reporting obligations under the Act, but individual employees also choose whether or not to complete the survey. As such, rates of – for example – part-time work reported in the People matter survey may differ from rates of part-time work reported in the workforce data. Any apparent discrepancies between the Baseline report and this Intersectionality report stem from the different populations being examined.
Key characteristics of the People matter survey dataset analysed here by the Commission are that:
- The sample included 106,069 respondents of which 30% (31,443 people) were men, 58% (61,706 people) were women, 1% (580 people) were non-binary, 0.3% (347 people) reported a self-described gender and 11% (11,993 people) of people opted to not report a gender
- The VPSC reported survey results had an overall response rate of 39% - the Local Government portion of the survey had a 32% response rate
- The salary distribution of respondents does not match those found in the workforce data reported to the Commission, with people on lower salaries over-represented in the survey.
It should also be noted that some participants elected to use the available free-text field to describe their gender, rather than selecting from the available options. These responses have been excluded from the analysis in this report. This is because these responses are not homogenous and cannot be analysed as a group. In addition, given these respondents explicitly chose not to select from the available options, they cannot be integrated into the existing gender categories as it would not be appropriate to make assumptions about what category to include them in.
Estimated pay gap calculation
Because of the significant gaps in the intersectional workforce data submitted to the Commission, it was not possible to calculate accurate pay gaps using the exact salaries of employees in defined entities. Instead, a measure for estimated pay gaps was developed by assigning base salaries in the workforce data (i.e., actual salaries recorded in payroll systems) to the People matter survey base salary ranges selected by diverse respondents. Respondents to the People matter survey in 2021 were able to select their yearly income from salary brackets increasing in $10,000 increments. These ranged from ‘Less than $45,000’, followed by ‘$45,000-$54,999’, through to ‘$175,000-$184,999’ and finally ‘$185,000 or more’. Respondents were also given the option to select ‘Prefer not to say’.
To get a more accurate understanding of pay in particular organisations, median base salaries within every salary range were calculated for each defined entity and each industry group (so the mid-point of all reported salaries for that organisation or industry within each pay bracket). This median was taken from the workforce data for all employees (regardless of gender and other attributes). These median base salaries for each organisation and in each $10,000 bracket available in the People matter survey were then assigned to each respondent to the survey.
The median base salaries assigned to individual respondents to the survey were then used to calculate an overall median for each specific group that was reported on (e.g. ‘Aboriginal and/or Torres Strait Islander Women’ or ‘Men with disabilities’). This median for a particular cohort was then used to calculate an approximate pay gap between two specific groups.
These pay gaps are not calculated on the actual salaries of the individuals in each group and are therefore estimated only.
Funded research Grants
In addition to the 2021 workplace gender audit data and the People matter survey, insights in this report are also drawn from research funded under the Commission’s Research Grants Round 2022. This round of funding was focussed on contextualising and deepening the Commission’s understanding of the inaugural audit data, primarily by applying an intersectional lens. Studies funded under the scheme were required to collect qualitative data to complement the quantitative audit data, and examine how experiences of gender inequality are shaped or compounded by other forms of discrimination or disadvantage.
The following 5 projects received funding:
- ‘Make Us Count: Understanding Aboriginal Women’s Experiences in Victorian Public Sector Workplaces’ – Associate Professor Debbie Bargallie, Griffith University
- ‘Caring and Workplace Gender Equality in the Public Sector in Victoria’ – Associate Professor Alysia Blackham, The University of Melbourne with the Australian Discrimination Law Experts Group
- ‘Getting on at Work: Progression and Promotion of Women with Disability in the Victorian Public Service’ – Dr Jannine Williams, Queensland University of Technology with the Disability Leadership Institute and the Victorian Public Service Enablers Network
- ‘Victorian Local Councils and Gender Equality: Examining Commitments to Diversity and the Experiences of Women from Migrant and Refugee Backgrounds’ – Dr Hyein (Ellen) Cho, Monash University
- ‘Rurality and Workforce Participation: Exploring Prevalence of Part-time and Insecure Work in Grampians Public Sector Roles’ – Dr Cathy Tischler, Federation University with Women’s Health Grampians, ByFive and the Wimmera Development Association
In relation to the first 4 projects listed above, the research findings are principally discussed in chapters one, two, three and four respectively. The final project examining rural experiences in the public sector does not relate directly to a specific chapter in this report (or a specific intersectional attribute listed in the Act). Instead, insights from this important project are presented in a ‘special look’ section of this report.
Language, lived experience perspectives and gender-inclusivity
Preferred language and terminology used to identify and describe marginalised groups of people is constantly evolving. In this report, the Commission seeks to centre the voices of people with lived experience of discrimination. As such, wherever possible, the report adopts the preferred terminology of marginalised groups, while acknowledging that these conversations are far from settled.
Another way the Commission seeks to centre the voices of marginalised groups is through ensuring diverse perspectives contributed to this report. The funded research grants included in this report were led by academics with lived experience of the intersecting forms of inequality their grant examined, and participants in the studies had lived experiences of intersecting inequalities in public sector workplaces. In addition to this, the Commission invited lived-experience experts and other specialists to review the report in part or whole. These reviewers included:
- Claire Mumme and Nick Logan. Victorian Public Sector Commission
- Diana K. Piantedosi. Director of Policy, Advocacy and Community Engagement at Women with Disabilities Victoria
- Maria Watson-Trudgett. First Nations Consultant
- Yasmin Poole. Master in Women’s, Gender and Sexuality Studies Graduate, University of Oxford
- The VPS Women of Colour Network (WoCN) also provided several reviews and input, which were taken into consideration where possible when finalising the report.
The Commission would like to thank our research partners and participants, generous reviewers, and employees in our defined entities – especially those who work to drive gender equality for everyone in their organisations. While the Commission is thankful for these contributions, responsibility for the final version of this report rests with the Commission.
Lastly, there is very little workforce data and research in relation to gender-diverse Australians. This group also may not feel safe to disclose their gender in official contexts, including the workplace. As such, much of this report discusses gender in binary terms, reflecting the available data across both the broader research landscape, as well as within the Commission’s own data collection. The Commission expects that the Act will drive improved data collection and quality in Victoria to reflect the gender diversity that exists in our society. Changes in research and data collection are essential to make gender-diverse cohorts visible.
Structure of the report
In the Baseline report, the Commission used the 7 gender equality indicators under the Act to organise individual chapters. While this approach was extremely useful in the context of reporting on gender disaggregated data, it is less so in the context of intersectional data. All the groups highlighted here experience multiple forms of structural disadvantage, which tend to result in worse outcomes in relation to the indicators.
To best highlight intersectional experiences, this report offers 5 chapters investigating how the intersection of gender and one other attribute shape discrimination and disadvantage in public sector workplaces. These are:
- Gender and Aboriginal and/or Torres Strait Islander employees
- Gender and employees of different ages
- Gender and employees with disabilities
- Gender and culturally and racially marginalised employees
- Gender and LGBTIQ+ employees.
The chapters are presented in the same order as each of these attributes in the Act. Each chapter begins by offering background information on the status of the group in Australian society, followed by a short literature review of key workplace issues impacting that group, with a focus on how these are gendered. This is followed by intersectional data analysis about the cohort, drawn from the Commission’s 2021 workplace gender audit, as well as an overview of findings drawn from the Commission’s Research Grants Round 2022. The Commission acknowledges that these chapters do not represent a comprehensive view of intersecting forms of discrimination in Victorian public sector workplaces. Rather, the 5 chapters reflect the data collected by the Commission about groups that experience systemic forms of disadvantage.
As discussed above, in the 2021 workplace gender audit, only a small proportion of defined entities returned reliable workforce data in relation to intersectional attributes. As such, the final ‘Recommendations’ chapter offers insights into tangible ways that defined entities can improve their approach to collecting data about marginalised groups, with a particular focus on privacy and ensuring employees feel safe to disclose sensitive information about themselves.
Chapter 1: Gender and Aboriginal and Torres Strait Islander Employees
This chapter looks at the intersectional data in relation to gender and Aboriginal and/or Torres Strait Islander employees
This report uses a variety of terminology when referring to Australia’s First Peoples. Blanket terms favoured by governments such as ‘Aboriginal and Torres Strait Islander’ or ‘Indigenous’ are unable to account for the diversity that comprises the hundreds of Nations and language groups residing across this continent. While some peoples prefer to be acknowledged by their particular group or clan name, others prefer the term ‘First Nations’ (Diversity Council Australia 2021:9). With respect to continuing (cultural) diversity, this report proceeds by following in the footsteps of the authors of the Commission’s funded research project (Bargallie et al. 2023), as well as the recent Gari Yala (Speak the Truth) report. Here, the Commission uses ‘Aboriginal and/or Torres Strait Islander peoples’ or ‘First Nations peoples’ interchangeably with ‘Indigenous’ for brevity. The phrase Aboriginal and/or Torres Strait Islander is used throughout this report to include individuals who are both Aboriginal and Torres Strait Islander, as well as one or the other. When the term ‘Indigenous’ is used, where applicable, the Commission writes ‘Indigenous peoples’ to foreground and draw attention to existing diversity. The Commission acknowledges that issues of terminology and naming are contentious and apologises for any inadvertent offence caused.
Indigenous Australians represent the oldest living continuous cultures in the world, comprise approximately 3.8% of the total population and are dispersed across hundreds of Nations and language groups (AIHW 2023a). Yet, First Nations peoples in Australia experience systemic forms of discrimination and disadvantage. Significant gaps remain between Indigenous Australians’ and non-Indigenous Australians’ outcomes across several key indicators such as wealth, income, employment, educational attainment and wellbeing (AHRC 2020:48). The systemic inequalities that First Nations peoples experience today are shaped by the historical and ongoing impacts of colonisation and dispossession.
Prior to colonisation in 1788, Aboriginal and Torres Strait Islander peoples had well-developed systems of work and governance. These systems were severely disrupted by the arrival of British colonisers (Evans 2021:8), who stole First Nations people’s land and exploited their labour. Large numbers of Aboriginal and/or Torres Strait Islander peoples—including children—were removed from their families and communities and forced to work on missions, settlements, reserves and stations (Kidd 2000). Significant abuse and exploitation were often gendered, with Indigenous women and girls subjected to forced menial and domestic labour, and physical and sexual abuse (Bargallie et al. 2023:16). Indigenous men and boys were more commonly used for unpaid pastoral work and physical labour (Bargallie 2020:50).
Since colonisation, First Nations peoples have continued to be disadvantaged when it comes to paid work. These disadvantages have stemmed from interlinked and systemic legal and cultural inequalities, including laws that discount or punish traditional cultural practices and Indigenous ways of knowing (Bargallie 2020:50-51), and racist stereotypes of Indigenous peoples as lazy and incapable of governing their own lives (Bargallie 2023). The Challenging Racism Project 2015-16 found that First Nations peoples experience one of the highest levels of everyday racism in Australia (25% higher than for non-Indigenous people) (Blair et al. 2017:10). Half of First Nations peoples experience discrimination in the workplace (50.4%), as compared to only a third of non-Indigenous people (32.4%). First Nations peoples have always engaged in various forms of solidarity and resistance to both structural and everyday racism. Nonetheless, the impacts of colonialism continue to produce multiple social, cultural, geographic and economic factors that negatively impact upon First Nations Australians’ lives today (Australian Government 2020). Racism in broader Australian government policies, particularly the White Australia policy, is discussed in more detail in Chapter 4: Gender and culturally and racially marginalised employees.
This chapter explores the intersection of discrimination against First Nations peoples and people of different genders in the workplace. However, there is very little workplace data and research in relation to Australians who are both Indigenous and gender diverse. The Commission expects that the Gender Equality Act 2020 (Vic) (the Act) will drive improved data collection and quality in Victoria to reflect the gender diversity that exists in our society and make gender-diverse cohorts visible. In this chapter, the Commission acknowledges this lack of data on trans and gender-diverse people has meant that issues are generally only able to be analysed and discussed for women and men.
Key workplace issues for Aboriginal and/or Torres Strait Islander peoples
Between 2008 and 2018, the Closing the Gap target to halve the gap in employment outcomes between Indigenous and non-Indigenous people was not met in any Australian state or territory (Australian Government 2020). An increased emphasis on caring responsibilities within First Nations communities, in combination with poorer health outcomes overall (including a reduced life expectancy and higher rates of mental illness), higher rates of children in out-of-home care, and higher rates of incarceration and exposure to violence, create barriers to accessing employment (Bargallie et al. 2023:16; Australian Government 2020;). Indigenous Australians continue to be, on average, less likely to be employed, are paid less, and are less likely to be in leadership roles than non-Indigenous Australians (WGEA 2023). In 2018, 49.1% of First Nations Australians of working age participated in the workplace in some form. For non-Indigenous Australians, this percentage was 75.9% (Minderoo Foundation 2022:16).
Demand and supply side barriers limit First Nations peoples’ likelihood of securing and retaining jobs (Biddle et al. 2023). On the demand side, workplace discrimination is a common issue reported by First Nations people (VPSC 2023a). For example, the Indigenous Employment Index has found that over half of the Indigenous Australians interviewed reported experiences of direct or indirect racism when at work (Minderoo Foundation 2022:31). Research also directs attention to the negative impacts of daily racial microaggressions, that is, everyday derogatory and hostile behaviours, practices, and processes that First Nations Australians must negotiate in the workplace, but which often remain invisible to non-Indigenous people (Bargallie 2020:103). Geography is another key ‘demand side’ barrier. First Nations peoples living in urban areas are more likely to be employed than those living in non-urban areas (45% compared to 35%) (ABS 2016). On the supply side, Biddle et al. (2023) note health and education outcomes and caring responsibilities as key workforce participation barriers.
Issues of retention and career advancement are also common among First Nations peoples in Australian workplaces, including in the public sector. Recent analysis by the Victorian Public Sector Commission (2023b) found that in 2022, 1.2% of Victorian Public Service (VPS) employees identified as Aboriginal or Torres Strait Islander, and of these, most were paid at the less senior VPS grades four (16.7%) and five (23.7%). The numbers of First Nations peoples employed at higher levels reduces significantly, with 9.5% of Aboriginal and/or Torres Strait Islander staff employed at VPS grade six, 0.4% at the level of senior technical specialist, and 3.5% at the executive level. This reduction in representation of First Nations peoples in more senior levels is also visible in the New South Wales Public Service. A 2021 report shows that First Nations peoples are more concentrated in grades 1/2 and 3/4, at 5.3% and 4.8% of total employees at each level (NSW Public Service Commission 2021). At the highest non-executive level, grade 11/12, the percentage drops to 2.2% of the total number of employees (NSW Public Service Commission 2021).
Key workplace issues for Aboriginal and/or Torres Strait Islander women
Workplace discrimination and barriers to workforce participation
The Gari Yala (Speak the Truth): Gendered Insights report (2021:3) notes the problems that can arise when researchers make comparisons between men and women within First Nations communities, discussing how this can impose Western values or create an additional divide between members of an already marginalised group. Nonetheless, the report also emphasises that gendered analysis remains crucial in the context of employment outcomes for Aboriginal and/or Torres Strait Islander women. Not only are First Nations women likely to experience gender discrimination as women, but they are also likely to have unique experiences of inequality as First Nations women.
While there is a lack of research examining First Nations women’s workplace experiences (see Evans 2021:2), information that does exist suggests that they face compounded forms of discrimination and disadvantage due to their gender and their Aboriginal and/or Torres Strait Islander identity (Bargallie et al. 2023:12).
In the contemporary context, First Nations men are more likely to be employed than First Nations women in the 15-64 age group (37.9% compared with 18.4%) (AIHW 2021). Indigenous women are half as likely as Indigenous men to own or manage a business, they are overrepresented in lower weekly income brackets and underrepresented in the highest brackets, and they are less likely to be supported in the workplace if they encounter racism or experience culturally unsafe situations (Evans 2021:1; WGEA 2023).
Cultural load and unpaid labour
Cultural load is the extra, often invisible, workload attached to Indigenous employees. This includes, but is not limited to, requests or expectations to educate non-Indigenous colleagues about the histories and practices of Aboriginal and/or Torres Strait Islander peoples, reviewing culturally sensitive material, caring responsibilities, attending ‘Sorry Business’, living and working on Country, racism, tokenism and lateral violence (VPSC 2023a). The Gari Yala (Speak the Truth): Gendered Insights report identified gender-based inequalities in relation to this additional work:
- Indigenous women experience the highest burden of this unpaid labour, reflecting research that shows non-Indigenous women are more likely to be asked to undertake undervalued work assignments which do little to advance their careers (Evans 2021:7).
- Indigenous women in management roles have a higher cultural load than those in lower levels (Evans 2021:1).
- Men in management often work in organisations with higher levels of support, where they can work more effectively as agents of change (Evans 2021, p.1).
- Indigenous women who are also carers have the highest cultural load (Evans 2021:9).
While this work is often important and may be personally fulfilling, it is frequently overlooked by managers and can also impede career progression (Evans 2021: 5, 8).
Inadequate support in culturally unsafe workplace settings
The Gari Yala (Speak the Truth): Gendered Insights report (Evans 2021:6) draws attention to the lack of organisational support available to Indigenous women who are already working in culturally unsafe workplaces. The report notes that unfair treatment and harassment based on race are experienced by both women and men. However, women are significantly less likely to be able to access adequate support to assist them in navigating these negative experiences.
High rates of gendered violence
Aboriginal and/or Torres Strait Islander women experience high rates of violence and sexual harassment both within and outside the workplace. These forms of violence stem from a complex array of drivers including gender inequality and the ongoing impacts of colonialism and racism (Our Watch, 2018). In the workplace context, the Australian Human Rights Council found that 59% of First Nations women and 53% of First Nations men reported being sexually harassed at work in the last 5 years (2022:53).
More broadly, Indigenous women experience violence at 3.1 times the rate of non-Indigenous women, and they are 11 times more likely to die from assault (Our Watch 2018:6). This violence is often misunderstood as an ‘Indigenous’ problem, however, men from all cultural backgrounds commit violence against Aboriginal and/or Torres Strait Islander women (Our Watch 2018:5). While the disproportionate levels of violence against First Nations women are a significant concern in and of themselves, they are also a workplace issue. It is well documented that forms of violence such as family violence have significant impacts on access to paid employment, career development and lifetime earnings (Weatherall and Gavin 2021; Wibberley et al. 2018).
Extensive caring responsibilities
Workplace support available to carers is often gendered, with research demonstrating that women with caring responsibilities are more often seen as a liability, whereas men with caring responsibilities can be seen as a strength (Weeden et al. 2016). This lack of support is compounded for Indigenous women, with the Gari Yala (Speak the Truth): Gendered Insights report (2021:9) pointing to Indigenous mothers and carers as a particularly marginalised group. First Nations women are more likely to care for children, family, and community members than First Nations men and non-Indigenous people, having one of the highest levels of caring responsibilities in Australia (Evans 2021:9). Research shows that this cohort of women are more likely to work in culturally unsafe workplaces and receive low levels of organisational support when they experience racism (Evans 2021:9). It is possible that Indigenous women carers prioritise income stability above seeking out culturally safe workplaces, however further research is required to better understand the discrimination experienced by this group (Evans 2021:9).
Commissioned research
In 2022-23, the Commission engaged Associate Professor Debbie Bargallie, Professor Bronwyn Carlson and Madi Day to examine the experiences of First Nations women working in the Victorian public sector. Participation in Bargallie et al.’s research project was open to any First Nations women working in the Victorian public sector. However, the researchers only received responses from Aboriginal women. As such, the Commission uses the term ‘Aboriginal women’ when directly reporting on this project.
The researchers undertook 25 online and face-to-face Yarning sessions with Aboriginal women employed in Victorian public sector organisations. They also conducted an online survey, with a total of 10 respondents. The research team used Indigenous research approaches to investigate how Aboriginal women experienced working in the Victorian public sector. Further details of the research method can be found at the research project Make us Count: Understanding Aboriginal women's experiences in Victorian public sector workplaces.
Key findings
Barriers to recruitment
Participants identified significant recruitment and promotion barriers for Aboriginal women in the Victorian public sector. These included inflexible recruitment processes, low pay offerings and a focus on recruitment of Aboriginal peoples into junior roles. Some participants raised geographical limitations, noting that most job opportunities were concentrated in Melbourne, or large regional centres, and that there was a lack of flexibility offered to support Aboriginal people to continue to live regionally or rurally. Participants also raised challenges related to power in hiring decisions, with dominant Aboriginal families often represented on recruitment panels, causing potential conflicts of interest. Some felt that these barriers to entry showed that government commitments to hiring more Aboriginal peoples were not genuine.
Barriers to career progression
A variety of barriers to career progression were identified. Participants noted that senior level management positions went mostly to Aboriginal men, and that Aboriginal women were less able to progress beyond entry or lower-level positions, despite being qualified. Some participants felt that they were being held back because they performed well at their job and contributed to workplace diversity, so their employer didn’t want to lose them. Some said that hiring Aboriginal people felt tokenistic. This was compounded by a lack of visible Aboriginal women in leadership positions.
Precarious employment and unpaid labour
Aboriginal women reported challenges in securing consistent employment, leading to feelings of stress, frustration, and depression. The issue of unpaid labour emerged prominently, with expectations to engage in tasks beyond their designated roles, particularly related to Aboriginal matters. Some believed their long-term work prospects could be adversely affected if they didn't comply.
Racisms at work
Participants reported experiencing racism related to the ways things are set up (structural level), in the policies and rules (systemic level), and in how people treat them (interpersonal level). Racism was reported to show up in daily interactions with non-Indigenous people that are harmful (racial microaggressions), such as comments about Aboriginal culture, stereotyping, or not respecting ideas from Aboriginal peoples. Participants often felt that their non-Indigenous colleagues held racist expectations about how Aboriginal peoples should look or behave. These expectations manifested in negative behaviours towards Aboriginal peoples, making it difficult for participants to comfortably be themselves at work. Participants also reported experiencing discrimination from other Aboriginal peoples in the workplace, because of internalised racism.
The failure of complaint policies, processes, and practices
A common theme among participants was a lack of justice in their experiences of reporting workplace discrimination and sexual harassment. Some participants explained that they chose not to make a complaint, due to a lack of trust in reporting processes. Others did make a formal complaint but found that they did not receive appropriate support. Some participants reported that they had been pressured to stay quiet by managers or forced to quit their jobs because of bullying or harassment incidents.
Experiences of abuse and harassment were reportedly compounded by poor organisational processes and responses. These included a lack of support from leaders, an unwillingness to intervene in conflict between multiple Aboriginal peoples, inappropriate responses from managers or People and Culture departments, poor reporting processes and a focus on individual behaviour rather than on workplace policies, processes and practices. In all, participants felt that these compounding challenges made them the problem, rather than the incident they were reporting, causing them to be re-victimised in the process of attempting to address harm.
CGEPS audit data: Key insights
This section reports on insights from the Commission’s 2021 workplace gender audit workforce data and the 2021 People matter survey (PMS). Workforce data is data drawn from organisations’ human resources and payroll systems. The People matter survey is an anonymous survey completed by approximately 90% of organisations with reporting obligations under the Act.
First Nations employees in the 2021 workplace gender audit
For the 2021 workforce data, only a small number of organisations were able to provide reliable data regarding the First Nations status of their employees.
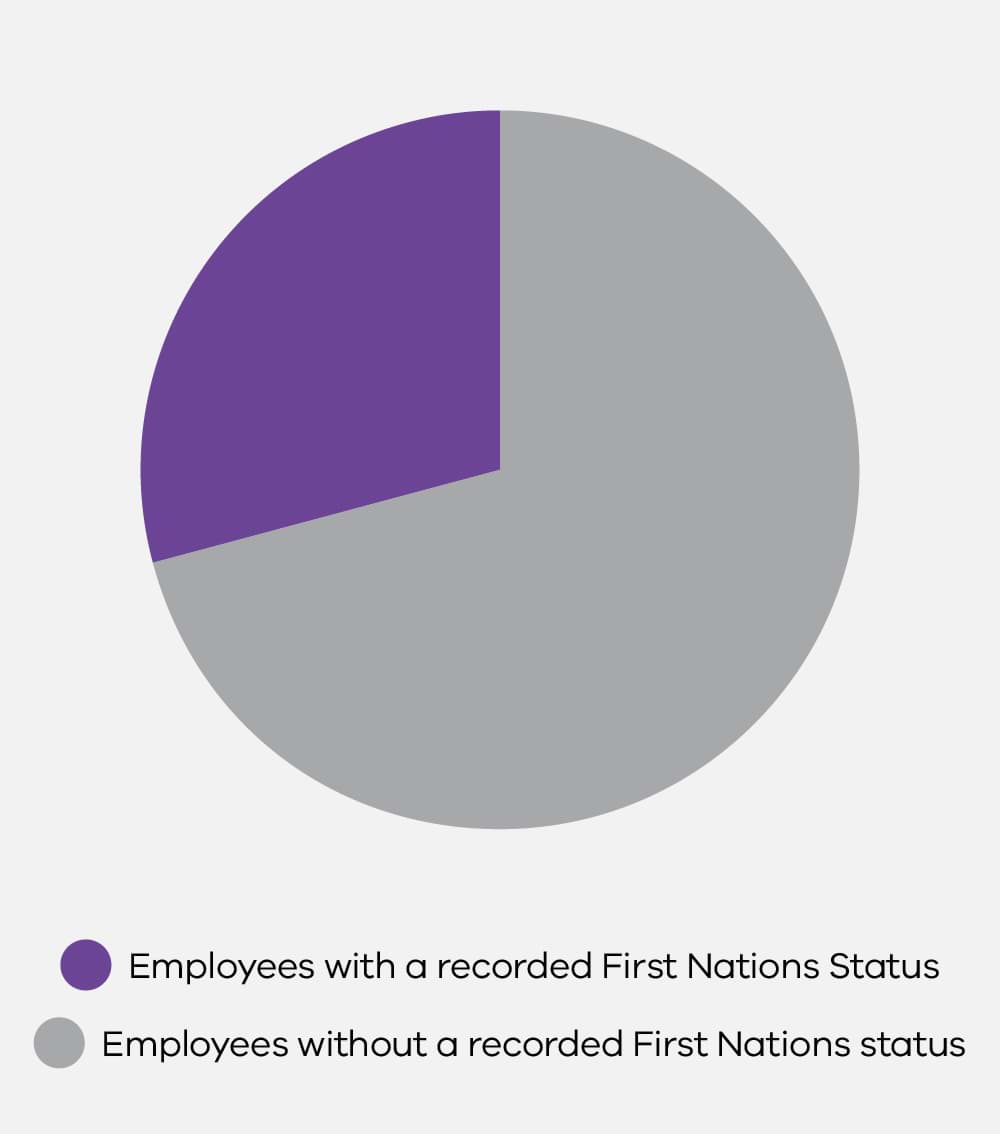
Figure 1.1 illustrates that across all organisations with reporting obligations in the 2021 workplace gender audit, 71% of employees did not have a recorded First Nations status. This means that more than 7 in 10 employees covered by the 2021 workforce data either had no First Nations status recorded or worked for organisations that did not collect and store information about First Nations status through their workforce systems at all.
Such a low reporting rate makes it very difficult to draw conclusions from this workforce data and impacts the generalisability of the findings across the sector. As a result, the remainder of the data presented in this section is derived from the 2021 People matter survey.
Figure 1.1. Availability of First Nations status information in the workforce data, workplace gender audit 2021

People matter survey respondents who identified as First Nations peoples made up 1% of the total workforce.
This broadly aligns with the 1% of the Victorian population who identified as First Nations people in the 2021 Census (ABS 2022a). Approximately 0.97% of women and 1.3% of men responding to the survey were First Nations peoples.
Gender composition at all levels of the workforce
First Nations women had the lowest representation in manager positions.
As Table 1.1 demonstrates, First Nations women were less likely to report holding positions as senior managers (overseeing lower-level managers) or supervisors (managing employees who are not managers themselves) than Indigenous men and non-Indigenous men and women. Non-Indigenous men reported the highest rates of supervisor and senior manager roles of any cohort.
Indigenous status and gender | PMS Respondents reporting senior manager roles | PMS Respondents reporting supervisor roles |
| Indigenous women | 6% | 11% |
| Non-Indigenous women | 7% | 15% |
| Indigenous men | 9% | 17% |
| Non-Indigenous men | 13% | 20% |
Source: 2021 workplace gender audit data (People matter survey data) Notes: Total sample of 106,069 respondents.
First Nations women were slightly less likely to work part time than non-Indigenous women.
As set out in Table 1.2 below, First Nations women were slightly less likely than non-Indigenous women to report working part time. However, both Indigenous and non-Indigenous women were nearly four-times as likely to work part time than their male counterparts.
Indigenous status and gender | PMS Respondents reporting part-time work |
| Indigenous women | 39% |
| Non-Indigenous women | 44% |
| Indigenous men | 10% |
| Non-Indigenous men | 12% |
Source: 2021 workplace gender audit data (People matter survey data) Notes: Total sample of 106,069 respondents.
It is not known whether the lower rates of part-time work for both First Nations women and men compared to their non-Indigenous counterparts is related to lower access to part-time work. However, the larger rates of part-time work for both groups of women, and the smaller rates for both groups of men, suggest that part-time work continues to be closely associated with gendered norms related to both paid and unpaid labour.
Gender pay equity
First Nations women were overrepresented in lower income brackets and underrepresented in higher income brackets.
Almost 60% of First Nations women reported earning under $95,000 as their full-time base salary, compared to only 38% of non-Indigenous men. Respondents to the People matter survey 2021, from which this data is drawn, were able to select their yearly income from salary brackets increasing in $10,000 increments. These ranged from ‘Less than $45,000’, followed by ‘$45,000-$54,999’, through to ‘$175,000-$184,999’ and finally ‘$185,000 or more’. Respondents were also given the option to select ‘Prefer not to say’. Table 1.3 shows these salary options rolled up into $30,000 groupings.
The average annual full-time salary in Australia, based on the ABS full-time weekly earnings in November 2021, was approximately $91,000 (ABS 2022b). While the options provided to respondents in the People matter survey do not allow analysis of salaries above or below $91,000 specifically, Table 1.3 shows that First Nations women were more likely than men (Indigenous and non-Indigenous) and non-Indigenous women to report a full-time equivalent salary of less than $95,000.
Salary Range | Indigenous women | Non-Indigenous women | Indigenous men | Non-Indigenous men |
| Less than $65,000 | 30% | 22% | 18% | 10% |
| $65,00 – 94,999 | 29% | 32% | 35% | 28% |
| $95,000 –$124,000 | 21% | 22% | 23% | 28% |
| $125,000 –$154,999 | 3% | 5% | 7% | 11% |
| $155,000 –$184,999 | 1% | 2% | 1% | 5% |
| Over $185,000 | 1% | 2% | 2% | 5% |
| Prefer not to say | 9% | 10% | 9% | 9% |
| Unanswered | 5% | 5% | 4% | 4% |
Source: 2021 workplace gender audit data (People matter survey data) Notes: Total sample of 106,069 respondents.
Income disparity at the upper end of the pay scale shows the compounding impact of inequality on the basis of Indigenous status and gender. Non-Indigenous men were more than 4 times as likely to report higher incomes than First Nations women (over $125,000), with First Nations men and non-Indigenous women approximately twice as likely to report salaries in these brackets.
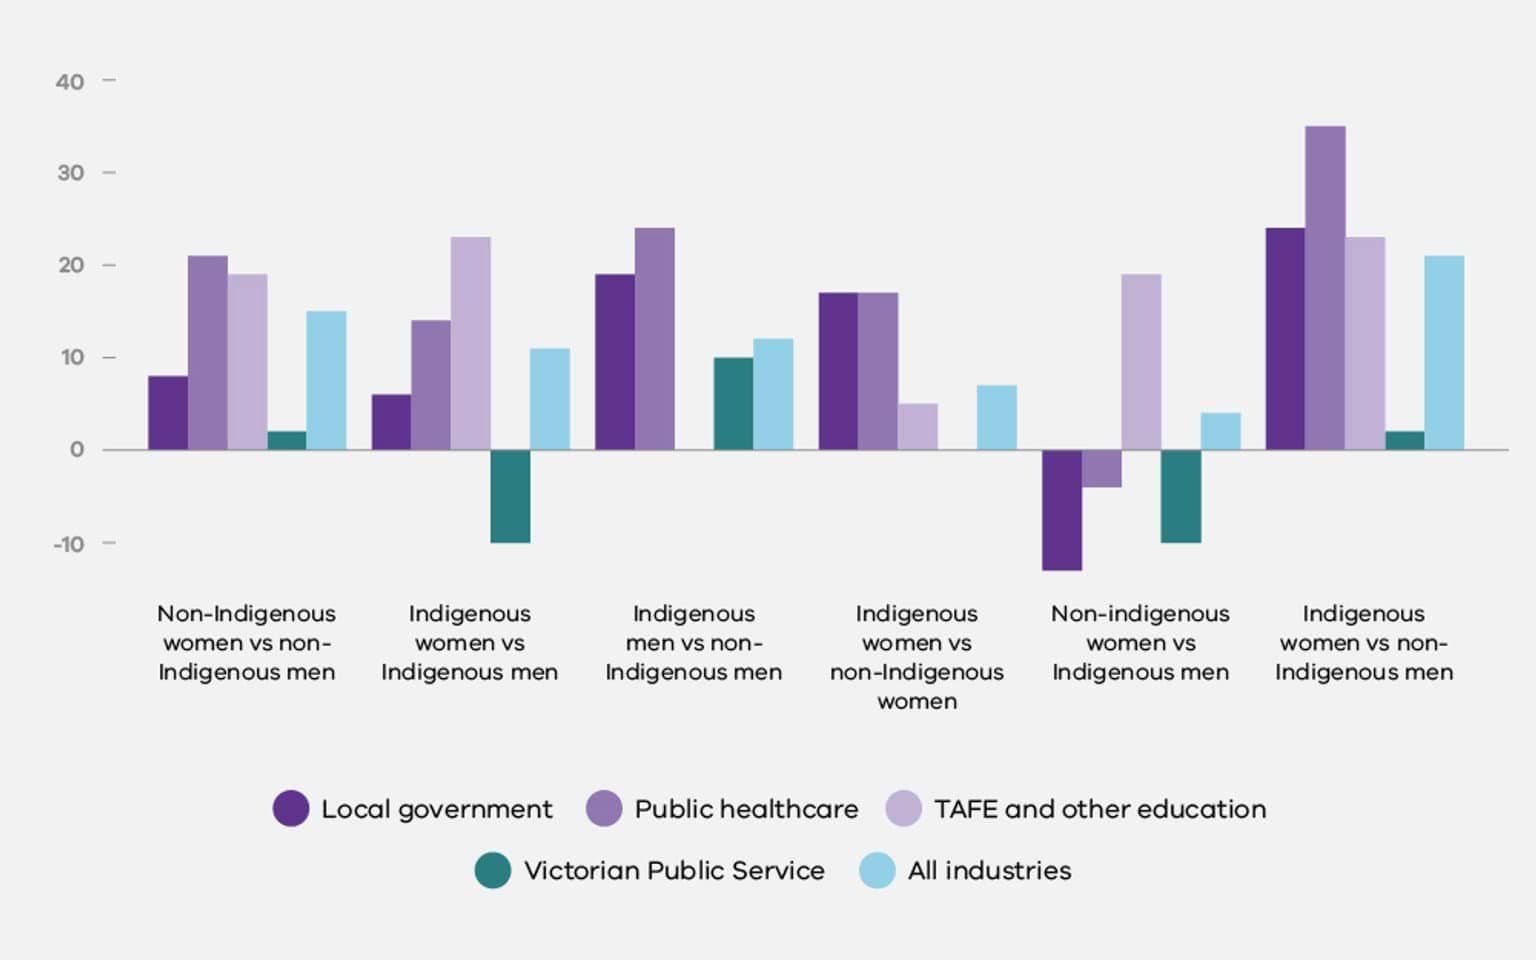
Estimated industry pay gaps were generally largest between First Nations women and non-Indigenous men.
As set out in Table 1.4, across 3 of the 4 industry groups with sufficient data and at the all-industries level, estimated pay gaps were largest between First Nations women and non-Indigenous men. At the all-industries level, the pay gap between these two groups was 21%.
In the Public healthcare industry, the pay gap between First Nations women and non-Indigenous men was the greatest at 35%. The Victorian Public Service industry bucked this trend, with the smallest gap between these groups, at 2%. Notably, First Nations men experienced a significantly larger pay gap than First Nations women when compared to non-Indigenous men in this industry group, and the pay gap between Indigenous women and men was 10% in favour of women.
| Industry | Local government | Public healthcare | TAFE and other education | Victorian Public Service | All industries |
| Non-Indigenous women vs non-Indigenous men | 8% | 21% | 19% | 2% | 15% |
| Indigenous women vs Indigenous men | 6% | 14% | 23% | -10% | 11% |
| Indigenous men vs non-Indigenous men | 19% | 24% | 0% | 10% | 12% |
| Indigenous women vs non-Indigenous women | 17% | 17% | 5% | 0% | 7% |
| Non-indigenous women vs Indigenous men | -13% | -4% | 19% | -10% | 4% |
| Indigenous women vs non-Indigenous men | 24% | 35% | 23% | 2% | 21% |
Source: 2021 workplace gender audit data (People matter survey data) Notes: Total sample of 106,069 respondents.
The pay gaps presented here are estimates, produced using a combination of salary bracket data from the People matter survey, outlined above, and the Commission’s workforce remuneration data. This is because the workforce data is not comprehensive enough to produce reliable pay gap calculations based on actual salaries. Please see the Introduction to this report for further detail on the approach taken.
Figure 1.2. Estimated pay gaps by comparator groups and industry.
Workplace sexual harassment and discrimination
First Nations women reported experiencing sexual harassment at similar rates to non-Indigenous women.
As Table 1.5 shows, 6.5% of both Indigenous and non-Indigenous women reported having experienced sexual harassment at work in the previous 12 months. First Nations men were more likely than their non-Indigenous counterparts to report having experienced sexual harassment.
Indigenous status and gender | PMS Respondents reporting sexual harassment |
| Indigenous women | 6.5% |
| Non-Indigenous women | 6.5% |
| Indigenous men | 5.4% |
| Non-Indigenous men | 3.5% |
Source: 2021 workplace gender audit data (People matter survey data) Notes: Total sample of 106,069 respondents.
Both Indigenous and non-Indigenous women were more likely to report experiences of sexual harassment than men, while Indigenous men were more likely than non-Indigenous men to report experiences of sexual harassment.
The two most common types of sexual harassment reported, regardless of gender or Indigenous status, were ‘Intrusive questions about my private life or comments about my physical appearance’ and ‘Sexually suggestive comments or jokes that made me feel offended’.
Please note that the People matter survey 2021 was conducted during the COVID-19 pandemic. This was when many people were working from home (except for essential workers, such as healthcare workers). This means that there might have been a potential decrease in certain types of sexual harassment between workers. However, it remains unclear how much the COVID-19 pandemic impacted these numbers.
First Nations people reported experiencing discrimination at higher rates than their non-Indigenous colleagues.
Regardless of gender, First Nations peoples were approximately twice as likely to say they had experienced discrimination in the preceding 12 months as non-Indigenous respondents. Table 1.6 shows these differences in experiences of discrimination.
Indigenous status and gender | PMS Respondents reporting discrimination |
| Indigenous women | 10% |
| Non-Indigenous women | 5% |
| Indigenous men | 11% |
| Non-Indigenous men | 5% |
Source: 2021 workplace gender audit data (People matter survey data) Notes: Total sample of 106,069 respondents.
The most common type of discrimination reported by First Nations men was being denied opportunities for training and professional development. The most common type of discrimination reported by all three other groups in the table above was being denied opportunities for promotion.
However, First Nations women were more likely than any of the other three groups to select ‘Other’ as the reason for the discrimination, indicating that their experience of discrimination was not listed in the available options. As there was no free text option associated with this question, the type of discrimination the women experienced is unknown. Further research is required to understand First Nations women’s experiences of discrimination in public sector organisations.
Recruitment and promotion practices
First Nations peoples and non-Indigenous women and men were roughly equally likely to agree that recruitment and promotion decisions in their organisations were fair.
As Table 1.7 shows, both First Nations and non-Indigenous people, regardless of gender, were about as likely to agree with the statement ‘My organisation makes fair recruitment and promotion decisions, based on merit’. First Nations women had the highest level of agreement, at 56%.
Indigenous status and gender | My organisation makes fair recruitment and promotion decisions, based on merit | |
Strongly agree or agree | Strongly disagree or disagree | |
| Indigenous women | 56% | 19% |
| Non-Indigenous women | 55% | 17% |
| Indigenous men | 53% | 23% |
| Non-Indigenous men | 53% | 22% |
Source: 2021 workplace gender audit data (People matter survey data) Notes: Total sample of 106,069 respondents. ‘Neither agree nor disagree’ and ‘Don’t know’ response options are not included in the table.
‘Neither agree nor disagree’ and ‘Don’t know’ response options are not included in the table.
Women and men, regardless of whether they were First Nations Peoples or not, reported feeling they had an equal chance at promotion similar levels.
As Table 1.8 shows, there were only small variations in levels of agreement or disagreement with the statement ‘I feel I have an equal chance at promotion in my organisation’ across the four groups. First Nations men had the highest level of agreement, at 49%.
Indigenous status and gender | I feel I have an equal chance at promotion in my organisation | |
Strongly agree or agree | Strongly disagree or disagree | |
| Indigenous women | 47% | 25% |
| Non-Indigenous women | 46% | 25% |
| Indigenous men | 49% | 26% |
| Non-Indigenous men | 46% | 27% |
Source: 2021 workplace gender audit data (People matter survey data) Notes: Total sample of 106,069 respondents. ‘Neither agree nor disagree’ and ‘Don’t know’ response options are not included in the table.
‘Neither agree nor disagree’ and ‘Don’t know’ response options are not included in the table.
Flexible work practices
Women reported higher levels of working flexibly, regardless of whether they were Aboriginal or Torres Strait Islander peoples or non-Indigenous people.
Both First Nations women and non-Indigenous women were equally likely to report using flexible work arrangements at 31%. Indigenous and non-Indigenous men also reported working flexibly in similar proportions at 22% and 21% respectively. Table 1.9 shows the proportion of respondents in each group who reported using flexible work.
Indigenous status and gender | PMS Respondents reporting flexible work |
| Indigenous women | 31% |
| Non-Indigenous women | 31% |
| Indigenous men | 21% |
| Non-Indigenous men | 22% |
Source: 2021 workplace gender audit data (People matter survey data) Notes: Total sample of 106,069 respondents.
Women, regardless of Indigenous status, as well as First Nations men, most often reported using flexible start and finish times. Non-Indigenous men most often reported working part time.
Discussion and conclusions
This chapter aligns with previous research that shows First Nations women face significant barriers to equal participation and outcomes in the workplace. Data from the 2021 workplace gender audit illustrates that First Nations women in Victorian public sector organisations report low rates of occupation of management roles and often much lower salaries than both Indigenous men and non-Indigenous people. In industries with sufficient data, estimated pay gaps showed up to a 35% difference in reported gross salary between Indigenous women and non-Indigenous men.
While reported rates of the experience of sexual harassment and discrimination in the People matter survey 2021 are similar for First Nations women and non-Indigenous women, First Nations men reported experiencing sexual harassment at a higher rate than their non-Indigenous counterparts. As the People matter survey data from 2021 was collected during a period of significant lockdowns in Victoria, it is unclear how working from home conditions may have impacted experiences of sexual harassment.
The Commission’s funded research project found that sexual harassment is a notable concern for First Nations women in the Victorian public sector and indicated that fear of backlash and a lack of faith in systems to address the issue contribute to a lack of formal complaint-making (Bargallie et al. 2023). Fear of lateral violence and abuse, as well as not wanting to detract attention away from other pressing issues for First Nations peoples, provide additional explanations for why Aboriginal and/or Torres Strait Islander women might self-censor when reporting their gendered workplace experiences (see Davis 2009).
Crucially, there is a need for identification of the First Nations status of employees in public sector workplaces in Victoria. This data is required to better understand how disadvantage and discrimination on the basis of First Nations status and gender compound to exacerbate experiences of inequality for First Nations women. Better workforce data will help us to calculate pay gaps more accurately, more reliably track harassment and discrimination, explore access to training and other professional development and promotional opportunities, investigate occupational and industrial segregation, as well as to understand the nuances of survey responses. Improved quantitative data, supported by qualitative data from people with lived experience, can help us better address these experiences of inequality.
Despite the data limitations, this chapter reinforces the value of identifying and naming forms of inequality. For First Nations women in the Victorian public sector, Bargallie and colleagues’ research (2023) demonstrates the importance of naming and acknowledging challenges such as the unpaid labour they are expected to do to support reconciliation and education about First Nations peoples in the workplace. The research also points to the need to prioritise the recruitment and retention of First Nations women in the Victorian public sector, including through creating better access to employment outside of metropolitan centres (Bargallie et al. 2023). Access to stable employment is key to ensure First Nations women can grow their careers within the public sector, while effective responses to discrimination and complaints processes are vital to ensure they can safely remain within organisations (Bargallie et al. 2023).
This chapter has focussed on the intersection of discrimination against First Nations peoples and women in the workplace. There is a notable lack of data and information in relation to First Nations peoples of self-described gender. Bargallie and her colleagues’ research emphasised the challenges experienced by LGBTIQ+ Indigenous peoples (2023). These findings demonstrate the urgent need for further research and data collection about this group.
Chapter 2: Gender and Employees of Different Ages
This chapter looks at intersectional data and insights in relation to gender and age.
Ageism is a set of beliefs (stereotypes), emotions (prejudice) and actions (discrimination) directed towards people on the basis of age (AHRC 2021b). While it is usually targeted by one age group against another, ageism can also be directed towards people in the same age group (Blackham 2022; AHRC 2021b). Ageism is also sometimes internally focused or self-directed, affecting how we perceive our own abilities in relation to prejudicial attitudes (Hausknecht et al. 2020).
Ageism does not receive as much attention as other forms of discrimination, such as sexism or racism (AHRC 2021). The former Australian Federal Age Discrimination Commissioner Dr Kay Patterson described ageism as “…the least-challenged and understood form of discrimination” (Patterson 28 July 2023) and the World Health Organisation (2021) noted that it is still largely socially accepted. Despite the existence of national and state-based legislation which makes ageism unlawful, it is prevalent across Australian society (O’Loughlin et al. 2017) with negative impacts on inclusion and wellbeing (AHRC 2021b). A recent study into ageist attitudes by the Australian Human Rights Commission (AHRC) found 90% of participants believed ageism exists, and 63% reported they had experienced ageism in the last 5 years (AHRC 2021b).
Ageism affects Australians throughout adult life. The AHRC (2021b) categorises Australians into 3 adult life stages, each with their own commonly applied stereotypes:
- Older adults (62+ age range): Perceived as likeable, warm, more loyal, reliable, and aware, and as mere spectators of life experiencing declining skills and life roles rather than as active participants in the workplace and in wider society.
- Middle aged (40-61 age range): Viewed as being in the prime of their career but stressed due to the competing demands of raising dependents and managing workplace responsibilities.
- Young adults (18-39 age range): Seen as attractive, inexperienced, irresponsible, self-centred, prone to taking risks, and having greater career ambitions and technological and physical capabilities.
Literature on ageism often focusses on understanding impacts on older adults. However, the AHRC also found that ageism can have significant negative impacts on young adults, with further research required to better understand these (AHRC 2021).
Research and evidence suggest that ageism can impact people differently across these broad age categories, and that these experiences are shaped by gender inequality. This chapter highlights the ways that biases and discrimination on the basis of age and gender intersect, creating negative outcomes for women in the workplace across the course of their lives. As research on the ‘double jeopardy’ of ageism and gender highlights, women are never perceived to be the ‘right’ age, and their workplace experiences are always marked by this form of compounded discrimination (Harnois 2015; Blackham 2023).
There is very little data and research in relation to gender-diverse Australians in the workplace across different life stages. The Commission expects that the Gender Equality Act 2020 (Vic) (the Act) will drive improved data collection and quality in Victoria to reflect the gender diversity that exists in our society and make gender-diverse cohorts visible. In this chapter, the Commission acknowledges this lack of data on trans and gender-diverse people has meant that issues are generally only able to be analysed and discussed for women and men.
Key workplace issues related to ageism
Although Australians are typically spending a larger portion of their lives in the labour market, age discrimination remains a significant barrier to equal participation. Young adults and older Australians are often considered “too old” or “too young” for relevant positions (O’Loughlin 2017, p. 98). In 2015, the Australian Human Rights Commission conducted a survey that revealed age discrimination was frequently experienced by older individuals seeking paid work. Nearly 58% of job-seekers aged over 50 reported discrimination based on age (AHRC 2015:9), and 27% of those aged over 50 who were currently employed reported experiencing age discrimination in the workplace in the past two years (AHRC 2015:9).
Employers’ perceptions of older workers reinforce these experiences. The same study revealed that negative attitudes toward older workers' ability to learn and upskill were a prevalent form of age-based discrimination, with 44% of managers aged 50 years or older reporting that they factor in a person’s age when making hiring decisions (AHRC 2015:9). A 2023 survey of human resources professionals found that while almost two thirds (65 per cent) of respondents said they were currently finding it difficult to recruit people into roles, only 56 per cent said that they were open to recruiting people aged between 50 and 64, and only 25 per cent were open to hiring those aged 65 and over (Australian HR Institute and AHRC 2023:11). Such ageist attitudes underpin the finding that older unemployed individuals take twice as long as younger unemployed individuals to secure employment, and some may never find work again (Patterson 2021).
Despite the significant impacts ageism has on the experiences of older Australians at work, Australians are remaining in the workforce for longer. This is due to many factors, including increasing life expectancies and costs of living (ABS 2022c; AIHW 2023b). A higher proportion of Australians now report that they expect to retire between 66 and 70 years of age (39.6% in 2021, up from 37.4% in 2018 and 31.9% 2014) (AHRC 2021a:11). Furthermore, the proportion of workers aged 55+ has more than doubled from 9% in 1991 to 19% in 2021. Unfortunately, barriers related to ageism mean many older people may spend decades of their lives without paid employment (AHRC 2015), exacerbating issues related to financial insecurity and social isolation.
Younger workers face different challenges. Labour laws often fail to protect younger workers or can even discriminate against them. This includes through unpaid internships and work placements (Blackham et al. 2022), junior rates based on age rather than skill level or work performed (YWC 2022), and employers only paying superannuation contributions to workers under 18 if they work more than 30 hours per week (YWC 2022).
Younger workers also face high levels of exploitation. Issues such as wage theft and insecure employment are prevalent. These can be exacerbated by the high uptake of casual work among younger workers, which also results in a lack of leave entitlements (YWC 2020). Some managers take advantage of young workers' lack of experience in occupational health and safety, forcing them to work in hazardous conditions to cut costs. In a recent survey, one in four young workers had been asked to perform unsafe tasks, and 55.6% of those complied (YWC 2017:12). Additionally, half of the young workers surveyed reported experiencing bullying or harassment at work. These abuses are compounded for international students, as their visa status and lack of knowledge about workplace rights make them vulnerable to exploitation and coercion (YWC 2020).
Key workplace issues related to ageism and gender
When ageism combines with sexism, it can exacerbate inequalities for women in the workforce. Women are more likely than men to receive negative and unequal treatment based on age (Blackham 2022; Handy and Davy 2007), with research long demonstrating that this can occur at various stages across a woman’s life (Duncan and Loretto 2004).
Sexist attitudes can combine with ageism to produce or increase specific forms of discrimination at different points in women’s lives. This ‘gendered ageism’ works to undermine women's leadership, reinforce rigid gender roles, limit women's personal autonomy, and normalise discrimination against them (Blackham 2022; Handy and Davy 2007).
Younger women
Younger workers – regardless of gender – can face particular forms of exploitation and discrimination, as well as biases and negative attitudes. For young women, these challenges can be compounded by gender-based discrimination. Barriers to workplace equality or forms of negative treatment that young women are more likely to experience include (Duncan and Loretto 2004; YWC 2020):
- Lower access to paid employment
- Larger early career wage gaps
- Discriminatory attitudes and assumptions about capability
- Bias in recruitment
- A lack of access to progression and promotion opportunities
- Appearance-based discrimination or harassment
- Increased risk of sexual harassment by bosses, managers, colleagues, and customers.
Australian and international evidence also shows that, as a result of the COVID-19 pandemic, young women experienced greater job losses, mental ill-health, and increased care responsibilities that impacted access to paid employment (ILO 2021; Loxton et al. 2021).
Older women
Ageism affects older women differently to older men. According to the Australian Human Rights Commission, older women (51%) are more likely than older men (38%) to be perceived by their peers as having outdated skills, being slow to learn new things, or doing an unsatisfactory job (AHRC 2015). Older women are more likely to be discriminated against based on their appearance as they grow older, which can negatively impact their sense of self-worth (AHRC 2016; Handy and Davy 2007; McGann et al. 2016). Their workforce participation can also be affected by a lack of workforce accommodations related to menopause. Workers’ menopause symptoms can be exacerbated by restricted access to toilets, inability to control ventilation and air conditioning, restrictive workwear, and uncomfortable workstations (Circle In 2021). A 2021 survey found that 83% of women who experienced menopause reported that it negatively affected their work life, with one in two women considering retirement or extended leave as a result (Circle In 2021:4)
Middle-aged women
Women in their middle years can begin to experience the compounding impacts of lifetime gender inequality, and face challenges related to an increased care burden when compared to men. Women tend to have more caring responsibilities across all stages of life, with 72% of primary carers in Australia being women (ABS 2019). Caring responsibilities can impact women’s workforce participation as they may need greater access to leave, part-time employment or flexible working opportunities to be able to provide care (Dangar et al. 2023). In their middle years, this care burden can increase, with young children and older parents often requiring care at the same time (Vlachantoni et al. 2020). Care is more commonly performed by historically marginalised communities, such as First Nations peoples, people of colour, queer-identifying, religious minorities, youth, and those with disabilities (Dangar et al., 2023). This means that mid-life caring challenges may be further compounded for those experiencing intersecting forms of disadvantage.
Ageism related to parenting
Although unlawful, mothers are especially disadvantaged by workplace discrimination. Biases related to motherhood are often extended to people who are perceived as women and of child-bearing age (Peterson Gloor et al. 2021; Thomas 2020). As such, these attitudes often disproportionately affect women, or people perceived as women, in their mid-20s to late-30s. Women without children are more likely to experience expectations about parenthood than those who are already parents (Peterson Gloor et al. 2021). Discrimination against people in this demographic often arises from managers’ uncertainty about future childbearing intentions. Pregnancy and caring are viewed as future organisational risks where leave or other workplace rights may result in productivity losses or increased costs (Peterson Gloor et al. 2021).
The Australian Human Rights Commission asserts that these systemic issues of employers discriminating against women for pregnancy-related reasons are widespread throughout Australia. These biases and prejudice towards potential or actual caring responsibilities create barriers which can prevent women from fully participating in Australian workforces (AHRC n.d.).
Commissioned research
In 2022-23, the Commission engaged Associate Professor Alysia Blackham, Professor Leah Ruppanner, Professor Beth Gaze, Professor Susan Ainsworth, Dr Brendan Churchill, Kate Dangar, Mira Gunawansa, Lía Acosta Rueda, and Cameron Patrick to examine the impact of pregnancy, parenting and caregiving on workplace gender equality in the Victorian public sector. While the research project did not explicitly examine the experience of people of different ages, this chapter highlights the links between age-based gender inequalities and gendered caring expectations. For this reason, the Commission has included a summary of this research project here.
The researchers undertook 74 interviews with Victorian public sector workers in relation to work and care responsibilities. Of the 74 public sector workers interviewed, 86.5% were women, 10.8% were men, 1.4% were non-binary, and 1.4% preferred not to disclose their gender.
They also conducted an online survey, with a total of 349 respondents who worked in VPS departments, agencies and organisations across metro, regional and rural Victoria. Of these, 88.2% of respondents were women, 9.8% were men, 0.8% were non-binary or gender-diverse, and 0.8% preferred not to disclose their gender.
Further details of the research method can be found in the research project Caring and Workplace Gender Equality in the Public Sector in Victoria.
Key findings
Flexible work arrangements
More women and non-binary people reported being caregivers, and invested much more time in caregiving activities, compared to men. Encouragingly, participants identified workplace flexibility as a notable strength of the Victorian public sector. The research also found that how leave entitlements and flexible work arrangements were accessed depended highly on individual managers. Most respondents in the research reported not being informed of their rights as caregivers in the workplace. Additionally, a significant portion of respondents found that the amount of leave entitlements wasn’t enough and challenging to access.
The COVID-19 pandemic prompted discussions around allowing caregivers to work flexibly as the norm. Nevertheless, respondents said there was a push to return to pre-pandemic norms in the workplace. This created uncertainty among caregivers, who feared that the level of flexibility they had may not be sustained in the future.
Career progression opportunities
Caregivers participating in the research, particularly working mothers and mature-aged women (50+ years) were notably less likely to report being offered opportunities for career progression. Most respondents believed that having caregiving responsibilities can be a barrier to career success in the Victorian public sector. This contrasted with the results of the People matter survey (PMS), where 59% of women and 62% of men agreed or strongly agreed that caregiving responsibilities did not impede career success. Furthermore, only 40% of non-binary respondents to the People matter survey agreed that caregiving responsibilities were not a barrier to career success. The researchers note that these findings highlight that it is important to consider gender differences beyond the binary in experiences of caregiving.
Discrimination against carers
Respondents described how discrimination against caregivers in the workforce endured without being properly addressed. People of diverse backgrounds experienced additional barriers and discrimination in the workplace due to their caregiver status. However, despite higher levels of caregiving among First Nations peoples, people of colour, queer-identifying, religious minorities, people with disabilities and youth, the research team notes that these groups were underrepresented in the study. Further research is required to better understand how these historically marginalised groups experience care at work. The study found that individuals taking leave for traumatic reasons (such as for miscarriage or domestic violence) were less likely to receive sufficient or well-informed support. Finally, caregivers in the study reported that insecure employment further compounded challenges they faced and deterred some from using their leave and flexible work entitlements.
Recognising diverse types of caring
The research team emphasised the importance of recognising that experiences of caregiving can be extremely varied. This includes differences in who a person cares for, as well as how they practice that care and therefore the types of accommodations they may require from their employer. As such, understanding how different organisational policies related to flexible working arrangements and leave entitlements impact employees with different caregiving responsibilities is key to ensuring that carers, primarily women, can participate equally at work. Additionally, participants with non-normative experiences of caregiving – such as caregiving outside of an immediate heterosexual family, men with caring responsibilities, or practices of community care – reported facing a lack of empathy and support at higher rates than those in heterosexual relationships who were caring for their children.
CGEPS audit data: Key insights
This section reports on insights from the Commission’s 2021 workplace gender audit workforce data and the 2021 People matter survey (PMS). Workforce data is data drawn from organisations’ human resources and payroll systems. The People matter survey is an anonymous survey completed by approximately 90% of organisations with reporting obligations under the Act.
In the People matter survey, respondents were able to select one of the following response options to the question ‘What is your age range?’:
- 15-24 years
- 25-34 years
- 35-44 years
- 45-54 years
- 55-64 years
- 65+ years
- Prefer not to say
The majority of the analysis below uses the People matter survey data, and therefore uses these age brackets (or combinations of them) in reporting.
In the companion to this report, the Baseline report, the Commission reported on pay gaps disaggregated by both age and gender. The Commission has not re-created pay analyses again here, but instead has summarised the findings reported in the Baseline.
It is important to note that while age is the largest and most well-reported demographic variable examined in this report (aside from gender), this means that the age categories discussed below mask significant amounts of diversity in Aboriginality, ability, ethnicity, gender identity, race, religion and sexual orientation. Given that the average public sector employee is white, straight, cis-gendered, able-bodied and is not a First Nations person (VPSC 2022a), the average experiences across age demographics here are likely to reflect this dominant group most closely. This is one of the limitations of analysing gender plus one other demographic variable, and the Commission acknowledges that there is more to do to understand experiences across the life-course of people facing intersecting inequalities.
Employees of different age groups in the 2021 workplace gender audit
Organisations participating in the 2021 workplace gender audit supplied comprehensive data about the ages of their employees. Age was the most consistently reported attribute aside from gender. Age-range information was provided for 93% of all employees included in the workforce data reporting (data drawn from organisations’ human resource management systems).
Figure 2.1. Availability of age-range information in the workforce data, workplace gender audit 2021
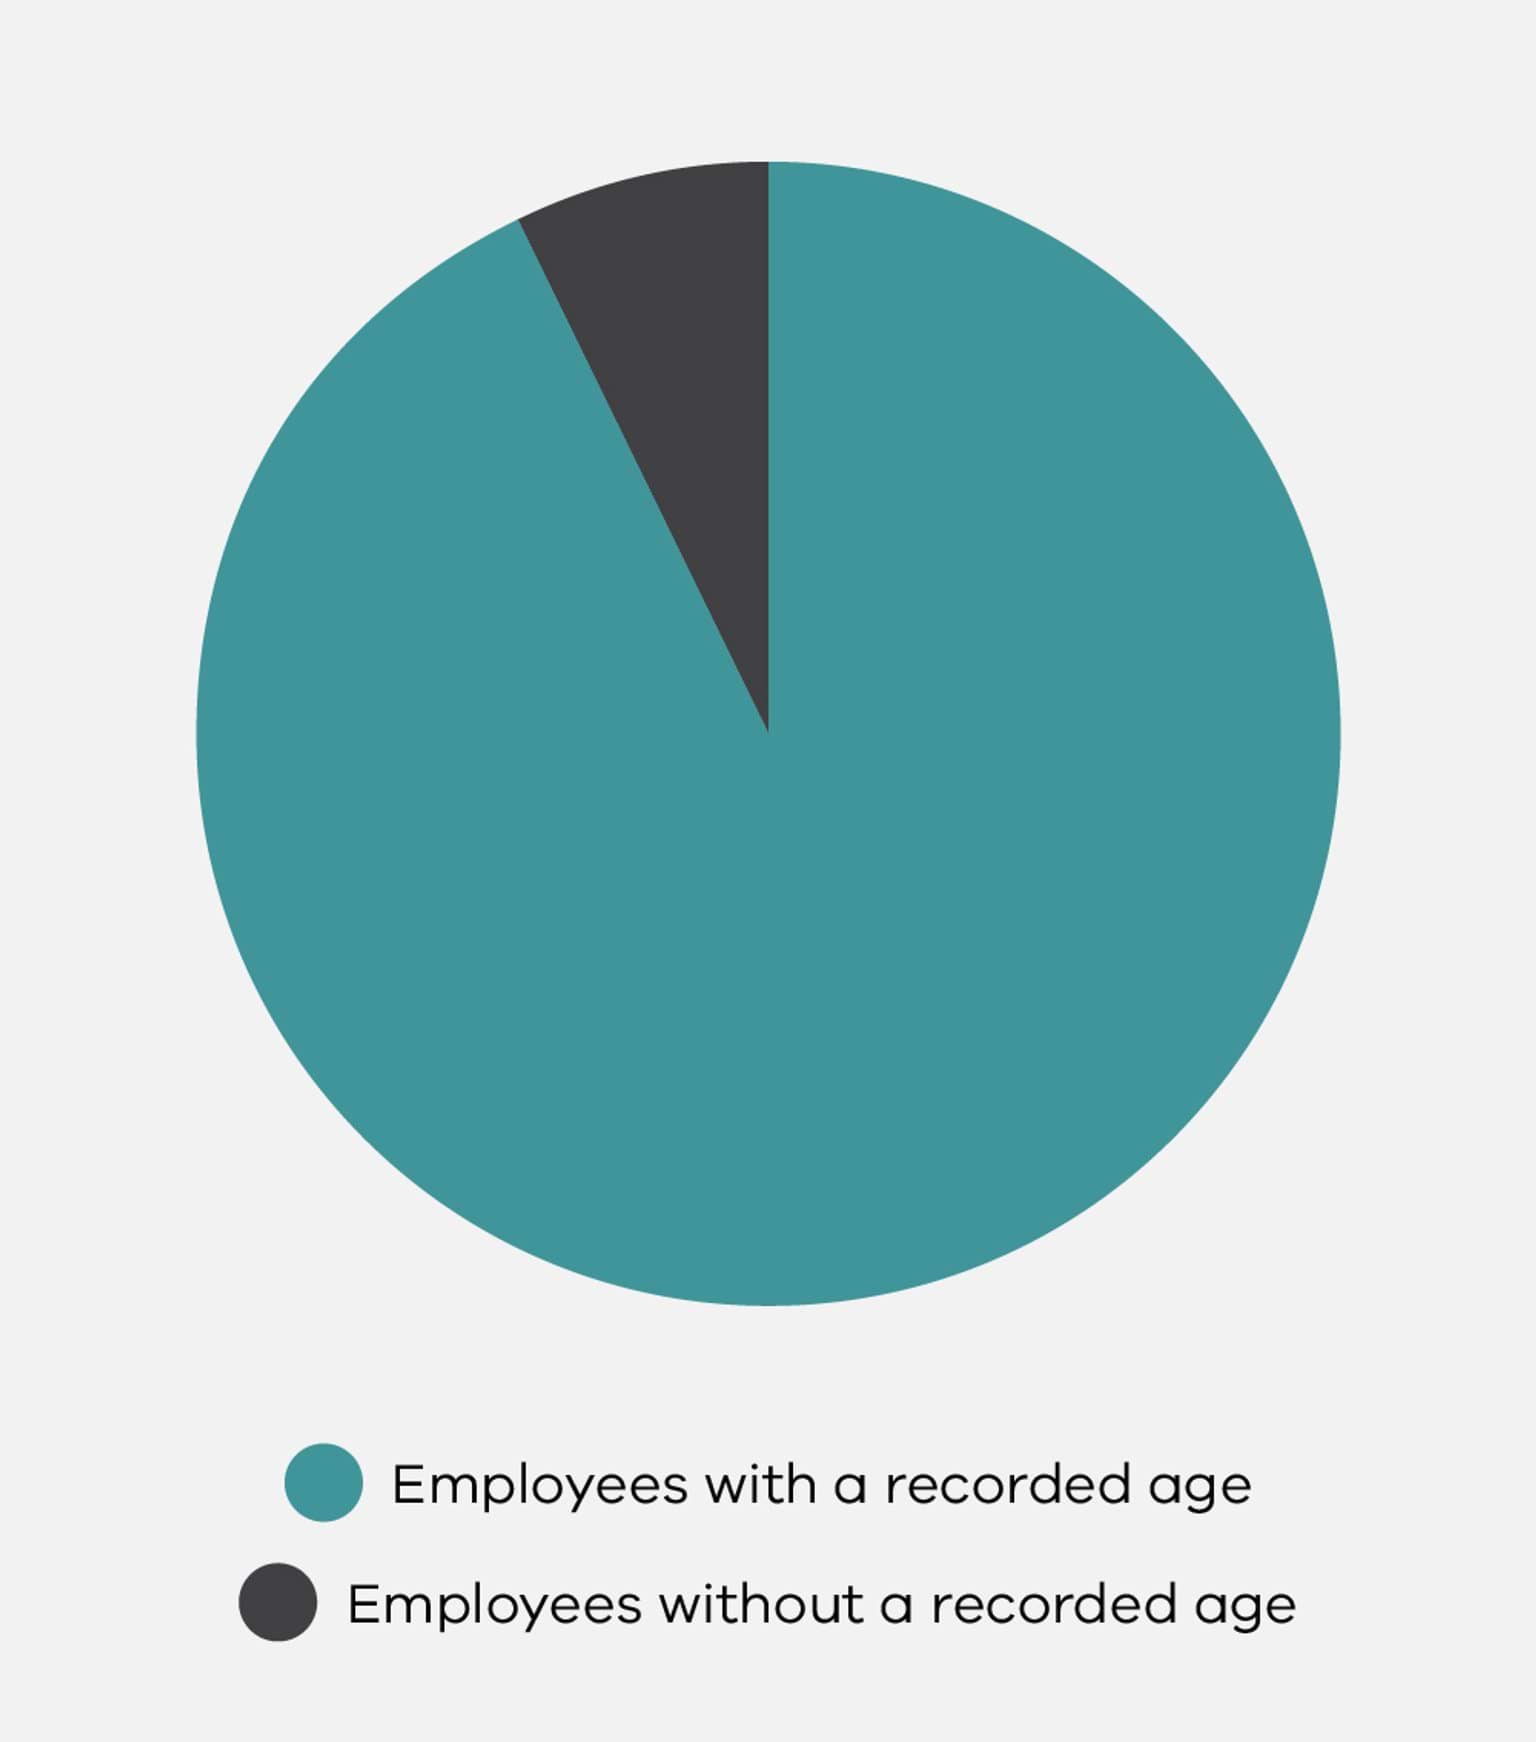
The comprehensive age data supplied by organisations participating in the 2021 workplace gender audit means that it is possible to produce meaningful analysis related to age from the workforce data collected under the Act. However, this chapter focusses primarily on the People matter survey data in order to provide comparable data across all of the chapters in this report.
Gender composition at all levels of the workforce
Women were less likely than men to hold managerial positions across all age groups.
As illustrated in Table 2.1 below, men were more likely to report holding senior manager positions (overseeing lower-level managers) and supervisor roles (managing employees who are not managers themselves) in every age bracket. Women’s representation in senior manager (10%) and supervisor (18%) roles peaked in their middle years (45-54 years). Although men’s representation peaked in the same age range, they reported holding senior manager roles at almost twice the rate of women. At ages 55+ men were more than twice as likely to hold senior management positions.
Gender
| Age group | PMS Respondents reporting senior manager roles | PMS Respondents reporting supervisor roles |
| Woman | 15-24 years | 0% | 1% |
| Man | 15-24 years | 0% | 2% |
| Woman | 25-34 years | 3% | 10% |
| Man | 25-34 years | 4% | 12% |
| Woman | 35-44 years | 8% | 18% |
| Man | 35-44 years | 13% | 22% |
| Woman | 45-54 years | 10% | 18% |
| Man | 45-54 years | 19% | 23% |
| Woman | 55-64 years | 7% | 16% |
| Man | 55-64 years | 15% | 21% |
| Woman | 65+ years | 4% | 12% |
| Man | 65+ years | 9% | 16% |
Source: 2021 workplace gender audit data (People matter survey data) Notes: Total sample of 106,069 respondents.
The gaps between the proportion of women and the proportion of men reporting managerial roles grew in each age bracket after 25-34 years.
Gender pay equity
Gender pay gaps in favour of men increased in all age brackets from 25-34 years until 65+.
The companion to this report that was published by the Commission in 2022, the Baseline report, used workforce data from the 2021 workplace gender audit to calculate pay gaps across each age bracket. These pay gaps were calculated using median base salaries – meaning a person’s salary before any bonuses, superannuation, overtime, salary-packaging or other extra payments are included – as reported from organisations’ payroll systems. This approach is more precise than the estimated pay gaps used in other chapters of this report (see the Introduction for more information on this approach).
The pay gap analysis reported in the Baseline report showed that the gender pay gap favouring men is smallest for employees aged between 25 and 34 years, with women in this age bracket earning a median base salary 3.3% lower than men in the same age group. This gap begins to widen significantly for women in the 35 to 44 years age bracket (7.2%) and continues to widen for women in the next age bracket, 45 to 54 years (10.8%). The gender pay gap increases to its highest point (13.7%) for women aged 55 to 64 years. Women in this age bracket have median base salaries $13,200 lower than their male counterparts. Figure 2.2 is replicated from the Baseline report and illustrates the widening pay gaps between women and men until age 65+.
Figure 2.2. Difference between men's and women's median base salaries by age.
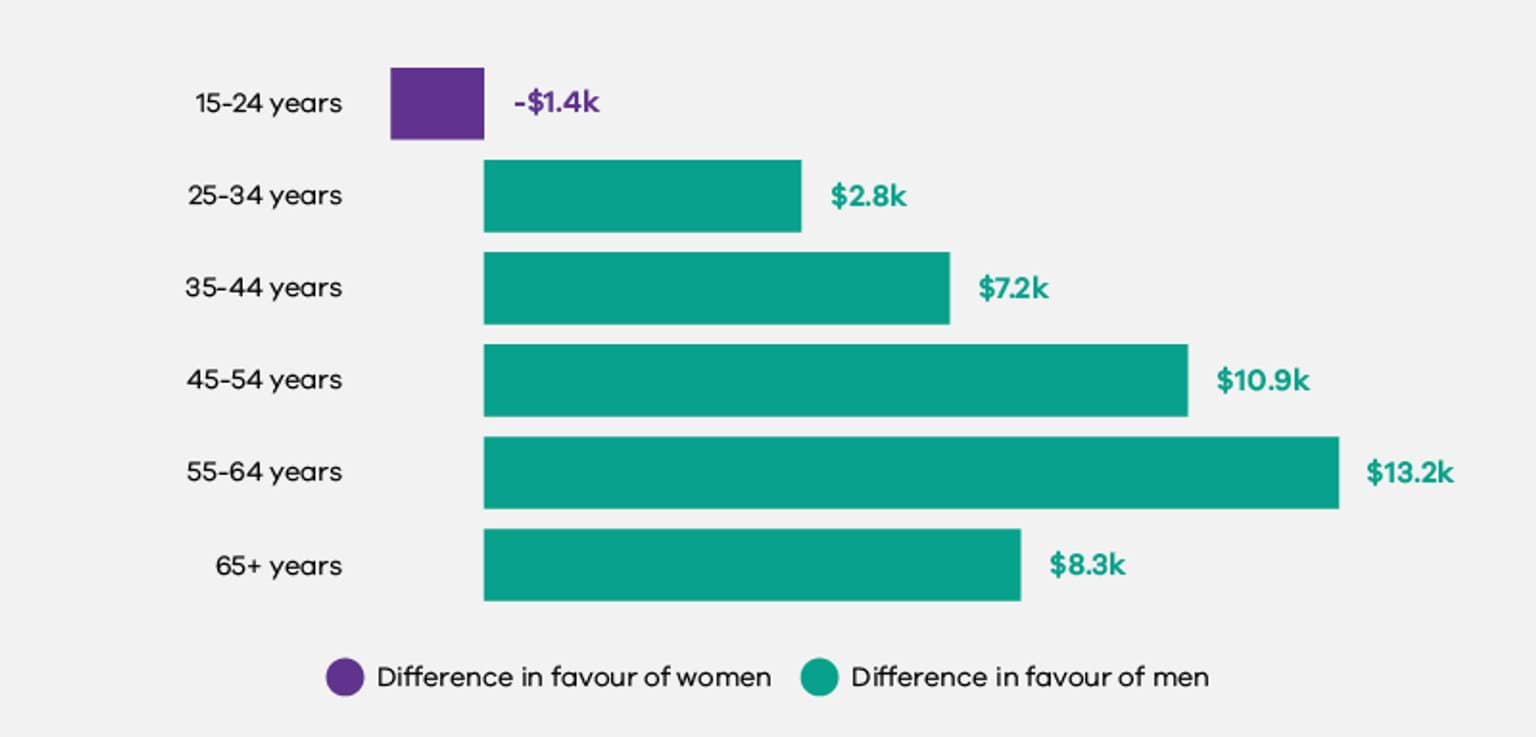
See the Commission’s Baseline report for further information and discussion.
Workplace sexual harassment and discrimination
Younger women reported experiencing sexual harassment at the highest levels compared to any other age group.
Women of all ages reported experiencing sexual harassment at a higher rate than men in the same age bracket, except people aged 55+. Table 2.2 sets out the percentage of respondents to the People matter survey who reported experiencing sexual harassment in the previous 12 months.
| Age | Gender | PMS Respondents reporting sexual harassment |
| 15-24 years | Women | 14% |
| 15-24 years | Men | 4% |
| 25-34 years | Women | 11% |
| 25-34 years | Men | 5% |
| 35-44 years | Women | 6% |
| 35-44 years | Men | 4% |
| 45-54 years | Women | 5% |
| 45-54 years | Men | 3% |
| 55-64 years | Women | 3% |
| 55-64 years | Men | 3% |
| 65+ years | Women | 2% |
| 65+ years | Men | 2% |
Source: 2021 workplace gender audit data (People matter survey data) Notes: Total sample of 106,069 respondents.
Younger women, aged 15-24, reported experiencing the highest levels of sexual harassment of any age group at 14%. This is almost four times the 4% rate reported by men in the same age group. The second highest prevalence of the experience of sexual harassment was for women aged 25-34 years at 11%. This was more than double the rate reported by men in the same age category.
The two most common types of sexual harassment reported, regardless of gender or age, were ‘Intrusive questions about my private life or comments about my physical appearance’ and ‘Sexually suggestive comments or jokes that made me feel offended’.
The People matter survey 2021 was conducted during the COVID-19 pandemic. This was when many people were working from home (except for essential workers, such as healthcare workers). This means that there might have been a potential decrease in certain types of sexual harassment between workers. However, it remains unclear how much the COVID-19 pandemic impacted these numbers.
Regardless of age or gender, respondents reported experiencing discrimination at similar rates.
As shown in Table 2.3, women at each age bracket were similarly likely to report having experienced discrimination in the previous 12 months compared to men. While women reported experiencing discrimination at marginally higher rates in most age brackets, the exceptions to this include at ages 25-34 and 55-64 where the rate was even across the two genders, and 45-54, where men reported 1% higher rates of discrimination.
| Age | Gender | PMS Respondents reporting discrimination |
| 15-24 years | Woman | 4% |
| 15-24 years | Man | 3% |
| 25-34 years | Woman | 5% |
| 25-34 years | Man | 5% |
| 35-44 years | Woman | 6% |
| 35-44 years | Man | 5% |
| 45-54 years | Woman | 5% |
| 45-54 years | Man | 6% |
| 55-64 years | Woman | 5% |
| 55-64 years | Man | 5% |
| 65+ years | Woman | 5% |
| 65+ years | Man | 4% |
Source: 2021 workplace gender audit data (People matter survey data) Notes: Total sample of 106,069 respondents.
Being denied opportunities for promotion was the most common type of discrimination reported among all age groups and genders, aside from 15–24-year-old women. Women in this age group were more likely to report being denied opportunities for training or professional development, while being denied opportunities for promotion was the second most common form of discrimination selected by this cohort.
Recruitment and promotion practices
Younger people were more likely to agree that recruitment and promotion decisions in their organisations were fair.
As Table 2.4 shows, women and men were roughly equally likely to agree with the statement ‘My organisation makes fair recruitment and promotion decisions, based on merit’, however levels of agreement were higher among young people. People aged 15-24 were most likely to agree, at 70% for women and 69% for men. Men aged 45-54 showed the lowest levels of faith in recruitment and promotion decisions, with only 49% agreeing that they were fair and 35% disagreeing.
| Age | Gender | My organisation makes fair recruitment and promotion decisions, based on merit | |
| Strongly agree or agree | Strongly disagree or disagree | ||
| 15-24 years | Women | 70% | 8% |
| 15-24 years | Men | 69% | 11% |
| 25-34 years | Women | 58% | 17% |
| 25-34 years | Men | 56% | 22% |
| 35-44 years | Women | 56% | 18% |
| 35-44 years | Men | 55% | 22% |
| 45-54 years | Women | 53% | 18% |
| 45-54 years | Men | 49% | 25% |
| 55-64 years | Women | 50% | 16% |
| 55-64 years | Men | 50% | 22% |
| 65+ years | Women | 56% | 11% |
| 65+ years | Men | 55% | 13% |
Source: 2021 workplace gender audit data (People matter survey data) Notes: Total sample of 106,069 respondents. ‘Neither agree nor disagree’ and ‘Don’t know’ response options are not included in the table.
‘Neither agree nor disagree’ and ‘Don’t know’ response options are not included in the table.
Older people were less likely to feel they had an equal chance at promotion in their organisations.
As Table 2.5 shows, although men were usually slightly more likely than women in the same age group to agree with the statement ‘I feel I have an equal chance at promotion in my organisation’, these differences were small. Both women and men in older age brackets were less likely to agree that they had equal chance at promotion, with only 40% of women 55+ and 40% of men 55+ agreeing with the statement. By contrast, 53% of women and 60% of men aged 15-24 agreed.
| Age | Gender | I feel I have an equal chance at promotion in my organisation | |
| Strongly agree or agree | Strongly disagree or disagree | ||
| 15-24 years | Women | 53% | 16% |
| 15-24 years | Men | 60% | 14% |
| 25-34 years | Women | 50% | 25% |
| 25-34 years | Men | 53% | 24% |
| 35-44 years | Women | 47% | 26% |
| 35-44 years | Men | 50% | 27% |
| 45-54 years | Women | 45% | 25% |
| 45-54 years | Men | 43% | 30% |
| 55-64 years | Women | 40% | 24% |
| 55-64 years | Men | 42% | 27% |
| 65+ years | Women | 40% | 17% |
| 65+ years | Men | 42% | 18% |
Source: 2021 workplace gender audit data (People matter survey data) Notes: Total sample of 106,069 respondents. ‘Neither agree nor disagree’ and ‘Don’t know’ response options are not included in the table.
‘Neither agree nor disagree’ and ‘Don’t know’ response options are not included in the table.
Flexible work practices
In all age groups, women were less likely to report working flexibly work than men.
As Table 2.6 shows, men were more likely to report flexible work arrangements than women in all age brackets. The largest discrepancy between genders can be seen in the 35-44 years and 45-54 years cohorts, where men reported flexible work arrangements 11 per cent higher than women in both brackets. Employees aged 25-54 were also more likely to report flexible work arrangements than employees in both older and younger age brackets.
| Age | Gender | PMS Respondents reporting flexible work |
| 15-24 years | Women | 19% |
| 15-24 years | Men | 20% |
| 25-34 years | Women | 23% |
| 25-34 years | Men | 30% |
| 35-44 years | Women | 27% |
| 35-44 years | Men | 38% |
| 45-54 years | Women | 22% |
| 45-54 years | Men | 31% |
| 55-64 years | Women | 19% |
| 55-64 years | Men | 25% |
| 65+ years | Women | 17% |
| 65+ years | Men | 22% |
Source: 2021 workplace gender audit data (People matter survey data) Notes: Total sample of 106,069 respondents.
Men selected ‘Flexible start and finish times’ as their most common type of flexible arrangement reported, regardless of age. Younger women (15-24 years) and older women (65+ years) were also most likely to choose this option, whereas women of all other ages (25-64) most often chose ‘Part-time’.
Discussion and conclusion
This chapter highlights the importance of considering the varied experiences and circumstances of women in the workplace at different ages. The 2021 workplace gender audit data analysed above shows that, consistent with previous research, gender is compounded with age in ways that negatively impact women’s safety and wellbeing at work, their career progression and to increase the gender pay gap.
For younger women, significantly higher rates of sexual harassment as compared to men in the same age brackets demonstrates how gender and age combine to increase the risk of harassment for younger women in the Victorian public sector. Fourteen per cent of women aged 15-24 reported the experience of sexual harassment and 11% of women aged 25-34 also did so. This compares to 4% and 5% respectively of men in the same age groups. The experience of sexual harassment for women in older age groups declined from 6% at age 35-44 years to 2% at 65+ years. For men, the experience declined from 4% at age 35-44 years to 2% at 65+ years. While the elimination of experiences of sexual harassment for everyone is very important, addressing this is a particularly urgent concern for women aged 15-34.
The Commission’s data also illustrates widening gaps between women and men over the life course in the areas of leadership and pay. A higher percentage of men report being in senior management and supervisory roles after 25 years of age, and this gap increases until age 55+. Evidence shows that gender- and age-based expectations contribute to the lack of women’s representation in leadership roles, with rigid and outdated expectations regarding women as primary carers for children and other family members restricting their career progression (Jones 2019; KPMG 2021).
Gender disparity in leadership opportunities is a contributing factor to the growing gender pay gap observed in older age brackets. Consistent with previous research (e.g. KPMG 2022), the Commission’s findings reveal the largest median base salary gender pay gap of any age group (13.2%, favouring men) occurs in the 55-64 age bracket. The gender pay gap favouring men increases in every age bracket from 25-34 to 55-64, before tapering off for employees 65 and over. The ramifications of these barriers faced by women in the progression of their careers, and in turn, their income, restrict their financial security and independence throughout their adult lives. They also contribute to the superannuation gender gap at retirement age. Australian women aged 60-64 have an average of 28% less super than men of the same age (KPMG 2021:14).
Overall, the compounding of age and gender inequality creates a range of challenges for women in the Victorian public sector, from pay and employment to caregiving responsibilities and ageism. Addressing these barriers will require a multifaceted approach that recognises the unique experiences and needs of women across their lifespan. Better childcare support, better workplace flexibility for all types of caring responsibilities, better designed jobs and valuing work-life balance, supporting workers through technological change through training and professional development, proactive workplace strategies to support workers with chronic health conditions to access paid employment, and addressing bias and discrimination in the workplace are all areas that require attention to ensure women can participate can access equal opportunities and outcomes throughout their lives (Chomik and Khan 2021; COTA 2022; Dangar et al. 2023; WGEA 2022).
Chapter 3: Gender and Employees with Disabilities
This chapter looks at intersectional data and insights in relation to gender and disability
Disability theory today remains closely linked to activism and advocacy. As such, preferred terminology and language used to describe persons with disability varies across cultures and is often dependant on the particular social movement context from which it emerged. For example, in some contexts, identity-first language (disabled person) is preferred as it recognises disability as a way of experiencing the world that has social value and is a source of pride (AFDO n.d.). By contrast, person-first language (person with disabilities) reduces the focus on impairment and centres personhood to counteract the history of dehumanisation experienced by people with disabilities (AFDO n.d.). In this report, the Commission follows the advice of People with Disability Australia (2021) (the national disability rights and advocacy organisation) and uses the term ‘people with disabilities’ or ‘people with disability’ to reflect the preferred terminology in an Australian context.
In 2018, there were 4.4 million Australians living with disability, which equates to 17.7% of the total population (ABS 2019). Available data points to consistently low rates of workforce participation for people with disability. Just over half of working-age people with disability are currently in the workforce (53%), compared with 84% of people without disability (AIHW 2022a:311). Despite disability civil rights movements and protective legislative frameworks, significant barriers to workforce participation persist and people with disability remain underemployed in Australia. When people with disabilities do find employment, it is often characterised by low pay, insufficient hours, and segregated workplaces (Henriques-Gomes 2022; Meltzer et al. 2020)
People with disability face high levels of workplace discrimination and stigma from both their employer and their colleagues (ABS 2019). Discrimination also varies according to disability type. For example, people with sensory or speech difficulty have the highest employment rate in Australia (50%), while people with psychosocial disability, including nervous or emotional conditions, mental illness, and/or behavioural problems, are least likely to be employed (26%) (AIHW 2022a:321). The compounding of gender-based and disability-based discrimination also results in labour market outcomes that are significantly lower for women with disability than men with disability. Women with disability are also one of the poorest groups overall in Australian society (WWDA 2020).
Understandings of disability in Australia have evolved to increasingly centre the voices of people with disability and highlight social barriers to equality. Recent research and advocacy efforts led by people with disability adopt a human rights approach. This approach to disability highlights the importance of upholding the rights of people with disabilities to ensure they have the means of support to fully participate and be fully included in all aspects of life and society and to live a flourishing and dignified life (DARU 2019). It also emphasises that it is society and ableist assumptions that create barriers for people with a disability (DARU 2019)
There is very little workforce data and research in relation to gender-diverse Australians with disability. The Commission expects that the Gender Equality Act 2020 (Vic) (the Act) will drive improved data collection and quality in Victoria to reflect the gender diversity that exists in our society and make gender-diverse cohorts visible. In this chapter, the Commission acknowledges this lack of data on trans and gender-diverse people has meant that issues are generally only able to be analysed and discussed for women and men.
Key workplace issues for people with disabilities
Under international law, Australia has an obligation to ensure people with disabilities can rightfully, comfortably and freely work. Despite this, Australians with disabilities face intersecting and systemic barriers to employment (WWDA 2020; AHRC 2016). This reduces their opportunities for economic participation and consequently reduces professional growth, earning capacity, job security and overall wealth compared to people without disabilities (AHRC 2016).
Employment issues faced by people with disabilities are varied, but include:
- Challenges looking for, finding and keeping a job (Devine et al. 2021; Meltzer et al., 2020; Stafford et al. 2017)
- Discrimination due to barriers in the work environment such as accessibility and inflexible hours and settings (Darcy et al. 2016; Devine et al. 2021; O’Meara 2023)
- Poor experiences in other areas of life that impact employment (Devine et al. 2020; Disability Royal Commission 2020)
- Lower pay – sometimes less than minimum wage (Disability Royal Commission 2020; Donelly et al. 2020)
- Low levels of job preparedness (Haber et al. 2016; Stafford et al. 2017)
- Stigma and discrimination by managers and/or co-workers (Meltzer et al. 2020; Murfitt et al. 2018)
- Entrenched, long-term unemployment (Devine et al. 2020; Moore 2021).
Addressing structural barriers and the systemic discrimination against people with disability poses unique challenges for governments, policymakers and activists worldwide (Beaupert et al. 2017). In Australia, employers are obligated to provide ‘reasonable adjustments or accommodations’ for employees with disabilities, and failure to do so can amount to discrimination (AHRC 2016). Experiences of, and barriers to, employment and job retention vary significantly depending on the type of disability a person has. The Disability Discrimination Act 1992 contains 6 categories of disability types including learning, intellectual, physical, psychiatric, sensory, or neurological disability. However, the sheer variety of associated experiences highlight the limitations of workplace ‘one-size-fits-all’ disability policy. Instead, focusing on what the person needs to comfortably do their job as well as providing personalised reasonable adjustments increases inclusivity with benefits to the person, the organisation and society (Raymond et al. 2019).
Direct and indirect discrimination
A 2022 report from the Australian Institute of Health and Welfare found that 1 in 6 Australians with disability reported experiencing disability discrimination over a 12-month period (AIHW 2022a:11). Such discrimination can be ‘direct’ or ‘indirect’.
- Direct discrimination is when someone is treated less favourably because of their protected attribute, such as not hiring someone because of their disability.
- Indirect discrimination is when a condition or requirement has the effect of discriminating against someone because of their protected attribute, such as requiring all workers to attend a presentation but not providing Auslan interpreting or closed captions for Deaf or hard of hearing employees.
Both types of discrimination are unlawful under the Discrimination Act 2006 (Cth).
The Australian Human Rights Commission (AHRC) (2022) reported that in 2021-22 disability discrimination was the most common ground for complaint. Of complaints in the area of employment, 22% were related to disability.
Physical or mental disability is a protected attribute under the Fair Work Act 2009. See https://www.fairwork.gov.au/employment-conditions/protections-at-work/protection-from-discrimination-at-work for further detail.
Key workplace issues for women with disabilities
Low labour force participation
In 2018, labour force participation was higher among men with disability than women with disability (ABS 2019). Specifically:
- 56.1% of men with disability compared with 50.7% of women with disability participated in the labour force
- 31.0% of men with a profound or severe limitation compared with 23.6% of women with a profound or severe limitation participated in the labour force (ABS 2019).
Gender-neutral workplace needs assessments
Across legislative, policy, and service contexts, people living with disability in Australia are often treated as if they have no sex or gender (Frohmader 2014; O’Shea and Frawley 2019; WWDA 2020). Yet women with disability have different life experiences compared to men with disability, largely due to systemic inequality between men and women (WWDA 2020).
Gender neutral analyses of the needs of people with disability in the workforce can therefore perpetuate existing gender-based discrimination. Gender neutral approaches can also produce inaccurate framings of the problems faced by women and girls with disability, resulting in policies that fail to account for their specific needs and experiences (WWDA 2020).
Higher rates of gendered violence, sexual harassment and sexual assault
Research has found that women with disability experience higher rates of gendered violence both within and outside of the workplace. For example:
- Women with disability are more likely to experience family violence and sexual assault (Victorian Government 2016)
- 62% of women with disability under 50 have experienced violence since the age of 15 (Dowse et al., 2016)
- Women with disabilities experience 3 times the rate of sexual violence as women without disabilities (Dowse et.al. 2016)
- People with disability are more likely than those without disability to have been sexually harassed in the workplace in the last 5 years (48% and 32% respectively) (AHRC 2022c:53)
- Women with disability are more likely than men with disability to have been sexually harassed in the workplace in the last 5 years (54% and 38% respectively) (AHRC 2022c53).
Despite the concerning picture painted by the statistics above and research that describes violence against women and girls with disabilities in Australia as endemic, the problem is also largely invisible (Dowse et al. 2016). Due to poor data collection practices at a government level, as well as documented ‘cover up’ practices at an institutional level, violence against women and girls with disability is chronically underreported (Dowse et al. 2016; WWDA 2020).
While the high rate of violence against women with disability is a significant human rights issue, it is also a workplace issue. Research shows that violence against women, including women with disabilities, has significant impacts on access to paid employment, career development and lifetime earnings (Frohmader et al. 2015; Healy et al. 2008; Weatherall and Gavin 2021; Wibberley et al. 2018).
Lack of workplace flexibility
Women with disability face compounded discrimination in the workplace due to a lack of flexible work options. Caring is a traditionally gendered phenomenon, and women with disabilities undertake particularly high levels of caring (Dangar et al. 2023). Adding to the need to access flexibility to support gendered caring responsibilities, women with disability also face disability-specific challenges. These may include health needs and transportation barriers, which can make it difficult for people with disability to work a standard full-time work week. Research has shown that the majority of people who are unemployed, retired, are carers, have a disability, or have a long-term illness, would be inclined to start working if suitable flexible work were available (Victorian Government 2016). This demonstrates the serious barrier that rigid and inflexible work creates for people with disability, and women with disability in particular.
Challenges in accessing support
Gendered norms and assumptions around the division of domestic labour and caring responsibilities mean that women with disabilities are often more time-poor than men with disabilities. Women with disabilities also frequently carry a greater administrative load than men with disabilities (Yates et al. 2022). For example, women are often expected to manage the disabilities of their male partners and children, with 35% of primary carers who are women also having a disability themselves (Yates et al. 2022:4).
In addition, men are more likely to be diagnosed with disabilities that are easier to access funding for. While men and women are diagnosed with disability at similar rates, women are underdiagnosed with some conditions, such as autism spectrum disorders (Yates et al. 2021). They are also more likely to be diagnosed with conditions like arthritis, fibromyalgia, and chronic fatigue syndrome, which are painful and socially disabling, but are difficult to get government support for (Yates et al. 2021).
Commissioned research
In 2022-23, the Commission engaged Dr Jannine Williams, Ms Maria Khan and Professor Robyn Mayes to examine the experiences of people that identify as women with disability in the Victorian Public Service (VPS). Williams and her colleagues (2023), in collaboration with the VPS Enablers Network and the Disability Leadership Institute, undertook 49 qualitative interviews with women with disability employed in the VPS. They also analysed quantitative data extracts from the People matter survey (PMS) 2021 (106,069 people were included in this survey).
The research looked at what helped women with disability (enablers) and what made it hard for them (barriers) to move up in their careers. Aiming to advise VPS employers on how they can best support women with disability to achieve their career goals, the research centres the voices of women with disability and utilises a collaborative co-design approach to project design and analysis. Further details of the research method and co-design approach can be found in the research project Getting on at work: Progression and promotion of women with disability in the Victorian public service.
Key findings
Sharing information about disability and requesting reasonable adjustments
Sharing disability information and requesting reasonable adjustments can bring advantages and challenges. Participants reported that sharing disability information can result in getting reasonable workplace adjustments, feeling more confident at work, and can help co-workers to better understand disability inclusion. Obtaining workplace adjustments is important for career progression, as it enables a person to demonstrate their capabilities and talent.
However, some women reported challenges. These included feeling uncomfortable with telling others about their disability, for fear of stigma and discrimination, or finding the lack of process for requesting reasonable adjustments demoralising and frustrating. Participants also identified burdensome approval processes and policies as a deterrent.
The challenges of self-advocacy
Self-advocacy was viewed as both a pathway to inclusion and a burden. Participants noted that self-advocacy was particularly challenging when their needs were not being met and it became a necessity. Some participants noted that the burden of advocacy is even heavier for women who also have caregiving duties. Other research has also highlighted how disability self-advocacy is a highly gendered process (Yates et al. 2021). Often, women who stand up for themselves, including women with disabilities, are perceived more negatively than women who advocate for others (Wade 2001). This demonstrates how gendered norms can harm both the career progression and well-being of women with disabilities in the workplace.
The importance of managers and teams
Participants identified supportive teams and managers as crucial for psychological well-being and enabling them to fully engage at work. However, they can also reduce career mobility. Some participants feared that the support they currently receive is unique and would be difficult to find elsewhere. Experiencing or even hearing about unsafe environments can create fear about the unpredictability of new team dynamics for women with disabilities. Some participants faced challenges with hostile managers or psychologically unsafe teams, limiting their advancement and success. In particular, participants reported that conscious and unconscious bias from managers or colleagues often led to them being overlooked for advancement.
Visibility and mentorship
Having visible leaders with disability is important for inspiring women with disability in their careers and signalling inclusive organisational values. However, participants reported a lack of people with acknowledged and/or visible disabilities in leadership roles across the VPS. Potential reasons suggested for this included the rigid and ableist expectations of senior roles and potential repercussions for senior leaders who are open about their disability status. Participants also reported that colleagues without disability are more readily assumed to be able to grow and develop in a leadership role, while they needed to demonstrate higher levels of competence to be considered in the first place.
Formal and informal mentors were identified as important to help build confidence, provide advice, and illuminate paths to progression. Barriers reported by participants to accessing mentorship included difficulties in balancing a mentoring relationship with their daily workload, lack of information on how to participate in mentoring relationships, and a scarcity of mentors with knowledge of intersecting forms of inequality.
Systemic change is vital
Policies and practices in the VPS were seen to be improving. Participants highlighted how policies such as remote and flexible working practices, disability-identified roles in recruitment, and opportunities to submit expressions of interest for secondments and ‘acting up’ duties can support inclusion. Universal flexible work arrangements, like remote work, were seen as especially important for supporting health needs and caregiving responsibilities, promoting self-confidence, enabling work-life balance, and helping women with disability to navigate commuting challenges. However, access to these policies was heavily reliant on individual managers. Inconsistent policy application was a significant cause of stress and created burdens on individual women to negotiate with their managers.
CGEPS audit data: Key insights
This section reports on insights from the Commission’s 2021 workplace gender audit workforce data and the 2021 People matter survey (PMS). Workforce data is data drawn from organisations’ human resources and payroll systems. The People matter survey is an anonymous survey completed by approximately 90% of organisations with reporting obligations under the Act.
Employees with disability in the 2021 workplace gender audit
For the 2021 workforce data, only a small proportion of organisations were able to provide reliable data regarding the disability status of their employees.
Only 28% of defined entities included any data related to disability status in their workforce reporting, and this data was not always comprehensive for all employees. Figure 3.1 illustrates that across all organisations with reporting obligations in the 2021 workplace gender audit, only 6% of employees had a recorded disability status. The remaining 94% of employees covered by the 2021 workforce data either had no disability status recorded, or worked for organisations that did not collect and store information about disability status through their workforce systems at all. Among those employees who did have a disability status recorded, only 1% (500 employees) identified as a person with disability.
Such a low reporting rate makes it very difficult to draw conclusions from this workforce data and impacts the generalisability of the findings across the sector. As a result, the remainder of the data presented in this section is derived from the 2021 People matter survey.
Figure 3.1. Availability of disability status information in the workforce data, workplace gender audit 2021
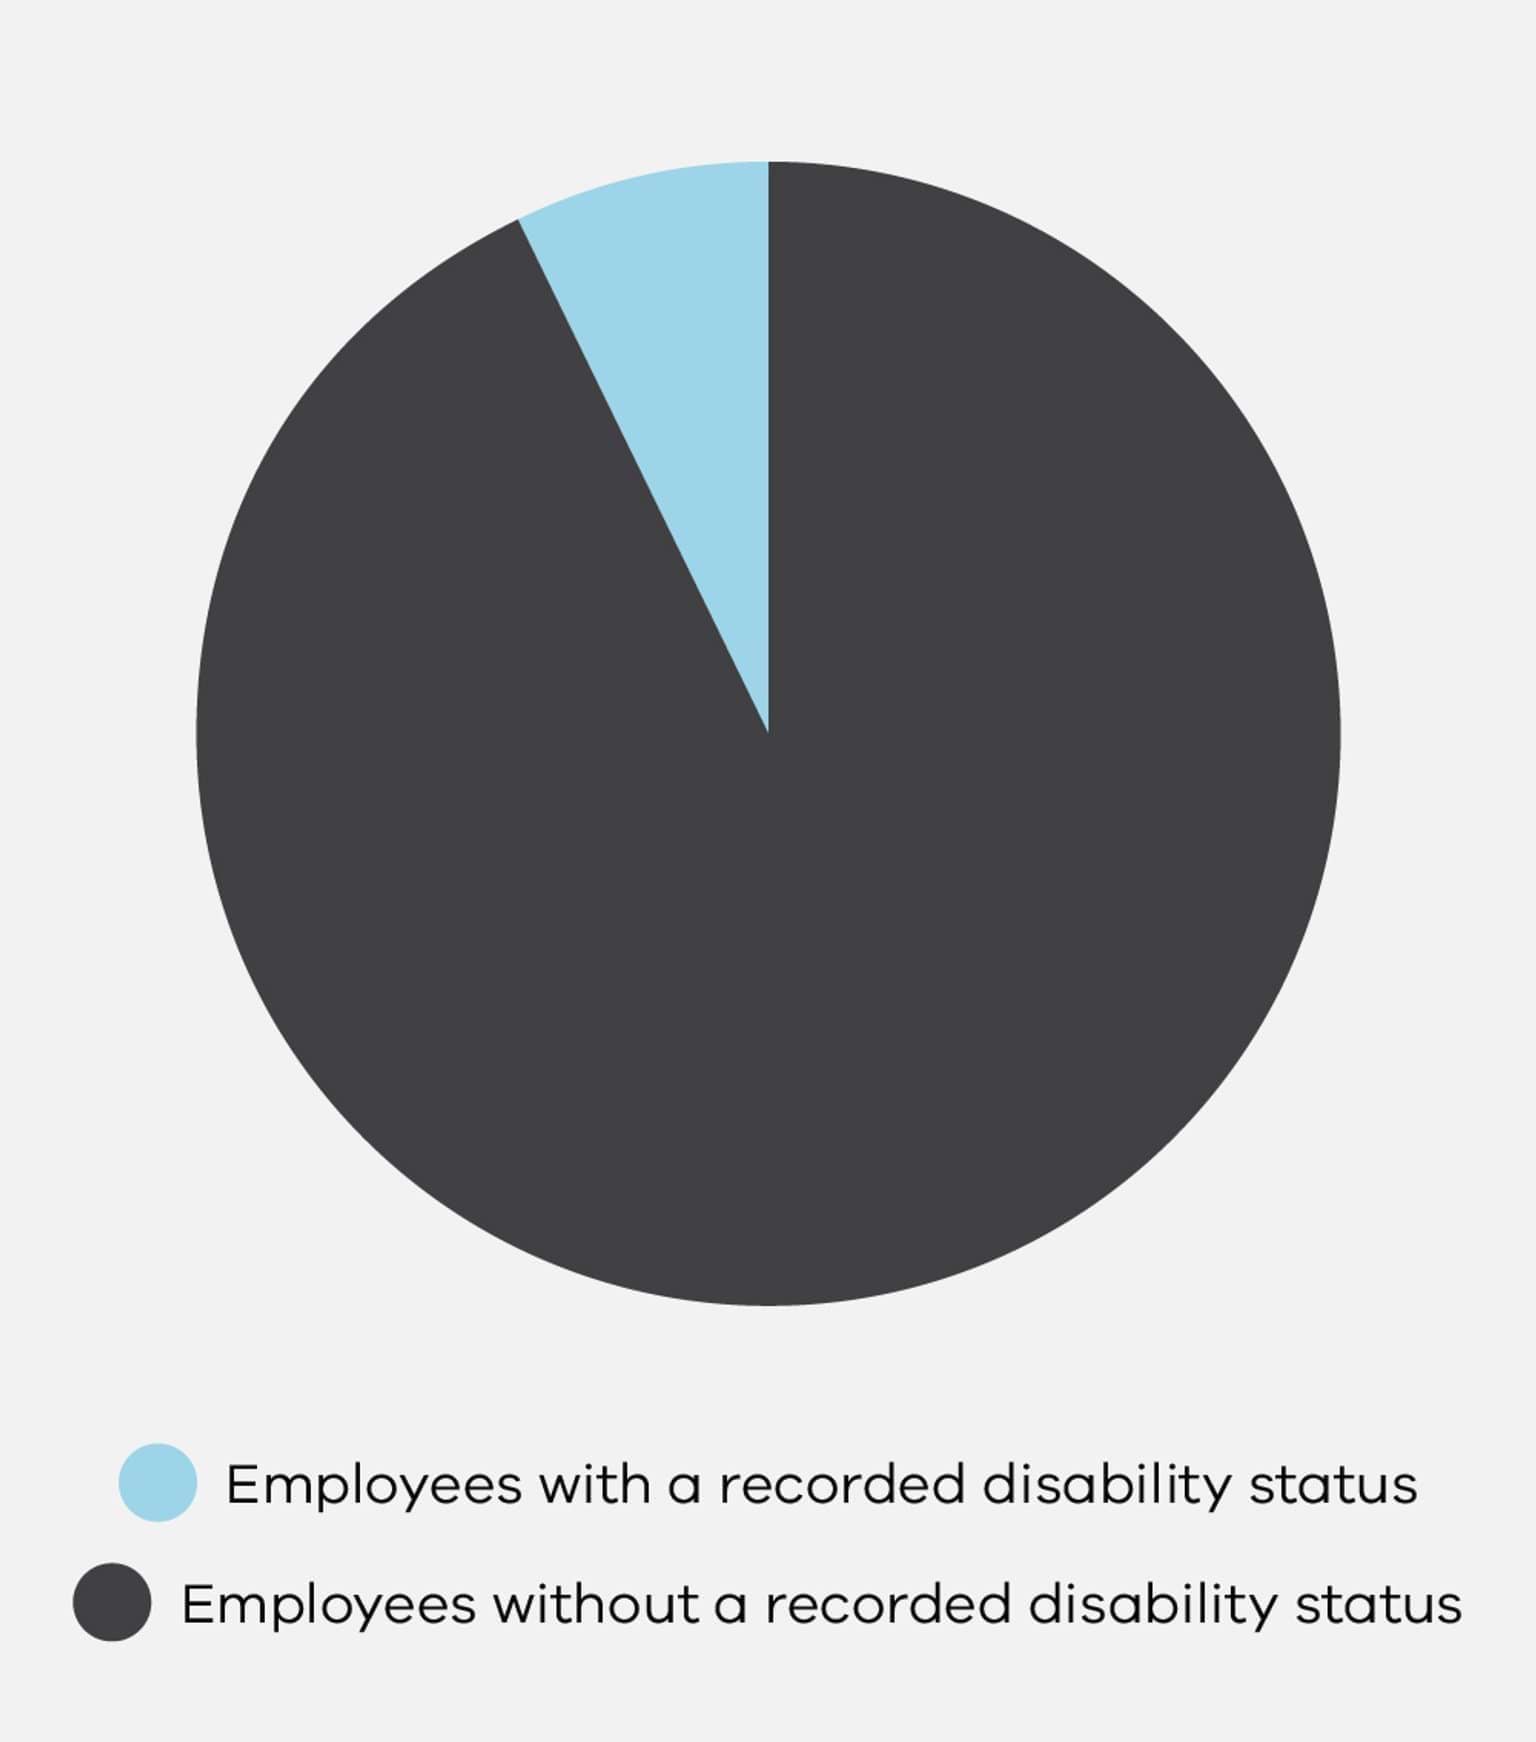
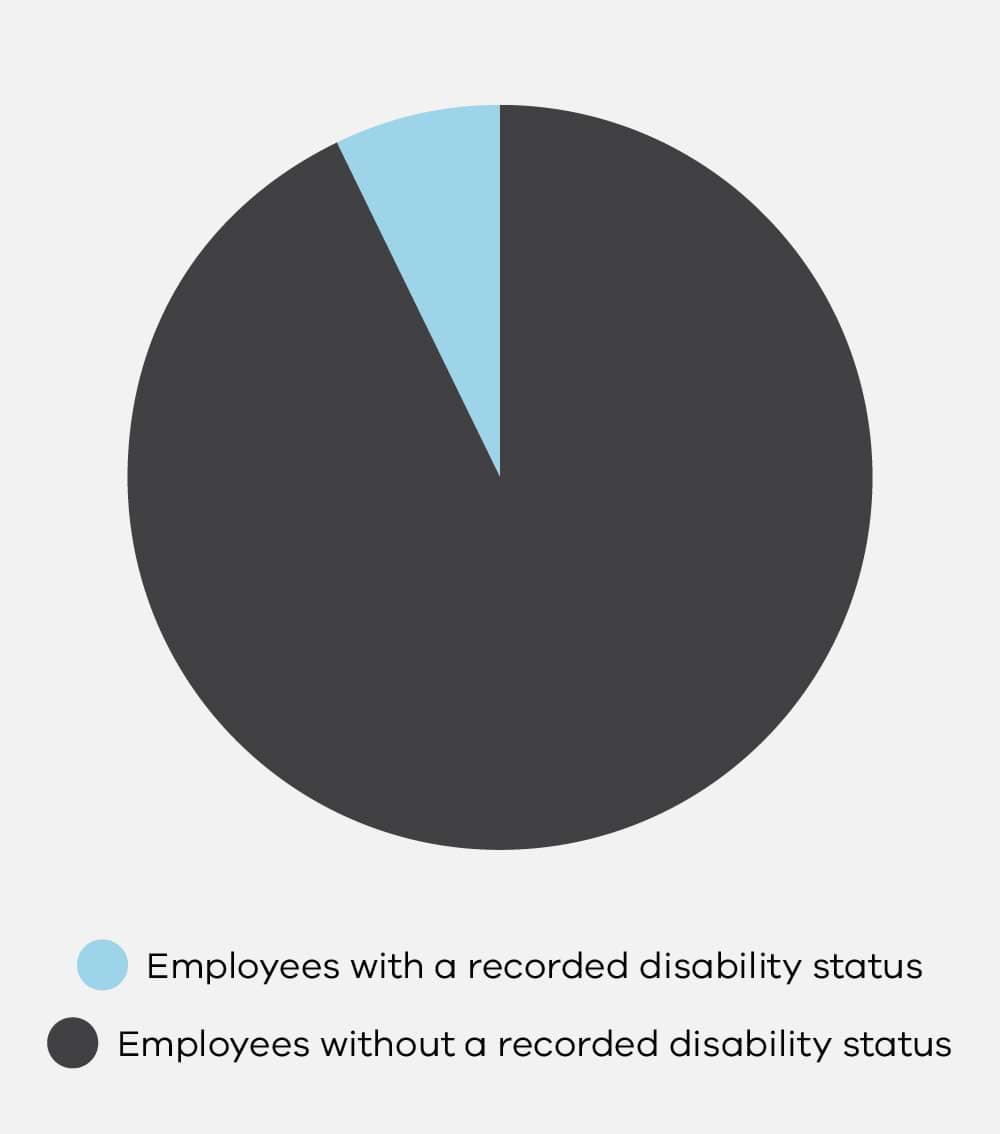
Respondents to the People matter survey who identified as having a disability made up 5% of the total workforce, with men and women equally represented in this percentage.
While the survey response rates were higher than the workforce data, the low number of respondents identifying with disability meant that responses were too low to generate reliable results in some analyses, such as at the industry level.
Gender composition at all levels of the workforce
Women with disabilities were underrepresented in managerial roles.
As Table 3.1 highlights, men without disabilities were far more likely to hold positions as senior managers (overseeing lower-level managers) and supervisors (managing employees who are not managers themselves) than men with disabilities, and women regardless of disability status.
| Disability status and gender | PMS Respondents reporting senior manager roles | PMS Respondents reporting supervisor roles |
| Women with disabilities | 5% | 12% |
| Women without disabilities | 7% | 15% |
| Men with disabilities | 9% | 15% |
| Men without disabilities | 13% | 20% |
Source: 2021 workplace gender audit data (People matter survey data) Notes: Total sample of 106,069 respondents.
Women with disabilities reported the lowest rates of supervisor and senior manager roles of any cohort in the table above.
Women with disabilities and women without disabilities had an equal likelihood of working part-time, with both at 44%.
As shown in Table 3.2 below, women were more than twice as likely to work in part-time roles compared to men, regardless of whether they had a disability. 21% of men with disabilities worked part-time, whereas the percentage was lower, at 12%, for men without disabilities.
| Disability status and gender | PMS Respondents reporting part-time work |
| Women with disabilities | 44% |
| Women without disabilities | 44% |
| Men with disabilities | 21% |
| Men without disabilities | 12% |
Source: 2021 workplace gender audit data (People matter survey data) Notes: Total sample of 106,069 respondents.
Gender pay equity
Women with disabilities were overrepresented in lower income brackets and underrepresented in higher income brackets.
Women with disabilities were more likely than men (with or without disabilities) or women without disabilities to report full-time base salaries under $95,000. Respondents to the People matter survey 2021, from which this data is drawn, were able to select their yearly income from salary brackets increasing in $10,000 increments. These ranged from ‘Less than $45,000’, followed by ‘$45,000-$54,999’, through to ‘$175,000-$184,999’ and finally ‘$185,000 or more’. Respondents were also given the option to select ‘Prefer not to say’. Table 3.3 shows these salary options rolled up into $30,000 groupings.
The average annual full-time salary in Australia, based on the ABS full-time weekly earnings in November 2021, was approximately $91,000 (ABS 2022b). While the options provided to respondents in the People matter survey do not allow analysis of salaries above or below $91,000 specifically, Table 3.3 demonstrates that women with disabilities were more likely than men (with or without disabilities) and women without disabilities to report a full-time equivalent salary of less than $95,000.
| Salary Range | Women with disabilities | Women without disabilities | Men with disabilities | Men without disabilities |
| Less than $65,000 | 26% | 22% | 17% | 10% |
| $65,00 – 94,999 | 32% | 32% | 32% | 28% |
| $95,000 –$124,000 | 20% | 22% | 24% | 28% |
| $125,000 –$154,999 | 4% | 5% | 8% | 11% |
| $155,000 –$184,999 | 2% | 2% | 3% | 5% |
| Over $185,000 | 1% | 2% | 2% | 6% |
| Prefer not to say | 9% | 10% | 10% | 9% |
| Unanswered | 6% | 5% | 5% | 3% |
Source: 2021 workplace gender audit data (People matter survey data) Notes: Total sample of 106,069 respondents.
Income disparity at the upper end of the pay scale shows the compounding impact of inequality on the basis of disability status and gender. Men without disabilities were more than 3 times as likely to report incomes over $125,000 when compared to women with disabilities. Men with disabilities were still almost twice as likely to report incomes over $125,000 than women with disabilities.
Estimated industry pay gaps were generally largest between women with disabilities and men without disabilities.
As set out in Table 3.4, across 3 of the 4 industry groups with sufficient data and at the all-industry level, estimated pay gaps were largest between women with disabilities and men without disabilities. At the all-industries level, the pay gap between these two groups was 19%.
In the Public healthcare sector, this gap was largest at 25%. In the Victorian Public Service men with disabilities experienced a larger pay gap (13%) than women with disabilities (10%), when compared to men without disabilities.
In all industries except the Victorian public service, there was a pay gap between women with disabilities and men with disabilities in favour of men (1-17%).
The pay gaps presented here are estimates, produced using a combination of salary bracket data from the People matter survey, outlined above, and the Commission’s workforce remuneration data. This is because the workforce data is not comprehensive enough to produce reliable pay gap calculations based on actual salaries. Please see the Introduction to this report for further detail on the approach taken.
| Industry | Local government | Public healthcare | TAFE and other education | Victorian Public Service | All industries |
| Women without disabilities vs men without disabilities | 10% | 21% | 12% | 9% | 13% |
| Women with disabilities vs men with disabilities | 1% | 17% | 13% | -4% | 10% |
| Men with disabilities vs men without disabilities | 12% | 10% | 11% | 13% | 10% |
| Women with disabilities vs women without disabilities | 3% | 5% | 12% | 1% | 7% |
| Women without disabilities vs men with disabilities | -3% | 13% | 1% | -5% | 3% |
| Women with disabilities vs men without disabilities | 13% | 25% | 23% | 10% | 19% |
Source: 2021 workplace gender audit data (People matter survey data) Notes: Total sample of 106,069 respondents.
The lower salaries reported by men with disabilities align with international research suggesting the salaries of men with disabilities may be suppressed, due to the fact disabilities can conflict with traditional norms of masculinity (Pettinicchio and Maroto 2017). This is an example of where harmful gender norms can also disadvantage men.
Workplace sexual harassment and discrimination
Women with disabilities experiences higher rates of sexual harassment at work.
Both women and men with disabilities reported experiencing higher rates of sexual harassment than those without disabilities. Table 3.5 demonstrates the percentage of respondents to the People matter survey who said they had experienced sexual harassment in the last 12 months.
Table 3.5. Percentage of People matter survey respondents reporting they experienced sexual harassment in the last 12 months, by disability status and gender.
| Disability status and gender | PMS Respondents reporting sexual harassment |
| Women with disabilities | 12% |
| Women without disabilities | 6% |
| Men with disabilities | 8% |
| Men without disabilities | 3% |
Source: 2021 workplace gender audit data (People matter survey data) Notes: Total sample of 106,069 respondents.
Women with disabilities reported experiencing sexual harassment at twice the rate of women without disabilities, and 4 times the rate of men without disabilities.
Women with and without disabilities reported ‘Sexually suggestive comments or jokes that made me feel offended’ as the most common form of sexual harassment experienced with ‘Intrusive questions about my private life or comments about my physical appearance’ the second most common. In men with and without disabilities the same most common experiences were reported, but in reverse order.
The People matter survey 2021 was conducted during the COVID-19 pandemic. This was when many people were working from home (except for essential workers, such as healthcare workers). This means that there might have been a potential decrease in certain types of sexual harassment between workers. However, it remains unclear how much the COVID-19 pandemic impacted these numbers.
Individuals with disabilities experienced higher rates of discrimination.
Regardless of gender, employees with disabilities were approximately three times as likely to say they had experienced discrimination compared to their colleagues without disabilities. Table 3.6 shows these differences in experiences of discrimination.
| Disability status and gender | PMS Respondents reporting discrimination |
| Women with disabilities | 14% |
| Women without disabilities | 5% |
| Men with disabilities | 15% |
| Men without disabilities | 5% |
Source: 2021 workplace gender audit data (People matter survey data) Notes: Total sample of 106,069 respondents.
The most common type of discrimination reported by women with disabilities was being denied flexible work arrangements or other adjustments. In contrast, men with disabilities, along with women and men without disabilities, most commonly reported being denied opportunities for promotion.
Given access to workplace flexibility and other reasonable adjustments is a key enabler for people with disabilities, this form of discrimination reported by women is concerning.
Recruitment and promotion practices
People with disabilities were less likely to agree that recruitment and promotion decisions in their organisations were fair.
As Table 3.7 shows, both women and men with disabilities were less likely to agree with the statement ‘My organisation makes fair recruitment and promotion decisions, based on merit’ than people without disabilities.
| Disability status and gender | My organisation makes fair recruitment and promotion decisions, based on merit | |
| Strongly agree or agree | Strongly disagree or disagree | |
| Women with disabilities | 46% | 25% |
| Women without disabilities | 55% | 16% |
| Men with disabilities | 43% | 28% |
| Men without disabilities | 53% | 22% |
Source: 2021 workplace gender audit data (People matter survey data) Notes: Total sample of 106,069 respondents. ‘Neither agree nor disagree’ and ‘Don’t know’ response options are not included in the table.
People with disabilities were less likely to feel that they had an equal chance at promotion in their organisations.
As Table 3.8 shows, people with disabilities were less likely to agree, and more likely to disagree with the statement ‘I feel I have an equal chance at promotion in my organisation’.
| Disability status and gender | I feel I have an equal chance at promotion in my organisation | |
| Strongly agree or agree | Strongly disagree or disagree | |
| Women with disabilities | 34% | 37% |
| Women without disabilities | 47% | 24% |
| Men with disabilities | 35% | 38% |
| Men without disabilities | 47% | 26% |
Source: 2021 workplace gender audit data (People matter survey data) Notes: Total sample of 106,069 respondents. ‘Neither agree nor disagree’ and ‘Don’t know’ response options are not included in the table.
Flexible work practices
Women with disabilities were more likely than women without disabilities, and men regardless of disability, to report working flexibly.
Both women and men with disabilities reported higher levels of flexible working arrangements than those of the same gender without disabilities. However, women with disabilities were the most likely of any of these groups to report working flexibly. Table 3.9 illustrates the proportion of respondents in each group who reported using flexible work.
| Disability status and gender | PMS Respondents reporting flexible work |
| Women with disabilities | 39% |
| Women without disabilities | 30% |
| Men with disabilities | 31% |
| Men without disabilities | 22% |
Source: 2021 workplace gender audit data (People matter survey data) Notes: Total sample of 106,069 respondents.
Women, regardless of disability status, most often reported using flexible start and finish times. Men, regardless of disability status, most often reported working part time.
Discussion and conclusions
Consistent with previous research, this chapter highlights the significant structural barriers faced by women with disability in workplace contexts. The Commission’s data analysis demonstrates that women with disability are underrepresented in senior roles and overrepresented in below-average full time salary brackets. Furthermore, women with disability disproportionately experience sexual harassment in Victorian public sector workplaces. These findings highlight that there is a still a long way to go to achieve the meaningful inclusion of women with disability in the Victorian public sector.
The Commission’s workplace gender audit data and the funded research project led by Dr Williams and colleagues demonstrate the importance of improved data collection about people of different genders with disability. Data is required to better understand how ableism and gender inequality combine to produce specific workplace inequalities. The lack of workforce data on disability status, and thus the need to rely on survey data that is not linked to employee records, meant that this analysis was unable to explore the access to training and other professional development and promotional opportunities, as well as occupational and industrial segregation of people with disabilities in Victorian public sector organisations. The Commission also had to estimate pay gaps rather than being able to rely on precise salary data.
The findings in this chapter reinforce the importance of systemic change to drive workplace equality for women with disability. In particular, consistency in the support that organisations provide to women with disability can reduce the barriers to their full participation. Ensuring inclusive environments and access to consistent support means that women with disability do not choose to limit their career progression in order to remain with a supportive manager or in a supportive team (Williams et al., 2023). It also reduces the need for women to advocate for themselves. This is important, not only because disability self-advocacy can take time, effort and an emotional toll, but also because women and gender-diverse people with disability who self-advocate are often viewed through harmful gender stereotypes as ‘pushy’ or ‘difficult’ (Williams et al. 2023).
Developing organisation-wide support and inclusion involves moving towards a culture of respect and trust. Important gains can be made by focussing on the role of middle-management, building psychological safety for women with disability, and evaluating relevant policies and their implementation (Williams et al., 2023). Shifting the responsibility from individuals with disability to organisations can be achieved by encouraging middle-management to proactively initiate career progression conversations with women with disability and raise awareness around available sources of support, such as leadership and mentoring programs (Williams et al. 2023). Openly acknowledging gender inequality and ableism in the workplace, while celebrating women with disability as assets to an organisation rather than burdens, can encourage respectful communications and an inclusive culture (Williams et al. 2023). Including women with disability in policy design and review and standardising remote and flexible working options can ensure policies are fit-for-purpose, do not unintentionally discriminate and do not fall to individuals to negotiate (Williams et al. 2023).
Lastly, while this chapter draws attention to the interactions between gender and disability in a workplace setting, there is still work to do to improve data collection and knowledge about people of self-described gender with disability. Research from Williams and her colleagues (2023, p. 15) found that participants who identified as non-binary or ‘other’ gender identities were more likely to report having a disability than women or men. In addition, non-binary people with disability encountered greater challenges related to workplace culture than women or men with disability (Williams et al., 2023, p.4). These findings highlight that further research about this cohort is required.
Figure 3.2. Estimated pay gaps by comparator groups and industry.

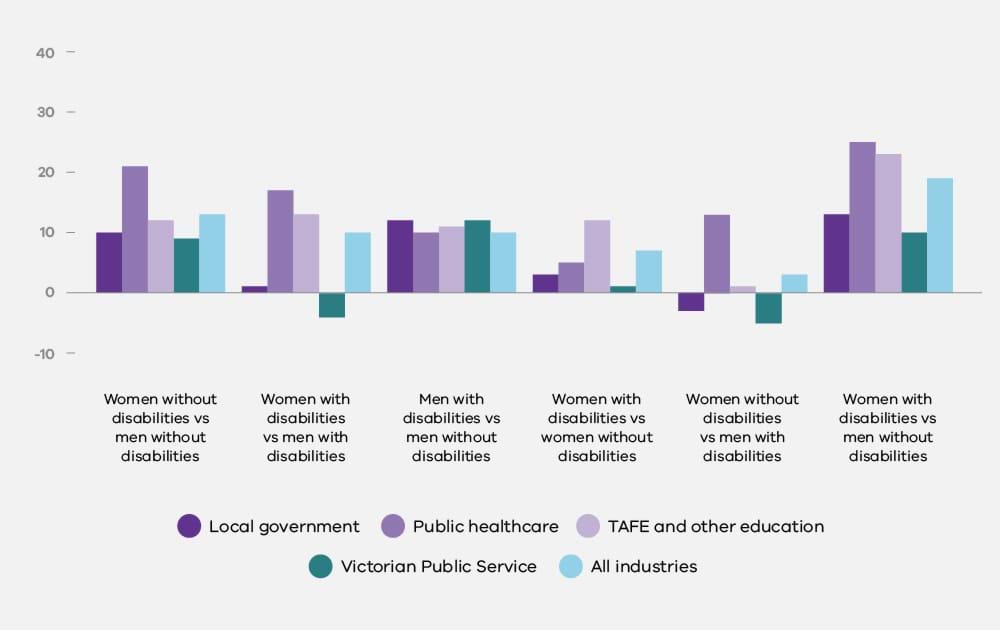
Chapter 4: Gender and Culturally and Racially Marginalised Employees
This chapter looks at intersectional data and insights in relation to gender and cultural identity
Reflecting the Commission’s commitment to using the preferred terminology of groups who experience discrimination, this chapter uses the term ‘culturally and racially marginalised’ (CARM) to refer to people who are not white or who are outside the dominant Australian culture. The term CARM encompasses ‘Black, Brown, Asian, or any other non-white group’ (DCA, 2023:5), and it directly acknowledges that people may experience marginalisation because of their culture, race, or religion1. Previous terms such as CALD (culturally and linguistically diverse) and NESB (non-English speaking background) often mask the structures of race and racism that shape the experiences of CARM people (DCA 2023), including in the workplace. In choosing to adopt the term CARM in this report, the Commission acknowledges that language and terminology are evolving in this area, and these conversations remain ongoing. Although the lives of Aboriginal and/or Torres Strait Islander peoples are also shaped by structures of race and racism, the Commission does not directly discuss their unique experiences here. Instead, Chapter 1 specifically reports on the workplace experiences of First Nations Australians.
Australia is a culturally diverse nation, built on the contributions of established migrant communities who have built their lives in Australia over many generations, as well as more recent, first-generation migrants. In 2021, 1 in 2 Australians were either born overseas or had parents who were born overseas (FECCA 2022a:17)2. In addition to our cultural diversity, Australia is also increasingly religiously diverse. Over the last 50 years, the number of Australians who describe themselves as Christian has declined. On the other hand, those reporting no religious affiliation, or an affiliation with ‘Other religions’ (an ABS category which includes Hinduism, Islam, Judaism and more) has risen consistently over the last 20 years to 10% of the population (ABS 2022d).
Diversity alone, however, does not translate to equality. Racial inequality in Australia is shaped by the legacy of colonialism (discussed in more detail in Chapter 1, as well as the relationship between the Australian state and non-white immigrants (Elias et al. 2021). The Immigration Restriction Act 1901 (also known as a the ‘White Australia policy’) was one of the first Commonwealth laws passed after Federation. It sought to limit non-white (particularly Asian and Pacific) immigration to Australia (NAA n.d.). Two other key parts of the White Australia policy were pieces of legislation designed to ensure that non-white immigrants could not access work – namely the Pacific Island Labourers Act 1901 which restricted the entry of Pacific Islanders into Australia, and the Post and Telegraph Act 1901, which required that ships carrying Australian mail employ only white-skinned people (NAA n.d.). The Immigration Restriction Act ended in 1958. Other parts of the White Australia policy, such as the registration of non-British migrants as ‘aliens’, continued into the early 1970s (NAA n.d.).
In the post-war context, international pressure, as well as the need for an increased labour force, saw Australian governments move away from assimilationist policies that required migrant groups to conform to the dominant Australian culture (Elias et al. 2021). However, the legacy of these exclusionary policies continues to impact the experiences of CARM people across multiple facets of their lives, including in the workplace. From 1973, a policy of multiculturalism formally promoted acceptance of diverse cultural communities and a more inclusive migration program (Elias et al. 2021) and the Racial Discrimination Act of 1975 made it illegal to discriminate against people based on their race.
Despite the rhetoric of multiculturalism in Australia, CARM groups continue to have unequal access to institutional power and leadership positions as discrimination based on race, cultural background, language or religion persists (Mansouri 29 March 2022; Armillei and Mascitelli 2017). The Scanlon Foundation’s 2021 Mapping Social Cohesion research found that 16% of Australians experienced discrimination because of their skin colour, ethnicity, or religion in the previous 12 months (Scanlon Foundation 2021:30). This figure rose to 34% for people born in a non-English speaking country (Scanlon Foundation 2021:13). CARM people face unique and persistent barriers to health (AIHW 2022b), housing (Blackford et al. 2023), education (Lenette et al. 2019) and personal and communal safety (Afrouz and Robinson 2023; Segrave et al. 2021). CARM people also experience various forms of workplace disadvantage and discrimination, from highly skilled CARM people who are denied appropriate career opportunities, to refugees and asylum seeker populations who experience barriers to accessing entry-level or low-skilled positions (Carangio et al. 2021; Oppare-Addo and Bertone 2020).3
There is very little workforce data and research in relation to gender-diverse Australians who are culturally and racially marginalised. The Commission expects that the Gender Equality Act 2020 (Vic) (the Act) will drive improved data collection and quality in Victoria to reflect the gender diversity that exists in our society and make gender-diverse cohorts visible. In this chapter, the Commission acknowledges this lack of data on trans and gender-diverse people has meant that issues are generally only able to be analysed and discussed for women and men.
Key workplace issues for CARM people
CARM people face intersecting and systemic barriers to employment, which limit their economic participation, career development, pay and overall job security. According to the Federation of Ethnic Communities’ Councils of Australia (FECCA) (2022b:15) some of the systemic workplace inequalities faced by some CARM migrants, depending on their country of origin, may include:
- Lack of recognition of overseas qualifications, skills, and work experience
- Lack of knowledge about Australian workplaces, industries, job application processes and culture
- Pre-migration life experiences, particularly trauma and torture
- Lack of access to upskilling opportunities
- Cost barriers to accessing qualifications and job requirements, such as driving licences
- Caring responsibilities and unaffordable paid care.
These challenges often result in CARM migrants having to take low-paid and low-skilled positions that do not reflect their previous experience and qualifications.
This inequality is not limited to migrant groups, however. Second or third generation CARM people who have grown up in Australia, have Australian qualifications and work experience, and a knowledge of Australian workplace norms, still experience racism across hiring, promotion and career development systems and processes (Leigh 2023). Second and third generation CARM people also still experience interpersonal racism within the workplace, due to racist attitudes and behaviours (Mansouri 2022). Research points to how the limited avenues for reporting racism and racist behaviour in the workplace continue to negatively impact upon CARM people’s inclusion and safety (Annese 2022).
According to the Australian Human Rights Commission (2022b) systemic racism results ‘when cultural norms, laws, ideologies, policies and practices result in the unfair treatment of some groups compared to others’. Interpersonal racism, on the other hand, is racism that occurs between people, at the individual level (DCA 2023). Between 2020 and 2021, almost 40% of all race discrimination complaints received by the Victorian Equal Opportunity and Human Rights Commission (VEOHRC) were work-related (VEOHRC n.d.). Common examples included racial discrimination in hiring or promotion practices, as well as racist abuse.
Key workplace issues for CARM women
Discrimination is a barrier to participation and progression
CARM women have a lower rate of workforce participation than CARM men (47.3% compared to 69.5%) (WGEA 2023).
CARM women face a range of barriers to employment and career progression based on racist attitudes and assumptions. These include:
- Being denied training and other career advancement opportunities such as guidance and mentoring (DCA 2023; Gyimah et. al. 2022)
- Being overlooked for promotion, despite receiving good feedback (Gyimah et al. 2022)
- Being subjected to a higher bar, underestimated, and negatively singled out compared to non-CARM women colleagues (Diversity Council of Australia 2023)
- Working in culturally unsafe workplaces where practices of racism, sexism, tokensim, and implicit and explicit bias are unaddressed (Pillay 2021)
- Limited recognition of overseas education, work experience, and qualifications (Carangio et al. 2021) and a higher likelihood of working in unstable and casual roles within lower paid industries and sectors as a result (for example, in 2019, 90% of employed male recent migrants were employed full-time compared with 63% of females, (ABS 2020).
Experiences of sexual harassment and gendered violence
International research highlights how gender-based violence is shaped by systemic racism in ways which can increase the risk of violence for CARM women, make them more likely to experience victim-blaming, and limit their access to formal justice (Montoya 2019).
Recent Australian studies reveal inconsistencies in reported rates of sexual harassment and gendered violence towards CARM women. While some studies suggest that CARM and non-CARM women experience sexual harassment at similar rates (AHRC 2018), others suggest that CARM women are twice as likely as to experience sexual harassment as non-CARM women (Baird et al. 2018:92). For migrant CARM women, this disparity may be due to the increased barriers faced in relation to reporting sexual harassment and assault. Navigating difficult visa systems and high rates of insecure employment can make migrant women more vulnerable to exploitation, and less likely to want to challenge and report negative behaviours for fear of legal and economic repercussions (Respect@Work n.d.).
CARM women may also bring a different lens to understanding and identifying instances of sexual harassment. This means that the type of questions asked in surveys, such as whether, for example, a legal or more behavioural definition of sexual harassment is used, can greatly impact upon the types of responses given by CARM women (Respect@Work n.d.). Cultural norms such as gender roles and attitudes to authorities also impact upon CARM women’s recognition and reporting of sexual harassment in the workplace (Welsh et al. 2006; Villegas 2019). Further research is needed to better understand how CARM women experience gendered violence in Australian workplaces.
Workplace and community cultures disadvantage CARM women
CARM women are often required to do additional mental and behavioural work to try to fit into the dominant Australian culture. At the same time, they face workplace discrimination because they do not fit the ideal worker and leadership prototype, which is more masculine and Western (DCA 2023). As a result, CARM women often ‘code-switch’ or enact practices of ‘white-adjusting’ to fit in and try to get ahead by reflecting white workplace cultures (Khadem 2023). This is particularly challenging for women from minority religious backgrounds, who report being unable to freely express and practice their cultural and religious beliefs, such as not shaking hands with men or avoiding situations where alcohol is served (Murray and Ali 2017).
Community cultures can also create challenges to employment for some CARM women. For example:
- Some CARM women face higher cultural expectations relating to domestic and caring work, including cultural expectations that CARM women prioritise immediate and extended family caring needs over paid work responsibilities (FECCA 2022b);
- Some CARM women are pressured by families and communities to work in feminised sectors that are perceived as culturally acceptable. However, these often have higher rates of precarious work and lower salaries (Harmony Alliance 2019); and
- CARM women entering the workforce can threaten traditional male ‘breadwinner’ models of the family in some communities, increasing their vulnerability to domestic and sexual violence (Harmony Alliance 2019).
It should be noted that these assumptions about gender roles cross many cultures and are not confined to CARM populations.
These barriers from the dominant Australian culture, workplace cultures, as well as family and community expectations, present compounding challenges to CARM women’s equal workplace participation.
Commissioned research
In 2022-23, the Commission engaged Dr Ellen Cho and Professor Marie Segrave to undertake research into the experiences of migrant and refugee women employees in 6 Victorian local councils. The focus on migrant and refugee women was designed to complement a broader study funded under the Commission’s 2021 Research Grants Round, which looked at how to achieve workplace equality for culturally diverse women in the Victorian public sector (Pillay et al. 2022). Cho and Segrave undertook 25 online, semi-structured focus group discussions and 4 interviews (by request) with a total of 81 participants. The participants included migrant and refugee women working in the 6 councils, as well as members of each organisation’s executive management teams. The research team investigated how the women experienced gender equality initiatives within their workplaces. They also asked the executive management teams what they thought was needed to support migrant and refugee women to thrive in the workplace. Further details of the research methodology can be found at Victorian local councils and gender equality: Examining commitments to diversity and the experiences of women from migrant and refugee backgrounds.
Key findings
Recruitment
Participants identified discrimination and barriers to participation in the recruitment processes of the councils where they worked. They reported experiences such as having their English proficiency misjudged or having to adopt an English-sounding name to be noticed.
Retention
Retention of migrant and refugee women, and other diverse cohorts, in the local government sector was seen as lacking. Participants reported that their organisations failed to work to retain women from diverse cultural backgrounds. Participants often felt that their employers did not trust their abilities, observed that men were promoted faster than women and believed their access to flexible work options was restricted.
Promotion
Participants identified barriers to promotion. These included assumptions based on traditional gender roles and expectations, such as the false belief that women cannot balance work and childcare. While many people were seen to rely on personal connections to advance their careers, migrant and refugee women were not able to draw on these. Inflexible work arrangements in leadership roles and a lack of migrant or refugee role models in leadership positions were also seen as barriers.
Cultural and language barriers, and a lack of representation in decision-making bodies, were seen as further barriers to career progression. Examples raised by participants included superficial diversity and inclusion policies and practices, as well as poor representation of migrant and refugee women in diversity working groups and in decision-making groups.
Leadership
The leadership styles of women from migrant and refugee backgrounds are often undervalued in local councils. Women participants challenged the narrow understandings of ‘leadership’ within their organisations and reported that their leadership styles were not valued. Some women also felt that their organisations did not see them as reliable or competent, and as a result, that they were constantly having to prove themselves – regardless of their abilities, training or skills.
Reporting sexual harassment and racism
Executive participants expressed concern about the underreporting of sexual harassment in their workplaces. Feelings of a lack of safety on the part of complainants, a lack of trust in the organisation, and a belief that no positive change would come from reporting sexual harassment or other forms of mistreatment were identified as the drivers of low numbers of formal sexual harassment reports. Some executive participants also suggested that a lack of diversity in leadership was a contributing factor to this lack of trust in reporting processes. However, the researchers noted that direct discussions about power inequalities, racism and the drivers of harassment were lacking in these conversations.
CGEPS audit data: Key insights
This section reports on insights from the Commission’s 2021 workplace gender audit workforce data and the 2021 People matter survey (PMS). Workforce data is data drawn from organisations’ human resources and payroll systems. The People matter survey is an anonymous survey completed by approximately 90% of organisations with reporting obligations under the Act.
Culturally and racially marginalised employees in the 2021 workplace gender audit
Only 72 organisations (24%) were able to provide any workforce data regarding the cultural identities of their employees, and this data was generally far from comprehensive. Across all organisations with reporting obligations in the 2021 workplace gender audit, only 4% of employees had their cultural identity recorded. The remaining 96% of employees covered by the 2021 workforce data either had no cultural identity recorded or worked for organisations that did not collect and store information about cultural identity through their workforce systems at all.
Having such a small amount of workforce data means it would be impossible to draw any reliable and generalisable conclusions from it. As a result, the data presented in the remainder of this section is derived from the 2021 People matter survey.
Figure 4.1. Availability of cultural identity information in the workforce data, workplace gender audit 2021
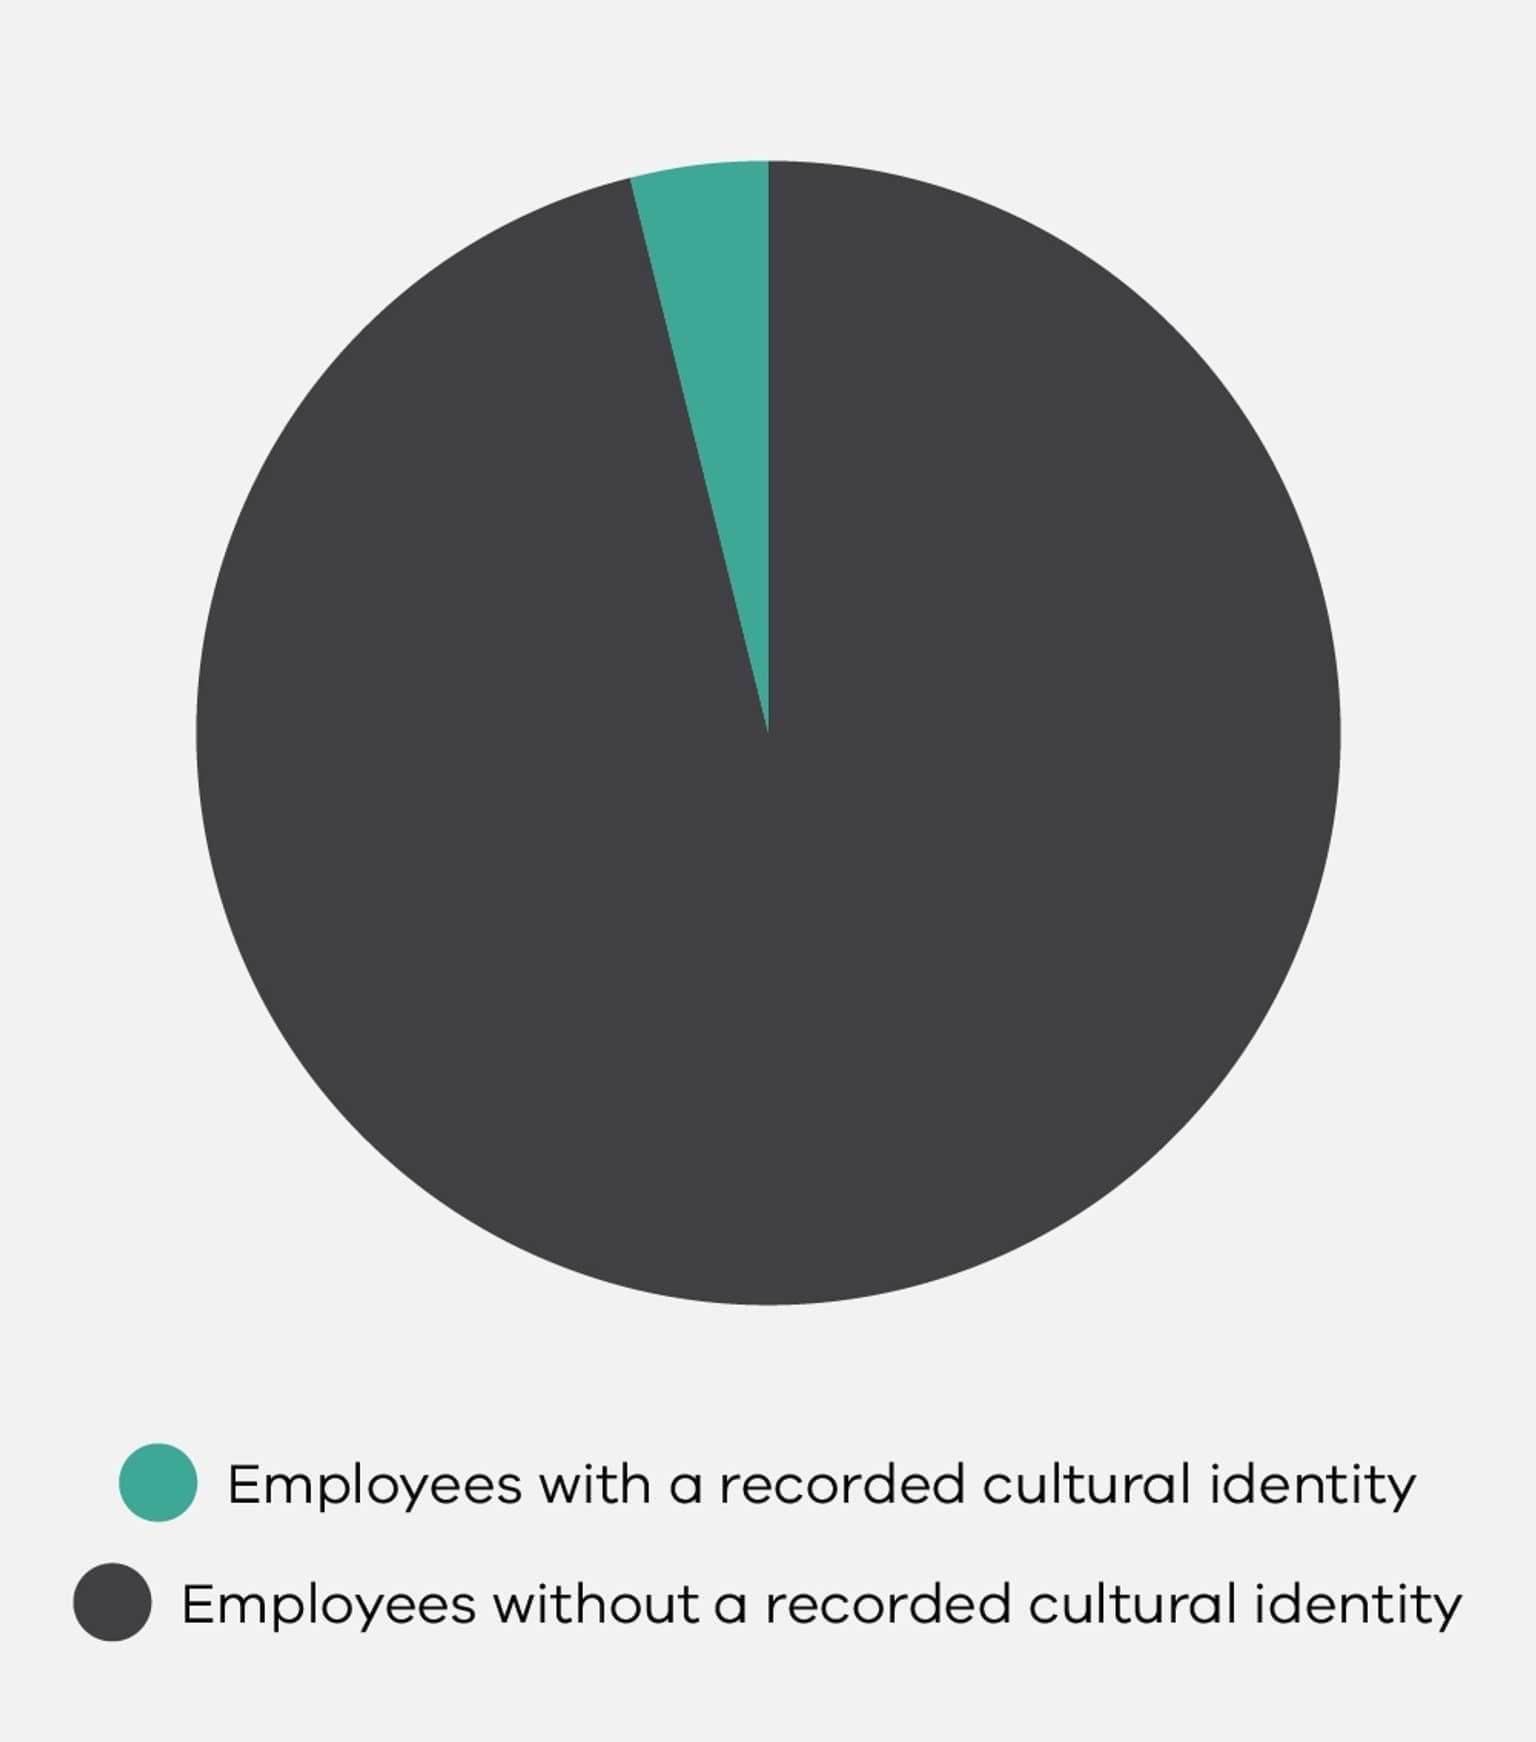
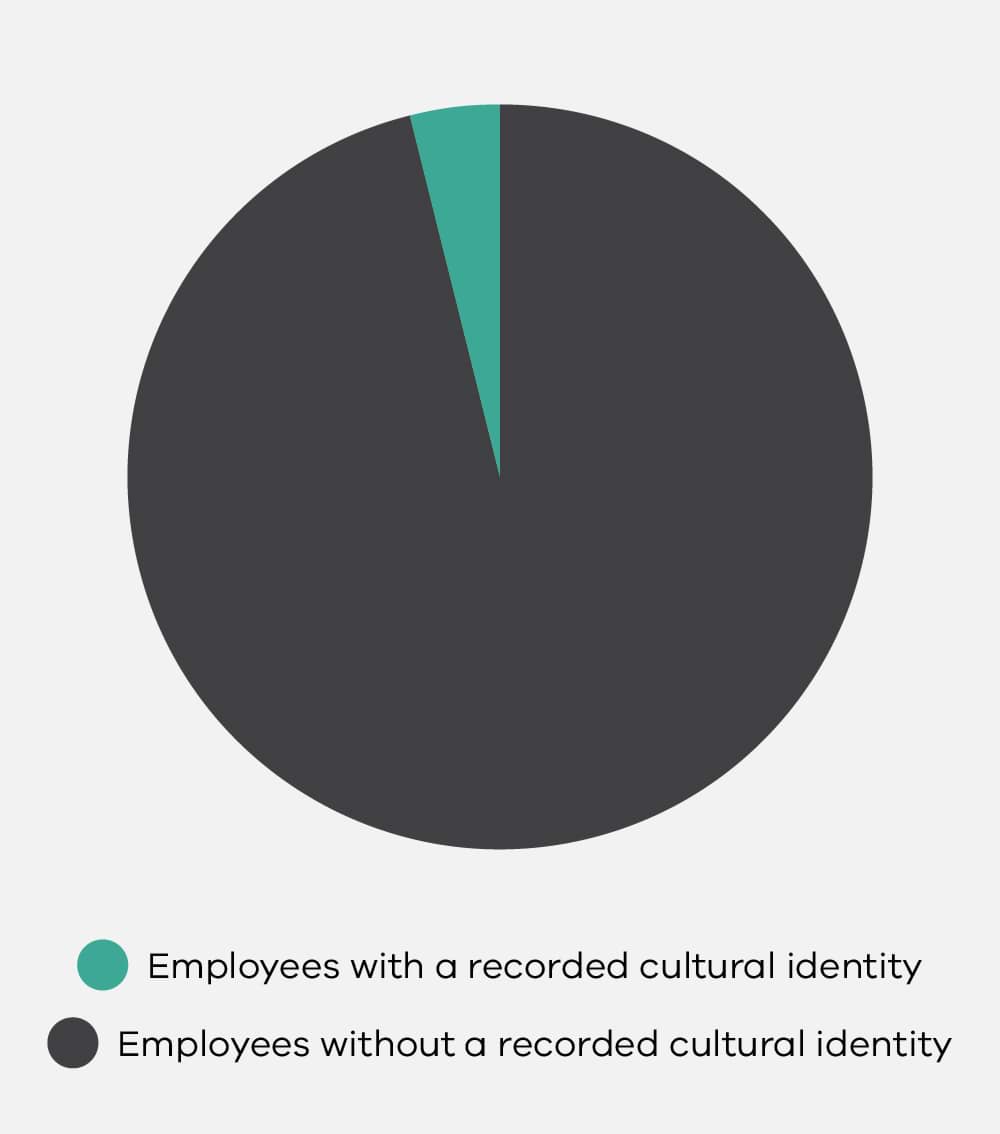
Counting CARM women in this report
Considerable challenges exist when organisations and governments attempt to ‘count culture’ in a meaningful way (Allen 2021; DCA 2021). The lack of a standardised approach to measuring cultural diversity and ethnicity in the Australian context means that organisations may rely, for example, only on information from country of birth survey fields, an approach that is likely to exclude some CARM people from the analysis (FECCA 2020). The key tension in data standardisation debates is between approaches that enable simpler conversations around measuring and tracking progress in relation to cultural diversity, versus a more detailed and nuanced approach which better accounts for differences between specific subsets of the CARM population (DCA 2021).
As defined above, this report uses the acronym CARM as a catch-all term for culturally and racially marginalised populations. Ideally, the Commission would be able to usefully tease out some of the distinctions between diverse experiences of discrimination and disadvantage in the workplace on the basis of culture or ethnicity, also taking into account diversities in religious identification and languages spoken. However, given that the available data does not allow for this level of disaggregation the Commission is unable to do so here.
To identify people who should be included in an analysis of the experiences of CARM people in the workplace, it was necessary to construct a proxy measure of this group. This was developed by drawing on responses to the following fields from the People matter survey 2021:
- How would you describe your cultural identity?
- Do you speak a language other than English with your family or community?
- In which country were you born?
In the People matter survey, respondents are asked to select from cultural identity fields. They may select more than one, and some employees elect to use the ‘other’ field and enter free text.
In the analysis of CARM people within this dataset, the Commission included those who selected at least one of the following identities:
- African (including Central, West, Southern and East African);
- Central Asian;
- Central and/or South American;
- East and/or South-East Asian;
- Maori;
- Middle Eastern and/or North African;
- Pacific Islander; or
- South Asian.
The Commission’s decision not to include the categories of North American, New Zealander, and English, Irish, Scottish and/or Welsh poses limitations. For example, this approach does not include people who are both African and North American, but only selected the latter category. In these cases, the Commission cross-checked with the ‘Country of Birth’ field and the ‘Language’ field. When a respondent indicated a country of birth falling within the selections highlighted in the paragraph above, or that they spoke a language other than English with their family or community, the Commission also analysed them as part of the CARM group.
Although the lives of Aboriginal and/or Torres Strait Islander peoples are also shaped by structures of race and racism, this chapter does not directly discuss their experiences. Instead, Chapter 1 specifically reports on and analyses the workplace experiences of First Nations Australians.
Taken alone, any of these measures are imperfect for capturing cultural diversity status. The Commission’s approach here, which considers an employee’s identification with a cultural background, language, and country of birth, enables us to build a more complete picture of the cultural diversity that exists within the Commission’s dataset. This approach also reflects the Diversity Council of Australia’s recommended core measures for counting cultural diversity (DCA 2021).
CARM respondents to the People matter survey
Respondents to the People matter survey who identified as coming from backgrounds the Commission categorised as CARM made up 7% of respondents. In terms of gender, 9% of men and 7% of women identified as belonging to these groups. The majority of survey respondents identified as Australian (72%), with a large proportion also identifying as British, Irish or European. A further 11% preferred not to share their cultural identity.
| Cultural Identities | PMS Respondents | Percentage |
| Australian | 75,956 | 71.6% |
| Prefer not to say | 11,223 | 10.6% |
| English, Irish, Scottish and/or Welsh | 8,961 | 8.4% |
| European (including Western, Eastern and South-Eastern European, and Scandinavian) | 7,792 | 7.3% |
| East and/or South-East Asian | 4,732 | 4.5% |
| South Asian | 2,239 | 2.1% |
| Other (please specify) | 2,222 | 2.1% |
| New Zealander | 1,694 | 1.6% |
| Aboriginal and/or Torres Strait Islander | 1,004 | 0.9% |
| Central Asian | 833 | 0.8% |
| Middle Eastern and/or North African | 734 | 0.7% |
| African (including Central, West, Southern and East African) | 695 | 0.7% |
| North American | 468 | 0.4% |
| Central and/or South American | 372 | 0.4% |
| Maori | 243 | 0.3% |
| Pacific Islander | 291 | 0.2% |
| Total respondents | 106,069 |
Source: 2021 workplace gender audit data (People matter survey data) Notes: Total sample of 106,069 respondents. Respondents to the people matter survey are able to select more than one cultural identity. As such, percentages do not add to 100%.
Although data yielded from the People matter survey was greater than the amount received from workforce systems, the relatively small number of respondents identifying as belonging to culturally and racially marginalised groups meant that there was not enough data to generate reliable results in some analyses, such as at the industry level.
Gender composition at all levels of the workforce
Both CARM women and men were underrepresented in managerial roles, but the underrepresentation was greater for CARM women.
As Table 4.2 demonstrates, non-CARM men were far more likely to hold positions as senior managers (overseeing lower-level managers) and supervisors (managing employees who are not managers themselves) than CARM men, and women regardless of CARM status.
| CARM status and gender | PMS Respondents reporting senior manager roles | PMS Respondents reporting supervisor roles |
| CARM women | 3% | 9% |
| Non-CARM women | 7% | 15% |
| CARM Men | 6% | 13% |
| Non-CARM Men | 14% | 21% |
Source: 2021 workplace gender audit data (People matter survey data) Notes: Total sample of 106,069 respondents.
Non-CARM men reported holding senior manager roles at almost five times the rate of CARM women, more than two times the rate of CARM men, and exactly twice the rate of non-CARM women. While the disparity in supervisor roles was less stark, non-CARM men were still disproportionately likely to hold supervisor roles.
CARM women were slightly less likely to work part time than non-CARM women.
As seen in Table 4.3 below, 36% of CARM women reported working part time, compared to non-CARM women at 45%. 14% of CARM men reported working part time, whereas the percentage was lower, at 12%, for non-CARM men.
| CARM status and gender | PMS Respondents reporting part-time work |
| CARM women | 36% |
| Non-CARM women | 45% |
| CARM Men | 14% |
| Non-CARM Men | 12% |
Source: 2021 workplace gender audit data (People matter survey data) Notes: Total sample of 106,069 respondents.
Gender pay equity
CARM women were overrepresented in lower income brackets and underrepresented in higher income brackets.
60% of CARM women reported earning under $95,000 as their full-time base salary, compared to only 37% of non-CARM men. Respondents to the People matter survey 2021, from which this data is drawn, were able to select their yearly income from salary brackets increasing in $10,000 increments. These ranged from ‘Less than $45,000’, followed by ‘$45,000-$54,999’, through to ‘$175,000-$184,999’ and finally ‘$185,000 or more’. Respondents were also given the option to select ‘Prefer not to say’. Table 4.4 shows these salary options rolled up into $30,000 groupings.
The average annual full-time salary in Australia, based on the ABS full-time weekly earnings in November 2021, was approximately $91,000 (ABS 2022b). While the options provided to respondents in the People matter survey do not allow analysis of salaries above or below $91,000 specifically, Table 4.4 demonstrates that CARM women were more likely than men (CARM and non-CARM) and non-CARM women to report a full-time equivalent salary of less than $95,000.
| Salary Range | CARM women | Non-CARM women | CARM men | Non-CARM men |
| Less than $65,000 | 23% | 23% | 13% | 10% |
| $65,00 – 94,999 | 37% | 32% | 35% | 27% |
| $95,000 –$124,000 | 21% | 23% | 26% | 29% |
| $125,000 –$154,999 | 4% | 5% | 8% | 12% |
| $155,000 –$184,999 | 1% | 2% | 4% | 5% |
| Over $185,000 | 1% | 2% | 4% | 6% |
| Prefer not to say | 6% | 10% | 5% | 9% |
| Unanswered | 7% | 4% | 5% | 3% |
Source: 2021 workplace gender audit data (People matter survey data) Notes: Total sample of 106,069 respondents.
Income disparity at the upper end of the pay scale shows the compounding impact of inequality on the basis of race and gender. CARM men reported lower incomes than non-CARM men, but still earnt more than women of all cultural backgrounds. Non-CARM men were almost 4 times as likely to report incomes over $125,000 when compared to CARM women.
Estimated pay gaps were generally largest between CARM women and non-CARM men.
As set out in Table 4.5, across 3 of the 4 industry groups with sufficient data and at the all-industries level, estimated pay gaps were largest between CARM women and non-CARM men. At the all-industry level, the pay gap between these two groups was 19%.
In the TAFE and other education sector, the gap between CARM women and non-CARM men was largest at 26%. The Local government industry had the smallest gap between these groups, at 8%. Notably, CARM women had a pay gap in their favour in the public healthcare industry, when compared to non-CARM women.
The pay gaps presented here are estimates. They were produced using a combination of salary bracket data from the People matter survey, outlined above, and the Commission’s workforce remuneration data. This is because the workforce data is not comprehensive enough to produce reliable pay gap calculations based on actual salaries. Please see the Introduction to this report for further detail on the approach taken.
| Industry | Local government | Public healthcare | TAFE and other education | Victorian Public Service | All industries |
| Non-CARM women vs non-CARM men | 8% | 21% | 11% | 9% | 13% |
| CARM women vs CARM men | 10% | 11% | 17% | 9% | 10% |
| CARM men vs non-CARM men | -2% | 0% | 11% | 9% | 11% |
| CARM women vs non-CARM women | 0% | -13% | 17% | 9% | 7% |
| Non-CARM women vs CARM men | 10% | 21% | 0% | 0% | 3% |
| CARM women vs non-CARM men | 8% | 11% | 26% | 17% | 19% |
Source: 2021 workplace gender audit data (People matter survey data) Notes: Total sample of 106,069 respondents.
Figure 4.2. Estimated pay gaps by comparator groups and industry.
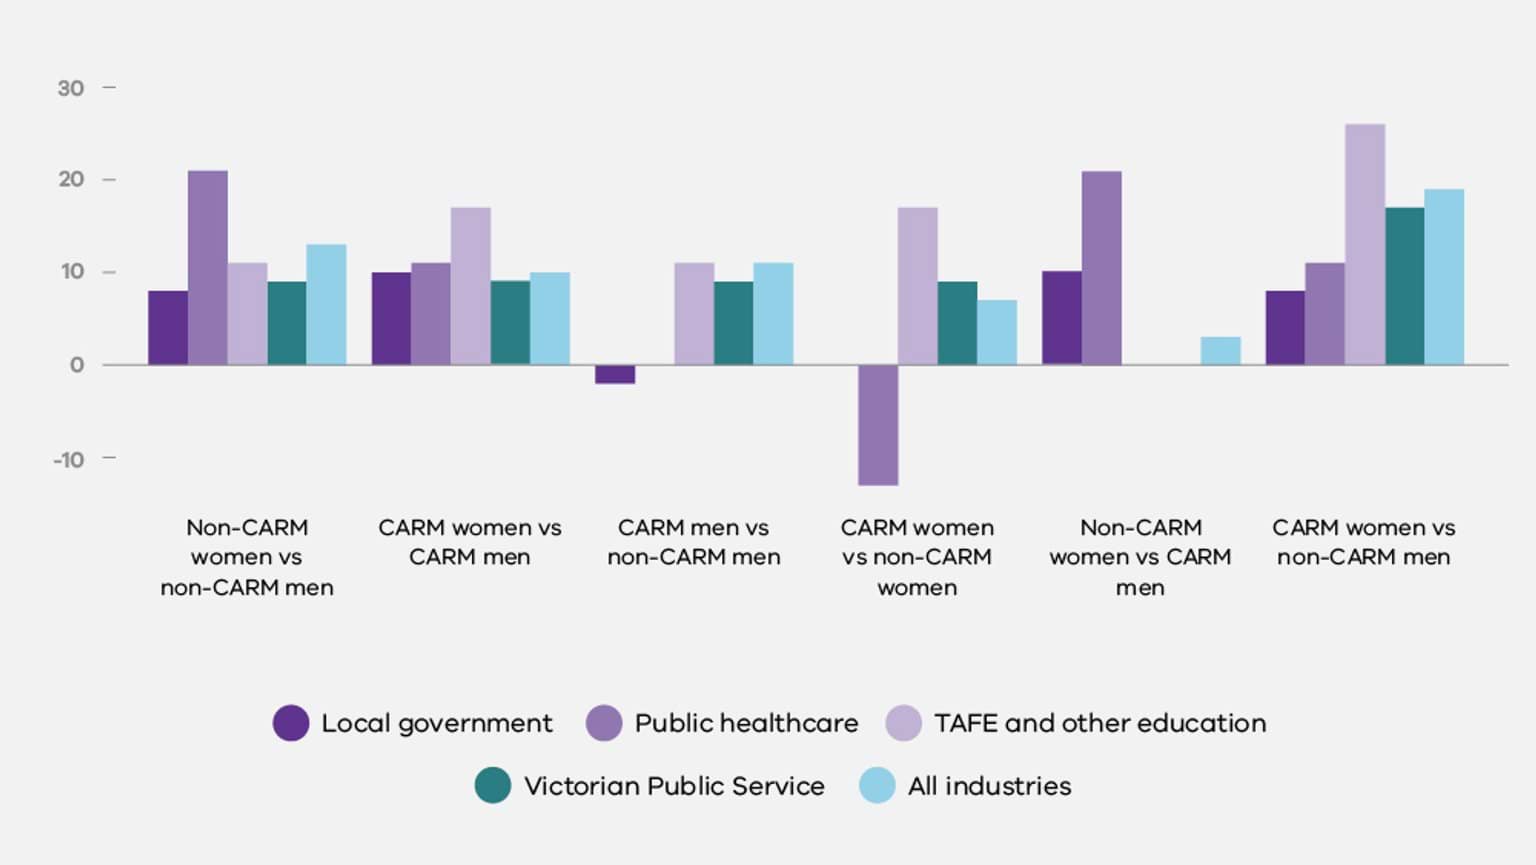
Workplace sexual harassment and discrimination
Both CARM women and men reported experiencing lower rates of sexual harassment compared to their non-CARM colleagues of the same gender.
As set out in Table 4.6 below, 7% of non-CARM women reported experiencing sexual harassment in the last 12 months, compared to 4% of CARM women and 4% of non-CARM men. CARM men were least likely to report the experience of sexual harassment (2%).
The People matter survey 2021 was conducted during the COVID-19 pandemic. This was when many people were working from home (except for essential workers, such as healthcare workers). This means that there might have been a potential decrease in certain types of sexual harassment between workers. However, it remains unclear how much the COVID-19 pandemic impacted these numbers.
| CARM status and gender | PMS Respondents reporting sexual harassment |
| CARM women | 4% |
| Non-CARM women | 7% |
| CARM Men | 2% |
| Non-CARM Men | 4% |
Source: 2021 workplace gender audit data (People matter survey data) Notes: Total sample of 106,069 respondents.
Regardless of gender and CARM status, the two most common types of sexual harassment reported were ‘Intrusive questions about my private life or comments about my physical appearance’ and ‘Sexually suggestive comments or jokes that made me feel offended’.
Reported rates of the experience of workplace discrimination were similar across CARM and non-CARM groups and genders.
CARM women were most likely to report experiencing discrimination in the last 12 months and non-CARM men were least likely to report experiencing discrimination. However, these differences were small. Table 4.7 shows these marginally different rates across the four groups.
| CARM status and gender | PMS Respondents reporting discrimination |
| CARM women | 6% |
| Non-CARM women | 5% |
| CARM Men | 5% |
| Non-CARM Men | 4% |
Source: 2021 workplace gender audit data (People matter survey data) Notes: Total sample of 106,069 respondents.
The most common type of discrimination reported by all four groups was being denied opportunities for promotion.
Recruitment and promotion practices
CARM people, regardless of gender, were more likely to agree that recruitment and promotion decisions in their organisations were fair.
As Table 4.8 shows, CARM men and women were more likely than non-CARM people to agree with the statement ‘My organisation makes fair recruitment and promotion decisions, based on merit’. CARM men had the highest level of agreement, at 68%.
| CARM status and gender | My organisation makes fair recruitment and promotion decisions, based on merit | |
| Strongly agree or agree | Strongly disagree or disagree | |
| CARM women | 67% | 10% |
| Non-CARM women | 54% | 17% |
| CARM Men | 68% | 10% |
| Non-CARM Men | 51% | 23% |
Source: 2021 workplace gender audit data (People matter survey data) Notes: Total sample of 106,069 respondents.
‘Neither agree nor disagree’ and ‘Don’t know’ response options are not included in the table.
CARM people reported feeling they had an equal chance at promotion at higher rates than their non-CARM colleagues.
As Table 4.9 shows, CARM women and men were more likely than their non-CARM peers to agree with the statement ‘I feel I have an equal chance at promotion in my organisation’. CARM men had the highest level of agreement, at 54%.
| CARM status and gender | I feel I have an equal chance at promotion in my organisation | |
| Strongly agree or agree | Strongly disagree or disagree | |
| CARM women | 51% | 18% |
| Non-CARM women | 46% | 25% |
| CARM Men | 54% | 18% |
| Non-CARM Men | 46% | 27% |
Source: 2021 workplace gender audit data (People matter survey data) Notes: Total sample of 106,069 respondents. ‘Neither agree nor disagree’ and ‘Don’t know’ response options are not included in the table.
Flexible work practices
Women were more likely than men to report flexible work, regardless of CARM status.
Both CARM women and non-CARM women reported flexible work arrangements at the same rate, which was higher than that of both CARM men and non-CARM men. Table 4.10 highlights the proportion of respondents in each group who reported accessing flexible work opportunities.
| CARM status and gender | PMS Respondents reporting flexible work |
| CARM women | 31% |
| Non-CARM women | 31% |
| CARM men | 23% |
| Non-CARM men | 23% |
Source: 2021 workplace gender audit data (People matter survey data) Notes: Total sample of 106,069 respondents.
Women, regardless of CARM status, most often reported using flexible start and finish times. CARM men also reported using flexible start and finish times most often, while non-CARM men most often reported working part-time.
Discussion and conclusion
This chapter demonstrates how gender and race-based inequalities combine to create systemic challenges for culturally and racially marginalised women in public sector workplaces. Much research has found that CARM women face a range of systemic barriers to career progression. These findings are consistent with the Commission’s data analysis which shows that CARM women are less likely to report holding management roles and are more likely to indicate lower salaries – this is despite the finding that both CARM women and men reported higher agreement compared to their non-CARM colleagues that recruitment and promotion in their organisations is fair and that they have an equal chance at promotion in their organisations.
The Commission’s workplace gender audit data and its funded research project by Cho and Segrave demonstrate the importance of improved data collection about people of different genders from CARM backgrounds. Data is required to better understand how discrimination on the basis of cultural background and gender combine to produce unique barriers to workplace equality for particular groups. The lack of workforce data on cultural identity, and thus the need to rely on survey data that is not linked to employee records, meant that this analysis was unable to explore the access to training and other professional development and promotional opportunities, as well as occupational and industrial segregation of CARM people in Victorian public sector organisations. The Commission also had to estimate pay gaps rather than being able to rely on precise salary data.
Discrimination in recruitment and retention processes is a particular area requiring focussed attention from organisations (Cho and Segrave 2023). Cho and Segrave report that migrant and refugee women found that their proficiency in English was often misjudged, and they were frequently overlooked unless they used an English-sounding name (Cho and Segrave 2023). These findings reflect existing evidence that in order to progress their careers, CARM women feel pressure to assimilate to dominant workplace cultures that reflect a Western ideal, minimising their own experiences and identity (DCA 2023; Khadem 2023). Biases around recruitment can also flow through to retention, with CARM women experiencing a lack of trust in their professional abilities from managers and organisations (Cho and Segrave 2023; Gyimah et al. 2022).
Moving towards more meaningful diversity and inclusion practices that centre the voices of CARM women and address conscious and unconscious cultural and racial biases can support organisations to improve equality for CARM women. These goals can begin to be achieved through focussing on redressing inequalities in access to training and development opportunities, and paying attention to the role of managers in supporting career progression and ensuring promotion pathways are transparent (Cho and Segrave 2023; Gyimah et al. 2022. Ensuring that CARM women are able to meaningfully participate in diversity and inclusion initiatives, for example as members of relevant committees, can help tackle the root causes that hinder CARM women’s equal participation in the workplace (Cho and Segrave 2023). Involving CARM women, and other diverse people, in these processes can also help ensure that impacted groups have faith in equality programs and do not see them as a tick-box exercise (Cho and Segrave 2023).
Ensuring increased representation of CARM women in leadership will also foster a more inclusive environment – one where CARM women feel more comfortable voicing their concerns. Research has found that reduced feelings of trust and safety in their organisations, particularly where this representation was absent, contributed to CARM women feeling too uncomfortable to report experiences of sexual harassment in the workplace (Cho and Segrave 2023; Respect@Work n.d.).
Research funded by the Commission in its Inaugural Research Grants Round in 2021 identified key whole-of-organisation approaches to achieving gender equality for culturally diverse women. Importantly, the researchers found that organisations must take a holistic approach to change across multiple scales, including systemic, organisational and individual change (Pillay et al. 2022). To ensure accountability for progress, organisations should set metrics and targets, ensuring leaders are responsible for achieving these goals (Pillay et al. 2022). Reviewing policies to ensure they are free from discrimination is vital to remove systemic forms of discrimination embedded in processes and established ways of doing things (Pillay et al. 2022). Lastly, visible leaders who lead change through active advocacy and sponsorship for CARM women are central to ensuring an inclusive workplace is established from the top (Pillay et al. 2022).
Further research is needed to continue to unpack the ways in which specific aspects of disadvantage and discrimination against CARM people intersect with gender-based discrimination to produce unique experiences of inequality. Importantly, there is also more data and research needed to better understand how people of self-described gender from CARM backgrounds experience public sector workplaces.
- The background material in this chapter addresses race, culture, and religion together. This is because racist attitudes and structures use characteristics such as culture, religion, language, and nationality to perpetuate discrimination against CARM people (Ben et. al. 2022, p. 2). The Commission acknowledges the huge amount of diversity both between and within these categories which cannot be covered appropriately here. The Commission is unable to report on religion in this chapter due to challenges related to analysing the small amount of data available.
- It is important to note that this figure includes white, Western and privileged migrants, such as many of those coming from the United Kingdom (Carangio et al. 2021), and does not account for the huge wealth of cultural diversity within Australia in established families and communities who may have been here for more than two generations.
- Research and data about workplace discrimination against CARM people, particularly in public sector contexts, has a strong focus on the experiences of migrants and people who speak a language other than English with their family or community (e.g. Oppare-Addo & Bertone 2020; VPSC 2023c). This is partly based on the data available, which often relies on information about country of birth and languages spoken, and partly because migrant people frequently face acute forms of disadvantage and discrimination. This report takes a broader definition of CARM to encompass cultural diversity beyond migrant and refugee people, but the Commission acknowledges that there remains a strong focus on migrant experiences in this chapter, which may not be the dominant experience for CARM people within the Victorian public sector.
Chapter 5: Gender and LGBTIQ+ Employees
This chapter looks at intersectional data and insights in relation to gender and LGBTIQ+ identity
This chapter discusses the experiences of LGBTIQ+ women, men and gender diverse people. The acronym LGBTIQ+ was chosen because it reflects the title of the Victorian Commissioner for LGBTIQ+ Communities, a role that advocates for the rights and safety of people with diverse genders and sexualities (Victorian Government 2021), as well as Pride in our future: Victoria’s LGBTIQ+ strategy 2022-32 (Victorian Government 2022a). In this report, the Commission uses the terms LGBTIQ+ to discuss people with sexualities that are not heterosexual and/or a gender identity that is not cisgendered.1 Use of the terms ‘women’ and ‘men’ includes transgender women and transgender men. In addition, these terms also include gender-diverse individuals who are perceived as either women or men, as they may experience disadvantage and discrimination on the basis of their perceived gender. The language used in this report is not intended to minimise or lessen any aspect of a person’s identity. The Commission acknowledges the significant diversity and variety of terminology that exists within the LGBTIQ+ community.
Within the LGBTIQ+ community there are a wide variety of sexual orientations and gender identities. The LGBTIQ+ acronym is an evolving term which stands for lesbian, gay, bisexual, transgender, intersex, queer, and more (Victorian Government 2021). These identities are not mutually exclusive, and there are a range of other terms (such as pansexual, asexual and non-binary) that people use to describe their gender and sexuality (e.g., Department of Health 2023). People who appear to be LBGTIQ+ may or may not identify as such, and people within this community may not wish, or feel safe, to disclose this information to others (Lyons et al. 2021). This, combined with inadequate reporting mechanisms, makes it hard to gauge accurate numbers of LGBTIQ+ people (Carman et al. 2020). Despite these limitations, in 2020, 3-4% of the Australian population reported identifying as lesbian, gay, or bisexual – with 19% of women and 9% of men having ‘reported same gender attraction and behaviour’ (Carman et al. 2020:3). Internationally, it is estimated that 1% of the population identify as transgender, and 1.7% of people are born with intersex characteristics (Carman et al. 2020:3).
LGBTIQ+ people face inequalities because societies and individuals assume that heterosexual and cisgendered is the standard. These assumptions are reinforced and normalised through policies, cultures and interactions which discriminate against members of the LGBTIQ+ community and perpetuate unequal structures (Beagan et al. 2022; McFadden and Crowley-Henry 2018). In Victoria, homosexuality was a criminal offence until 1980 (Victorian Government 2020). However, criminal convictions related to homosexuality were only expunged 34 years later, in 2014 (Victorian Government 2020). In 2016, Victorian Premier Daniel Andrews “delivered an historic apology for gay convictions in Parliament,” (Victorian Government 2020) and it wasn’t until late 2017 that the right to marry was extended to homosexual couples (Australian Government n.d.).
Key workplace issues for LGBTIQ+ people
High levels of workplace discrimination, exclusion and harassment
According to the Australian Workplace Equality Index’s 2022 survey, 26.7% of respondents have witnessed negative behaviours towards people of diverse sexualities or genders at work, and 10.9% have witnessed serious bullying (AWEI 2022a:9). This mirrors international research, with a 2022 survey of 5,474 LGBTIQ+ people globally finding that 40% experienced non-inclusive behaviours at work (Deloitte 2022:18). Concerningly, 39% of these respondents reported sexual harassment across both remote and office working environments (Deloitte 2022:18). The risk of harassment and abuse is even greater for LGBTIQ+ individuals who belong to more than one minority group (AWEI 2022b; AWEI 2022c; AWEI 2022d; AWEI 2022e; TUC 2019).
Prejudice in the form of homophobia, transphobia, tokenism, stereotyping and being misunderstood are often the root causes of negative behaviours towards LGBTIQ+ people (State of Queensland 2017; DCA and Pride in Diversity 2022; Waite 2021). Like other forms of harassment and discrimination in workplace settings, homophobic or transphobic behaviour can be subtle, meaning victims feel they cannot formally report this (McFadden and Crowley-Henry 2018). Consequently, LGBTIQ+ people often feel unsafe at work and experience higher levels of psychological distress compared to their non-LGBTIQ+ counterparts (Deloitte 2022; Amos et al. 2023). This can impact the workforce participation and career progression of LGBTIQ+ people (WGEA 2023; Ellsworth et al. 2020).
Lack of safety to be themselves in workplace settings
The Australian Workplace Equality Index in 2022 reported that despite workplace inclusion initiatives, there has been a downward trend over the past three years of LGBTIQ+ employees disclosing their identities at work (AWEI 2022f:4). There are many reasons that people choose not to disclose their sexual or gender identity. These include fears of bias hindering career opportunities, interpersonal relationships changing, isolation, and subtle or overt discrimination (McFadden and Crowley-Henry 2018). For most LGBTIQ+ people, ‘coming out’ is an ongoing process with introductions to new workplaces, co-workers, and stakeholders. Never being certain how these conversations will go, and the continuous nature of this process, leads to ongoing stress (McFadden and Crowley-Henry 2018). However, hiding these aspects of one’s identity at work can be emotionally and psychologically exhausting (Minei et al. 2023; McFadden and Crowley-Henry 2018; State of Queensland 2017). A large number of LGBTIQ+ people in Australia expend significant energy to hide their identity, detracting from their ability to participate at work (State of Queensland 2017). Barriers are also exacerbated for LGBTIQ+ people who identify as trans or gender diverse (DCA 2018), are a person of colour (DCA and Pride in Diversity 2022), are First Nations peoples (AWEI 2022d) or are of older age (Cray 2013).
Barriers to career development and progression
Research suggests that LGBTIQ+ people are less likely to receive career development opportunities and experience barriers to progression, promotion and accessing leadership opportunities in the workplace (Webster and Adams 2023; Gedro 2009). Associations between leadership and men/masculinity also disadvantage some LGBTIQ+ people, who regardless of gender identity and sexual orientation may not conform to stereotypical understandings of masculinity (Pellegrini et al. 2020). These barriers have flow-on effects across a broad range of measures, including representation, pay equity, discrimination, and occupational segregation (Gedro 2009).
Trans, gender-diverse and intersex people face additional barriers to inclusion
While all LGBTIQ+ individuals can face inclusion challenges in the workplace, trans and gender-diverse people are especially likely to experience barriers at every stage of the employment process (Waite 2021). In 2018, the unemployment rate of trans people was 3 times that of the general population in Australia (Bretherton et al. 2021:47), a trend that is mirrored in international research (NCTE 2016:5). When they do have access to paid employment, trans and gender-diverse people are more likely to be in entry-level positions, miss out on career progression opportunities and experience social exclusion (Ellsworth et al. 2022; DET 2023). Trans and gender-diverse individuals, as well as intersex people, are also more likely to be misgendered in the workplace and encounter false assumptions about their gender, bodies, and sexuality (Ellsworth et al. 2022). This can result in privacy breaches, where a trans, gender-diverse or intersex employee’s personal information is shared with their colleagues without consent (Ellsworth et al. 2022). Privacy breaches such as these can have detrimental effects on LGBTIQ+ people’s physical and psychological safety.
Trans, gender-diverse and intersex people are more likely to experience negative behaviours at work
Trans and gender-diverse people are more likely to experience and witness negative behaviours than their other LGBTIQ+ colleagues (AHRC 2022c; Amos et al. 2023). These behaviours include discrimination, bullying and harassment, which can affect their ability to participate in the workforce (AWEI 2022b). In the last 5 years, 70% of people with intersex characteristics experienced workplace sexual harassment in Australia – the highest rate of any population examined in the Australian Human Rights Commission’s 2022 national survey (AHRC 2022c:12). Trans and gender-diverse people are more than twice as likely as cisgender people to hear sexist jokes or demeaning comments about themselves and people in their community (AWEI 2022b:7; see also Ellsworth et al. 2022). For those that formally report this harassment, only 16.2% feel that it is dealt with satisfactorily (AWEI 2022b:7). As a result of these negative behaviours in the workplace, trans and gender-diverse people are more likely to think about leaving their current employer, compared to cisgender people (AWEI 2022b).
Key workplace issues for LGBTIQ+ women
Compounding barriers to progression and promotion
LGBTIQ+ women are more likely to experience workplace disadvantage when compared to straight women and LGBTIQ+ men, or those perceived as men. LGBTIQ+ women experience a ‘double glass ceiling’ – the compounding impacts of being perceived as a woman and LGBTIQ+ – when trying to access career progression opportunities at work (ACON n.d.; AWEI 2022e; PwC and Pride in Diversity 2018). This can be seen in the Australian context, as the Australian Workplace Equality Index Survey demonstrated that only 4% of LGBTIQ+ women (both cisgender and transgender) and gender diverse respondents were in senior leadership roles or above in 2022 (AWEI 2022e:3). LGBTIQ+ women are also more likely to report that they have missed out on a raise or promotion due to their gender and sexual orientation when compared to their straight and cisgendered counterparts (AWEI 2022e; Ellsworth et al. 2022).
Unstable employment
LGBTIQ+ women are overrepresented in part-time, temporary or contract roles (AWEI 2022e:3). This overrepresentation is a contributing factor to the gender pay gap (AWEI 2022e:3). LGBTIQ+ women who are out at work feel as though they need to evidence their competence more frequently than LGBTIQ+ men and their straight colleagues (Ellsworth et al. 2022).
High levels of discrimination and sexual harassment
In 2022, nearly half of all LGBTIQ+ women experienced sexual harassment at work, a much higher rate than LGBTIQ+ men (AWEI 2022e:6; see also TUC 2019:13-17). Moreover, instances of sexual harassment towards LGBTIQ+ women are more likely to occur on a regular basis rather than as a single incident (AWEI 2022e:6). Safe and inclusive workplaces for LGBTIQ+ women that are free from discrimination and harassment support their improved workforce participation. Research from the US indicates that LGBTIQ+ women who are safe and out at work are half as likely to leave their employer and are a third more likely to plan to stay for 5 years or more (Ellsworth et al. 2022).
Victoria’s LGBTIQ+ strategy 2022-32
In 2022, the Department of Families, Fairness and Housing, the Minister for Equality and the Commissioner for LGBTIQ+ Communities published Victoria’s first whole-of-government LGBTIQ+ strategy, Pride in our Future: Victoria’s LGBTIQ+ strategy 2022-32 (the strategy). The strategy provides the vision and plan to drive gender equality and inclusion for Victoria’s diverse lesbian, gay, bisexual, trans and gender diverse, intersex and queer (LGBTIQ+) communities, within all aspects of government work over the next decade.
The vision of the strategy is that all Victorians feel safe, are healthy, have equal human rights and can live wholly and freely.
The strategy identifies 4 priority areas (outlined below), alongside action items and desired outcomes to drive equality and inclusion for Victoria’s LGBTIQ+ communities throughout all government processes and initiatives.
To acknowledge and better support the many LGBTIQ+ community members living with compounding forms of inequality, the strategy takes an intersectional approach. The development of the strategy was informed by consultations over 1600 LGBTIQ+ Victorians. Further details of the strategy can be found on the Victorian Government website.
Key priority areas in the strategy
Equal rights and freedoms
The strategy commits to creating, reviewing, and reforming laws with an equity lens. It aims to strengthen legal protections for LGBTIQ+ Victorians and reduce the harm caused by the disproportionate levels of discrimination experienced by LGBTIQ+ people. Several key actions have been undertaken to advance this goal, such as establishing a specialist legal service for LGBTIQ+ Victorians, developing and delivering the LGBTIQ+ Justice Action Plan, implementing the Equal Opportunity (Religious Exceptions) Amendment Act 2021, the Change or Suppression (Conversion) Practices Prohibition Act 2021 and commencing the Summary Offences Amendment (Nazi Symbol Prohibition) Act 2022 making it an offence to publicly display the Nazi Hakenkreuz.
Equitable, inclusive, and accessible services
To ensure all governmental decision makers and service providers recognise the needs of LGBTIQ+ community members, key actions have been identified that will improve the health and wellbeing of queer people. Progress against this goal includes delivery state-wide to help organisations to embed LGBTIQ+ inclusive practices within their workplace and services, establishing a Trans and Gender Diverse Peer Support Program and rolling out safe spaces for LGBTIQ+ young people in Western Victoria. Further work will be done over the life of the strategy to improve LGBTIQ+ specialist services, enable people with intersex variations to access the care and support they require, ensure relationship, sexuality and consent education is LGBTIQ+ inclusive, and improve public fertility care access for LGBTIQ+ families.
Visibility to inform decision making
The strategy highlights ways to improve data collection about the lives and experiences of LGBTIQ+ Victorians, and to ensure data-collection processes are inclusive. For example, improving and standardising how, and for what purpose, government departments collect personal demographic data from their employees. The focus of this work will be to define a set of consistent whole-of-Victorian Public Service collection standards and indicators that government uses in its workforce data standards reporting. The standards will be underpinned by clear and consistent approaches to why data is collected, what it is used for and how it is shared.
Through this initiative, it is expected there will be an increase in the number of organisations using inclusive data collection methods. In turn, this should amplify LGBTIQ+ voices so that their experiences can be heard by government. Key actions to achieve this goal include supporting LGBTIQ+ data and research, improving Victorian Government data standards, developing guidance materials on how to collect, analyse and report on data by government and government-funded services and increasing diverse LGBTIQ+ representation on Victorian Government boards.
Safe, strong and sustainable communities
This priority area aims to increase LGBTIQ+ people’s feeling of their value in society, which is currently at 41.4%. For LGBTIQ+ people, being a part of the community is a valued and positive part of life. It leads to better physical and mental health outcomes.
This priority area aims to build whole-of-community understanding and celebration of LGBTIQ+ people to prevent discrimination, stigma and abuse. Reducing discrimination leads to better health and wellbeing outcomes. This creates a stronger and more cohesive society where everyone experiences economic security, feels valued, is safe in public places and can enjoy participating in social and community activities, like sports and the arts. Several key actions have been outlined to achieve this, including delivering state-wide LGBTIQ+ awareness raising, as well as events and festivals that celebrate LGBTIQ+ communities, promoting self-sufficiency for the sector and reviewing and improving LGBTIQ+ inclusion in government policies, programs, and services.
CGEPS audit data: Key insights
This section reports on insights from the Commission’s 2021 workplace gender audit workforce data and the 2021 People matter survey (PMS). Workforce data is data drawn from organisations’ human resources and payroll systems. The People matter survey is an anonymous survey completed by approximately 90% of organisations with reporting obligations under the Gender Equality Act 2020 (Vic) (the Act).
LGBTIQ+ employees in the 2021 workplace gender audit
Few organisations were able to provide data regarding the sexual orientation of their employees, or employees with self-described genders.
Only 6% of defined entities included any data related to sexual orientation in their workforce reporting. Across all organisations with reporting obligations in the 2021 workplace gender audit, only 0.5% of employees had a recorded sexual orientation. The remaining 99.5% of employees covered by the 2021 workforce data either had no sexual orientation recorded or worked for organisations that did not collect and store information about LGBTIQ+ identities through their workforce systems.
Figure 5.1. Availability of sexual orientation information in the workforce data, workplace gender audit 2021
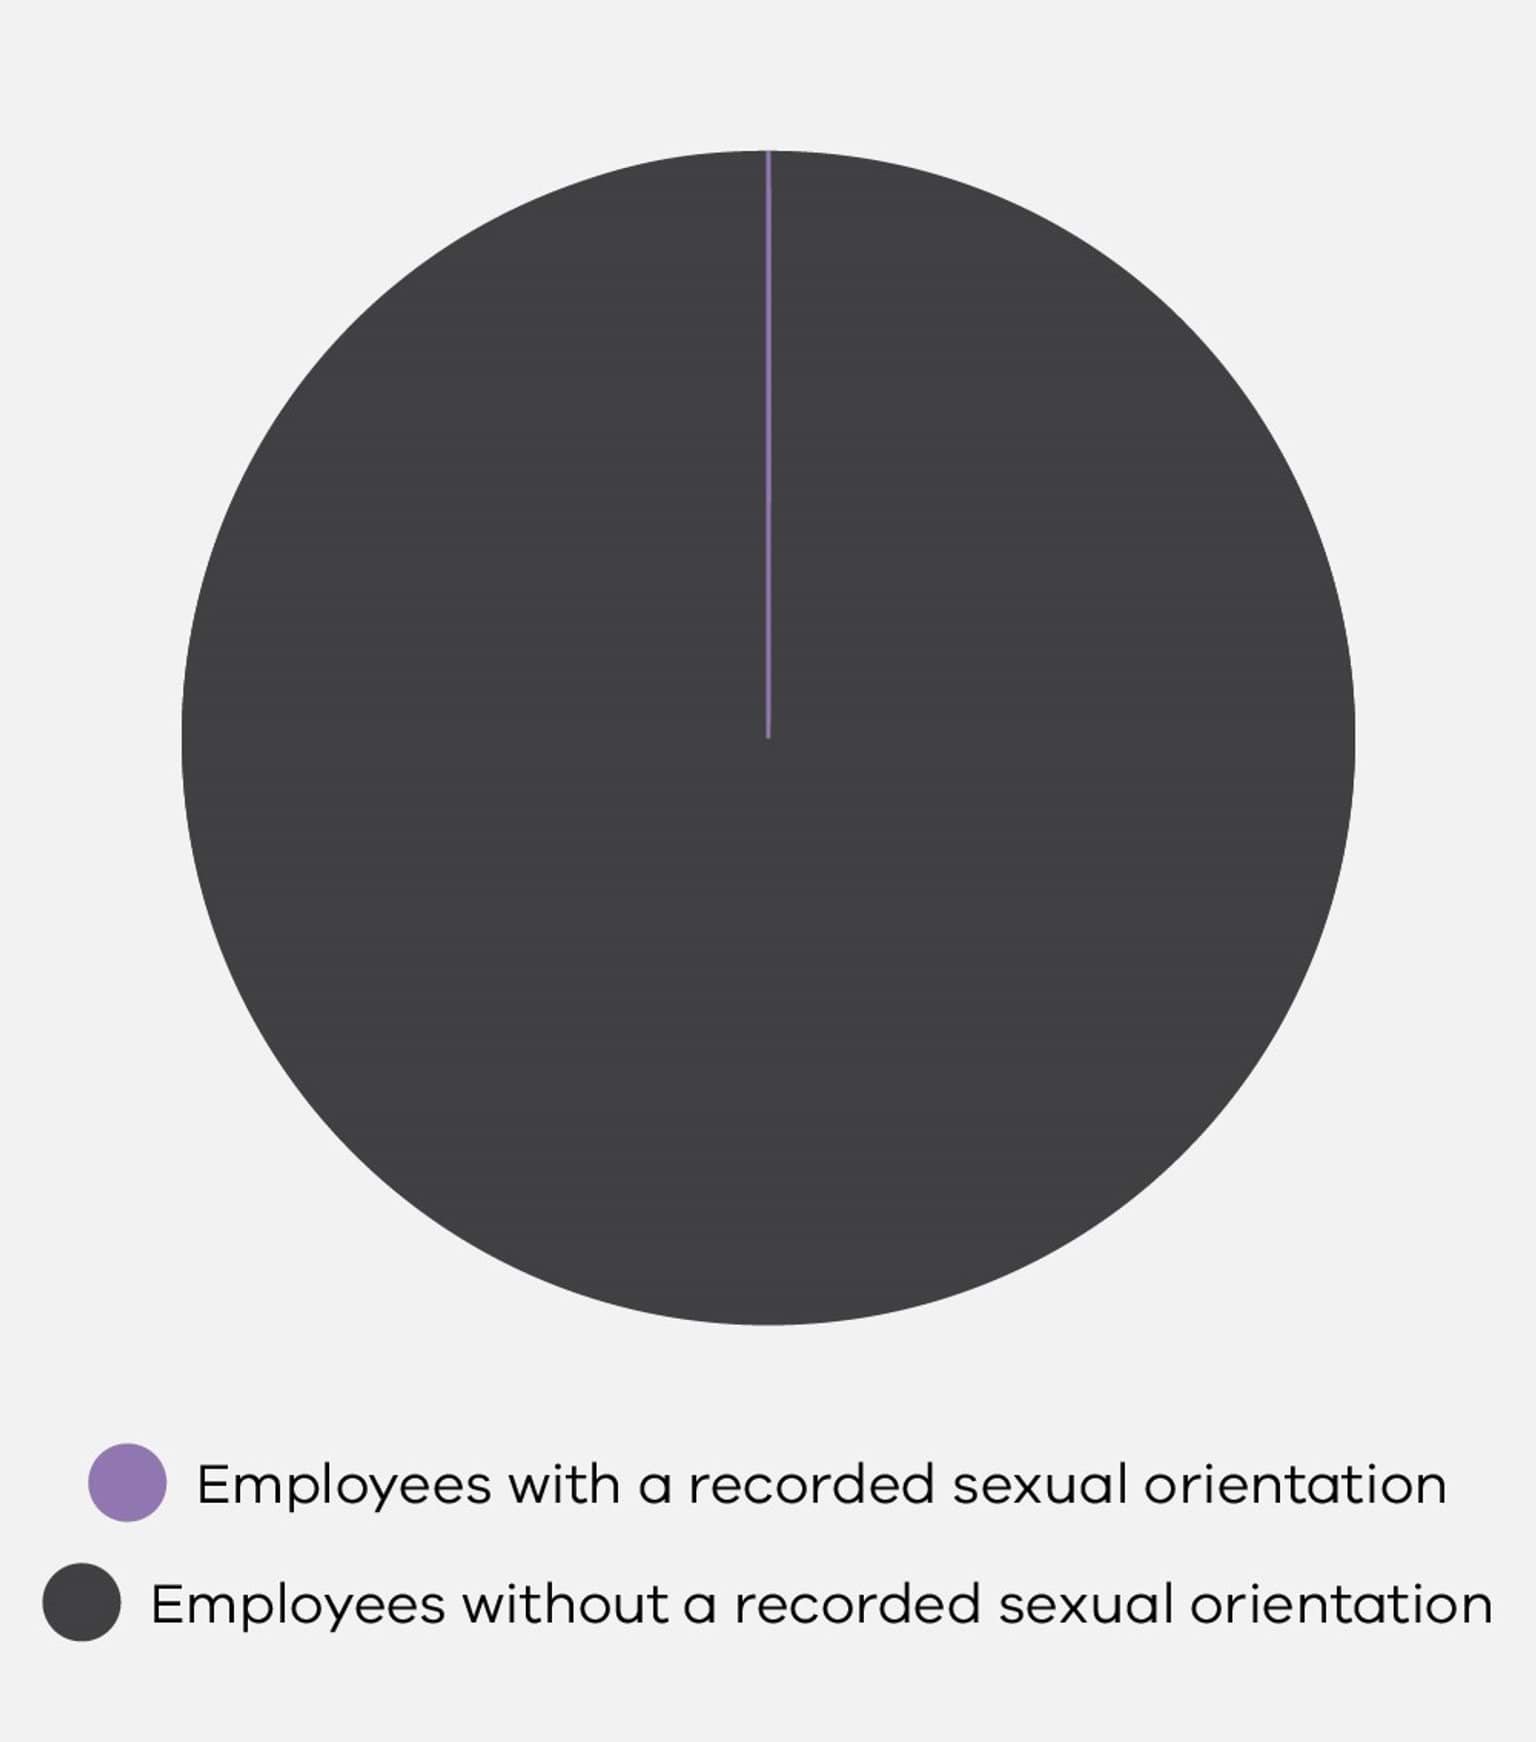
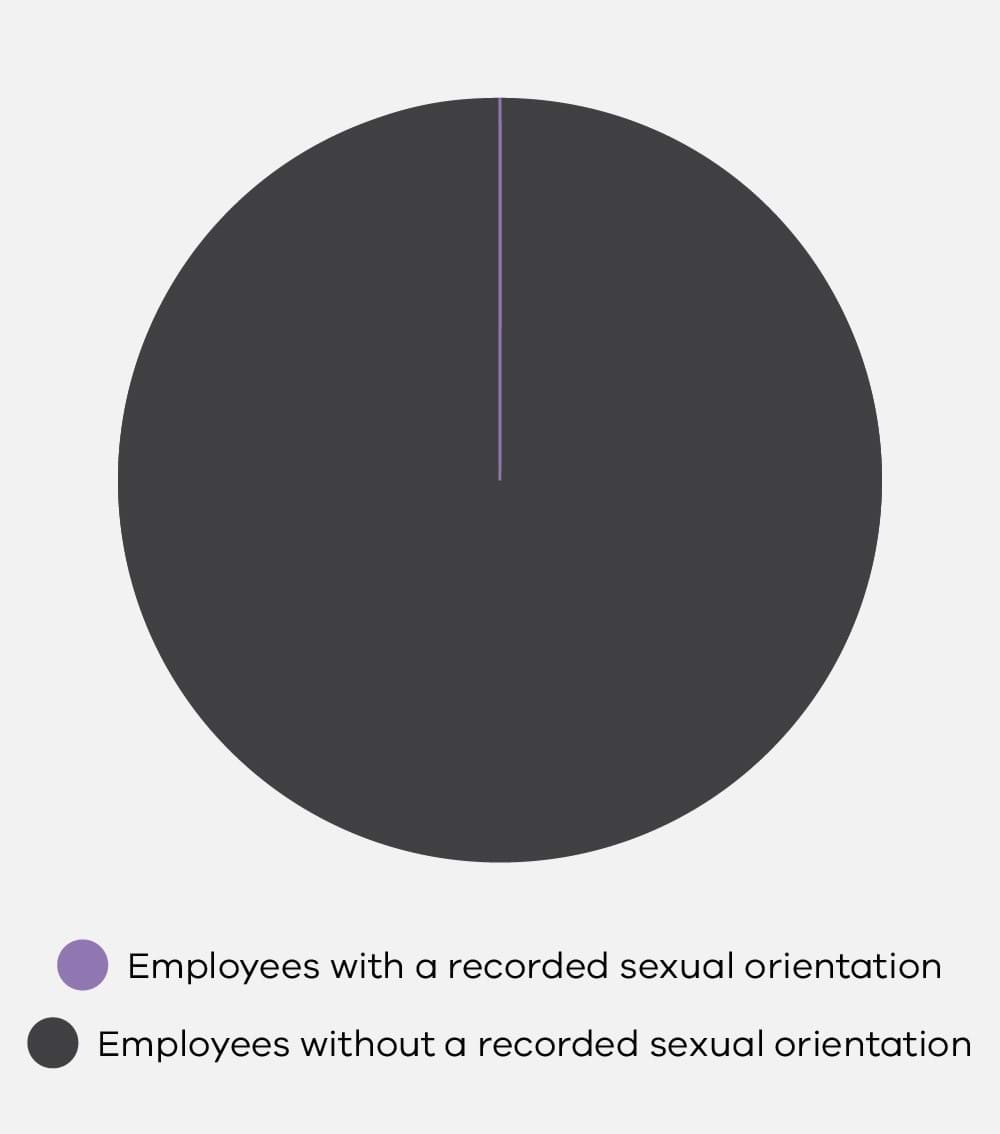
Only 0.1% of employees were reported as having self-described gender. Gender identities outside the binary are likely to be underreported due to a combination of workforce systems failing to offer gender options beyond women and men, as well as individuals not feeling safe to disclose their self-described gender to their employer (VPSC 2023d).
This lack of workforce data makes it very difficult to draw reliable conclusions. As a result, the remainder of the analysis presented in this section is derived from the 2021 People matter survey (PMS) data.
Figure 5.2. Proportion of employees who were reported as being of self-described gender
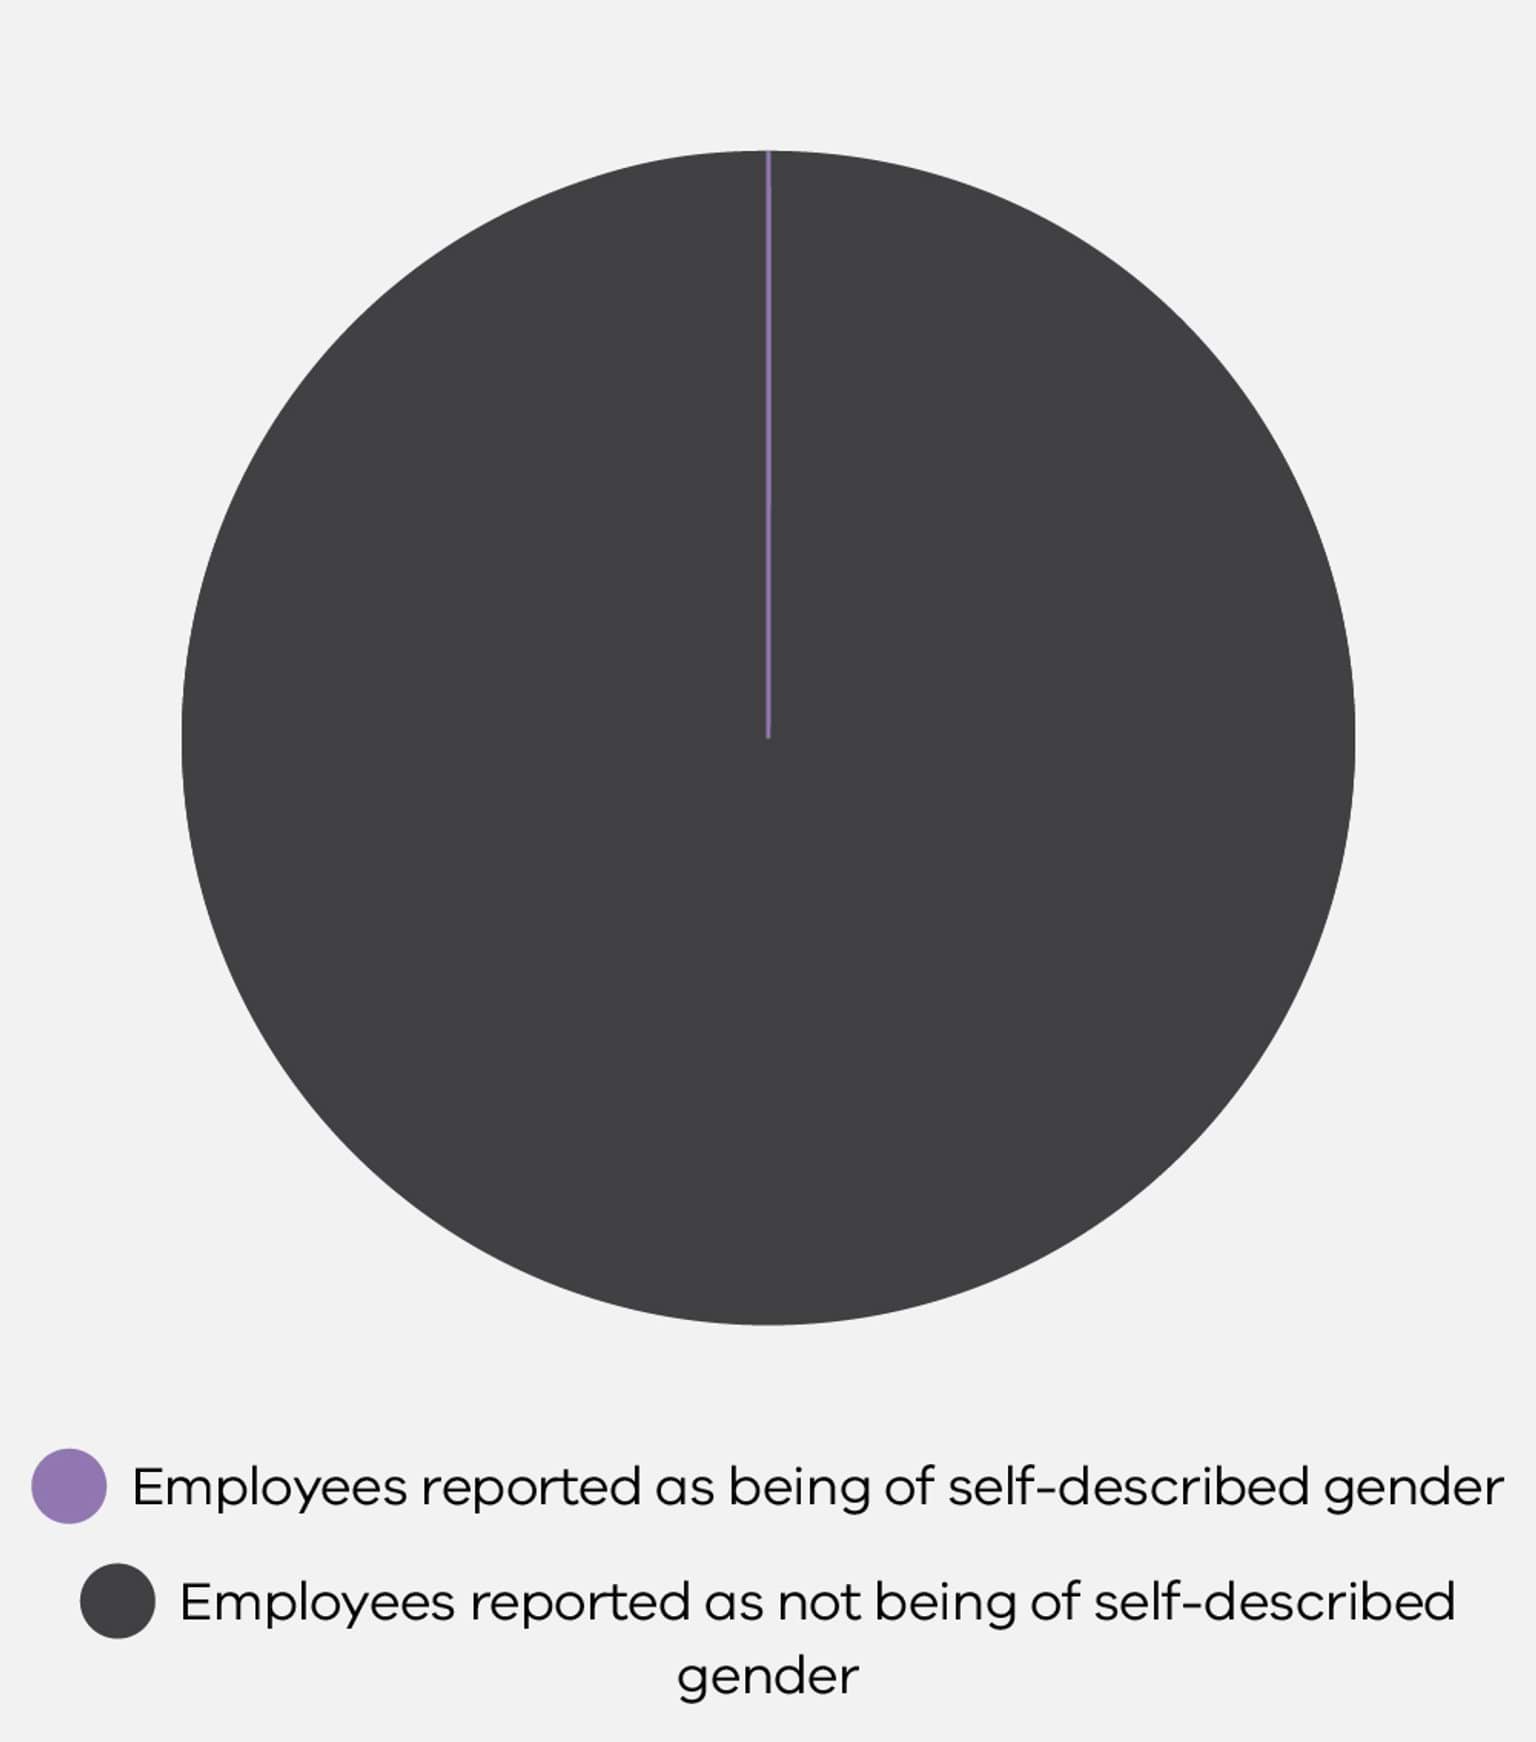
Respondents to the People matter survey reported being LGBTIQ+ at higher rates than the general population.
As illustrated in Table 5.1, 6.4% of respondents identified as asexual, bisexual, gay, lesbian, or pansexual. This figure is 1.2% higher than the level reported in the 2017 Victorian Population Health Survey. Respondents reported being trans and gender diverse at more than three times the rate of the Victorian population, though still constituted a very small percentage of the workforce at 0.64%.
| LGBTIQ+ group | PMS Respondents | Victorian population (2017) |
| Asexual | 0.4% | 0.4% |
| Bisexual or pansexual | 3% | 3% |
| Gay or lesbian | 3% | 1.8% |
| Trans, non-binary or gender diverse | 0.64% | 0.2% |
Source: 2021 workplace gender audit data (People matter survey data) Notes: Total sample of 106,069 respondents.
While the survey data was larger than the workforce data, the low number of respondents identifying as LGBTIQ+ meant that responses were too low to generate reliable results in some analyses. This was particularly the case for analyses involving transgender men. The data below includes some figures that have a wide confidence interval, meaning due to the small amount of data available, it is only possible to confidently determine a large range that they fall within. This means that sometimes percentages within a table may be closer to each other than they appear. These numbers are indicated with an asterisk (*).
Gender composition at all levels of the workforce
Lesbian women held managerial positions at similar rates to both straight men and gay men.
As Table 5.2 shows, lesbian women were equally likely to hold positions as senior managers (overseeing lower-level managers) and supervisors (managing employees who are not managers themselves) compared to both straight men and gay men.
| Sexual orientation and gender | PMS Respondents reporting senior manager roles | PMS Respondents reporting supervisor roles |
| Asexual women | 4% | 11% |
| Bisexual and pansexual women | 5% | 12% |
| Lesbian women | 12% | 17% |
| Straight women | 4% | 11% |
| Asexual men | 4%* | 8%* |
| Bisexual and pansexual men | 9% | 17% |
| Gay men | 13% | 17% |
| Straight men | 13% | 20% |
Source: 2021 workplace gender audit data (People matter survey data) Notes: Total sample of 106,069 respondents.
While lesbian women reported holding managerial positions at similar rates to straight and gay men, bisexual, pansexual and asexual women reported lower rates of both senior manager and supervisor roles, in line with straight women. Research suggests that lesbian couples more equally distribute household labour, which may contribute to their ability to develop their careers in the paid workforce (Brewster 2017). However, further research is required to fully understand the differences in rates of management roles.
Transgender women, transgender men, gender-diverse people and cisgender women were underrepresented in managerial roles, but this underrepresentation was greater for transgender women. As Table 5.3 shows, cisgender men were far more likely to hold positions as senior managers (overseeing lower-level managers) and supervisors (managing employees who are not managers themselves) than other gender identities.
| Gender identity | PMS Respondents reporting senior manager roles | PMS Respondents reporting supervisor roles |
| Transgender women | 4%* | 10% |
| Transgender men | 7%* | 13%* |
| Other trans, non-binary or gender diverse | 5% | 14% |
| Cisgender women | 7% | 15% |
| Cisgender men | 13% | 20% |
Source: 2021 workplace gender audit data (People matter survey data) Notes: Total sample of 106,069 respondents.
Lesbian women were slightly less likely to work part time than straight women, while transgender women were equally likely to work part time as cis-gendered women.
As Table 5.4 shows, 27% of lesbian women reported working part time. This is much lower than straight women, at 45%. However, lesbian women were more than twice as likely than straight men, and much more likely than gay men, to work part time.
Bisexual, pansexual, and asexual women had similar part-time work rates to straight women, while men identifying as gay, bisexual, pansexual, and asexual were more likely to work part-time (16%) compared to straight men (12%).
| Sexual orientation and gender | PMS Respondents reporting part-time employment |
| Asexual women | 38% |
| Bisexual and pansexual women | 38% |
| Lesbian women | 27% |
| Straight women | 45% |
| Asexual men | 21%* |
| Bisexual and pansexual men | 16% |
| Gay men | 16% |
| Straight men | 12% |
Source: 2021 workplace gender audit data (People matter survey data) Notes: Total sample of 106,069 respondents.
Table 5.5 shows that transgender women reported working part time at almost the same rate as cisgender women. Non-binary people and transgender men were also more likely to work part time compared to cisgender men, but less likely than cisgender women.
| Gender identity | PMS Respondents reporting part-time employment |
| Transgender women | 45% |
| Transgender men | 19% |
| Other trans, non-binary or gender diverse | 30% |
| Cisgender women | 44% |
| Cisgender men | 12% |
Source: 2021 workplace gender audit data (People matter survey data) Notes: Total sample of 106,069 respondents.
Gender pay equity
Women across different sexuality groups were more likely to be overrepresented in lower income brackets and underrepresented in higher income brackets than men, regardless of sexuality.
The only exception to this trend was lesbian women, who on average had higher salaries than bisexual and pansexual men. Respondents to the People matter survey 2021, from which this data is drawn, were able to select their yearly income from salary brackets increasing in $10,000 increments. These ranged from ‘Less than $45,000’, followed by ‘$45,000-$54,999’, through to ‘$175,000-$184,999’ and finally ‘$185,000 or more’. Respondents were also given the option to select ‘Prefer not to say’. Table 5.6 shows these salary options rolled up into $30,000 groupings.
The average annual full-time salary in Australia, based on the ABS full-time weekly earnings in November 2021, was approximately $91,000 (ABS 2022b). While the options provided to respondents in the People matter survey do not allow analysis of salaries above or below $91,000 specifically, Table 5.6 shows that women of all sexual orientations were more likely than straight and gay men to report a full-time equivalent salary of less than $95,000. Bisexual and pansexual women (60%) and asexual men (61%) had the highest rates of salaries under $95,000 of any group in the table.
| Salary Range | Asexual women | Bisexual or pansexual women | Lesbian women | Straight women | Asexual men | Bisexual or pansexual men | Gay men | Straight men |
| Less than $65,000 | 24%* | 23% | 12% | 23% | 15%* | 16% | 9% | 10% |
| $65,000 – 94,999 | 40%* | 37% | 33% | 32% | 46%* | 31% | 32% | 28% |
| $95,000 –$124,000 | 23%* | 22% | 29% | 22% | 25%* | 30% | 32% | 28% |
| $125,000 –$154,999 | 4%* | 4% | 8% | 5% | 4%* | 9% | 10% | 11% |
| $155,000 –$184,999 | 2%* | 2% | 4% | 2% | 0%* | 3% | 5% | 5% |
| Over $185,000 | 0%* | 1% | 5% | 2% | 2%* | 3% | 5% | 6% |
| Prefer not to say | 5%* | 5% | 6% | 10% | 6%* | 5% | 4% | 9% |
| Unanswered | 3%* | 7% | 4% | 5% | 2%* | 4% | 4% | 3% |
Source: 2021 workplace gender audit data (People matter survey data) Notes: Total sample of 106,069 respondents.
Table 5.6 also shows that lesbian women were significantly more likely than other women to report salaries at the higher end of the scale, over $125,000, at 17%, compared to 9% of straight women and 7% of bisexual or pansexual women. Straight men were most likely to report these salaries, at 22%.
Trans, non-binary and gender-diverse employees were more likely to be overrepresented in lower income brackets and underrepresented in higher income brackets when compared to cisgender men.
As Table 5.7 shows, transgender women were the most likely gender identity to report salaries below $95,000, at 64%, compared to 38% for cisgender men. Cisgender women were next most likely to report salaries under $95,000, at 54%.
| Salary Range | Transgender women | Transgender men | Other trans, non-binary or gender diverse | Cisgender women | Cisgender men |
| Less than $65,000 | 28% | 17% | 18% | 22% | 10% |
| $65,00 – 94,999 | 36% | 36% | 29% | 32% | 28% |
| $95,000 –$124,999 | 16% | 20% | 18% | 22% | 28% |
| $125,000 –$154,999 | 5% | 9% | 4% | 4% | 11% |
| $155,000 –$184,999 | 2% | 3% | 1% | 2% | 5% |
| Over $185,000 | 2% | 3% | 2% | 2% | 5% |
| Prefer not to say | 6% | 7% | 23% | 11% | 10% |
| Unanswered | 8% | 8% | 5% | 5% | 4% |
Source: 2021 workplace gender audit data (People matter survey data) Notes: Total sample of 106,069 respondents.
At the higher end of the income scale, non-binary and gender diverse employees were the least likely of the groups listed in the table to report salaries above $125,000 at 7%, compared to a similar rate of 8% for cisgender women. Cisgender men reported salaries over $125,000 at 3 times the rate of other trans, non-binary or gender diverse people, at 21%.
The estimated pay gap at the all-industry level was largest between straight women, and men, regardless of sexual orientation.
As set out in Table 5.8, at the all-industry level, estimated pay gaps were largest between straight women and men, regardless of sexual orientation, at 16%. Across all of the industry groups with sufficient data, pay gaps were largest or equal largest between straight women and straight men. In the Public healthcare sector, this gap was largest, at 21% (equal with the pay gap between straight women and asexual, bisexual, pansexual and gay men). The Victorian Public Service industry had the smallest gap between straight men and women, at 2%.
The pay gaps presented here are estimates, produced using a combination of salary bracket data from the People matter survey, outlined above, and the Commission’s workforce remuneration data. This is because the workforce data is not comprehensive enough to produce reliable pay gap calculations based on actual salaries. Please see the Introduction to this report for further detail on the approach taken.
| Industry | Local government | Public healthcare | TAFE and other education | Victorian Public Service | All industries |
| Straight women vs straight men | 9% | 21% | 19% | 2% | 16% |
| Lesbian, gay, bisexual, pansexual or asexual women vs gay, bisexual, pansexual or asexual men | 8% | 10% | 0% | 0% | 11% |
| Gay, bisexual, pansexual or asexual men vs straight men | 1% | 0% | 11% | 2% | 1% |
| Lesbian, gay, bisexual, pansexual or asexual women vs straight women | 0% | -15% | -10% | 0% | -5% |
| Straight women vs gay, bisexual, pansexual or asexual men | 8% | 21% | 9% | 0% | 16% |
| Lesbian, gay, bisexual, pansexual or asexual women vs straight men | 9% | 10% | 11% | 2% | 12% |
Source: 2021 workplace gender audit data (People matter survey data) Notes: Total sample of 106,069 respondents.
Figure 5.3. Estimated pay gaps by comparator groups and industry. Figure

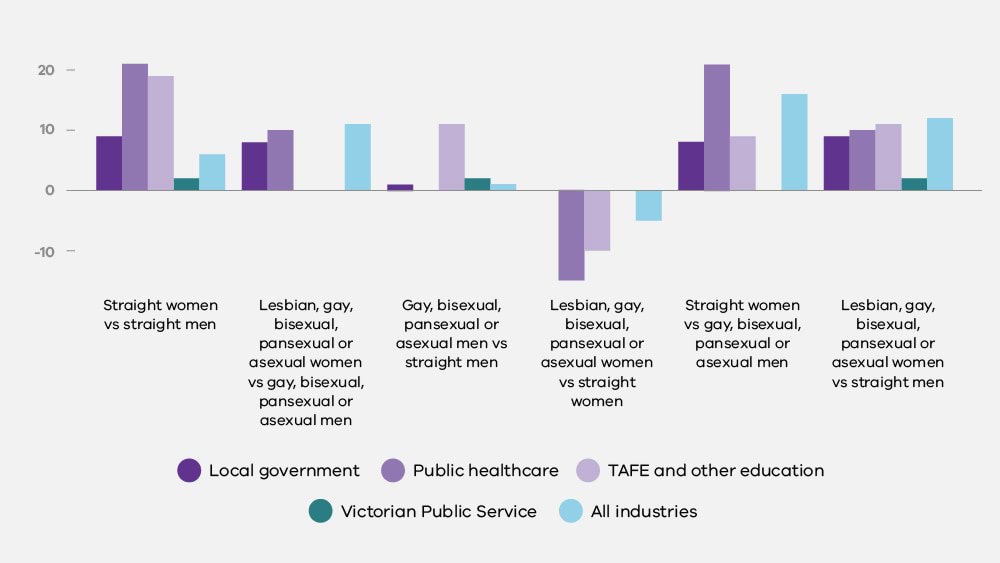
While there was a pay gap between straight women and men across all four industry groupings and at the all-industry level, lesbian, gay, bisexual, pansexual and asexual women actually reported a significant pay gap in their favour when compared to straight women in the Public healthcare (15%) and TAFE and other education industries (10%). In the Local government and Victorian Public Service industries, there was no gap between these two groups.
The relatively higher salaries of non-straight women as compared to straight women suggest that, as in the leadership section above, perhaps expectations around the heterosexual division of labour impact straight women’s career progression and earning potential. For straight women, a male partner’s career may be prioritised, with more domestic labour and care work falling to the woman (Jones 2019; KPMG 2021). This division of labour may be less stark in LGBTIQ+ relationships. Further research is required to understand the drivers of the pay gaps and leadership role differences found here.
The estimated pay gap for different gender identities was largest between trans, non-binary or gender diverse people and cisgender men.
As set out in Table 5.9, at the all-industry level, the estimated pay gap was largest between trans, non-binary or other gender diverse people and cisgender men, at 18%. Across the four industries with sufficient data, the largest estimated pay gaps of 21% were found in the Public healthcare sector between cisgender women and cisgender men, as well as trans, non-binary or other gender diverse people and cisgender men. There tended to be smaller pay gaps between trans, non-binary or gender diverse people and cisgender women, with only a 3% pay gap across all industries.
| Industry | Local government | Public healthcare | TAFE and other education | Victorian Public Service | All industries |
| Cisgender women vs cisgender men | 8% | 21% | 19% | 2% | 15% |
| Trans, non-binary or gender diverse people vs cisgender women | 0% | 4% | -7% | 9% | 3% |
| Trans, non-binary or gender diverse people vs cisgender men | 8% | 21% | 19% | 2% | 18% |
Source: 2021 workplace gender audit data (People matter survey data) Notes: Total sample of 106,069 respondents.
Workplace sexual harassment and discrimination
LGBTIQ+ respondents reported experiencing sexual harassment at disproportionately higher rates than their straight and cisgendered colleagues.
As Table 5.10 shows, gay men were more than twice as likely to report experiencing sexual harassment at work in the past 12 months compared to straight men. Asexual men were five times as likely to report experiencing sexual harassment than straight men. All non-heteronormative women reported sexual harassment at higher rates than their straight colleagues, with bisexual and pansexual women reporting the highest rates at 14%.
The People matter survey 2021 was conducted during the COVID-19 pandemic. This was when many people were working from home (except for essential workers, such as healthcare workers). This means that there might have been a potential decrease in certain types of sexual harassment between workers. However, it remains unclear how much the COVID-19 pandemic impacted these numbers.
| Sexual orientation and gender | PMS Respondents reporting sexual harassment |
| Asexual women | 11% |
| Bisexual and pansexual women | 14% |
| Lesbian women | 10% |
| Straight women | 6% |
| Asexual men | 15%* |
| Bisexual and pansexual men | 12% |
| Gay men | 7% |
| Straight men | 3% |
Source: 2021 workplace gender audit data (People matter survey data) Notes: Total sample of 106,069 respondents.
The two most common types of sexual harassment reported, regardless of gender or sexual orientation, were ‘Intrusive questions about my private life or comments about my physical appearance’ and ‘Sexually suggestive comments or jokes that made me feel offended’.
Trans and gender-diverse respondents reported experiencing sexual harassment at noticeably higher rates than their cisgendered colleagues.
As shown in Table 5.11, transgender women reported experiencing sexual harassment at the highest rates of any gender identity (16%), followed closely by other trans, non-binary or gender diverse respondents at 15%. Transgender men also reported higher rates of sexual harassment at 8%, as compared to both cisgender women (6%) and cisgender men (4%).
| Gender identity | PMS Respondents reporting experiencing sexual harassment |
| Transgender women | 16%* |
| Transgender men | 8%* |
| Other trans, non-binary or gender diverse | 15% |
| Cisgender women | 6% |
| Cisgender men | 4% |
Source: 2021 workplace gender audit data (People matter survey data) Notes: Total sample of 106,069 respondents.
The two most common types of sexual harassment reported, regardless of gender identity, were ‘Intrusive questions about my private life or comments about my physical appearance’ and ‘Sexually suggestive comments or jokes that made me feel offended’. There was some small variation between genders as to which of these two answers was most commonly reported.
Lesbian, gay, bisexual, pansexual and asexual people reported experiencing discrimination at higher rates than straight people, regardless of gender.
As set out in Table 5.12, below, people with non-heteronormative sexual orientations were more likely to report discrimination in the workplace when compared to straight respondents.
| Sexual orientation and gender | PMS Respondents reporting discrimination |
| Asexual women | 7%* |
| Bisexual and pansexual women | 8% |
| Lesbian women | 7% |
| Straight women | 5% |
| Asexual men | 11%* |
| Bisexual and pansexual men | 9.9% |
| Gay men | 6% |
| Straight men | 5% |
Source: 2021 workplace gender audit data (People matter survey data) Notes: Total sample of 106,069 respondents.
The most common type of discrimination reported was being denied opportunities for promotion, except for bisexual and pansexual women, who most commonly reported being denied flexible work arrangements or other adjustments.
Gender-diverse individuals reported facing higher rates of discrimination compared to cisgender people.
Trans and gender-diverse respondents to the People matter survey were approximately 2-3 times more likely than their cisgender colleagues to report experiencing discrimination. As Table 5.13 shows, other trans, non-binary and gender diverse people reported experiencing discrimination at the highest rate of 17%, or approximately three times their cisgender peers. Transgender women reported the next highest rate of experiencing discrimination at 15%, followed by transgender men at 10%. This suggests that people who live outside of cisgender expectations are significantly more likely to experience discrimination in Victorian public sector workplaces.
| Gender identity | PMS Respondents reporting discrimination |
| Transgender women | 15% |
| Transgender men | 10%* |
| Other trans, non-binary or gender diverse | 17% |
| Cisgender women | 5% |
| Cisgender men | 6% |
Source: 2021 workplace gender audit data (People matter survey data) Notes: Total sample of 106,069 respondents.
Recruitment and promotion practices
Gay men, and bisexual, pansexual and straight women, were the most likely to agree that recruitment and promotion decisions in their organisations were fair.
As Table 5.14 shows, gay men were most likely to agree with the statement ‘My organisation makes fair recruitment and promotion decisions, based on merit’, at 57%. Bisexual and pansexual women followed close behind at 56%, with straight women at 55%. Straight women, asexual women, and bisexual and pansexual women were least likely to disagree, at 17% each.
| Sexual orientation and gender | My organisation makes fair recruitment and promotion decisions, based on merit | |
| Strongly agree or agree | Strongly disagree or disagree | |
| Asexual women | 47% | 17% |
| Bisexual and pansexual women | 56% | 17% |
| Lesbian women | 52% | 21% |
| Straight women | 55% | 17% |
| Asexual men | 52% | 21% |
| Bisexual and pansexual men | 50% | 24% |
| Gay men | 57% | 20% |
| Straight men | 53% | 22% |
Source: 2021 workplace gender audit data (People matter survey data) Notes: Total sample of 106,069 respondents. ‘Neither agree nor disagree’ and ‘Don’t know’ response options are not included in the table.
Non-binary and gender-diverse people were least likely of any gender identity to agree that recruitment and promotion decisions in their organisations were fair.
As Table 5.15 shows, other trans, non-binary or gender diverse people had low levels of confidence in the fairness of recruitment and promotion decisions in their organisations, with marginally more respondents disagreeing with the statement (35%) than agreeing (34%). Transgender men had the next lowest levels of agreement at 48%, while cisgender women had the highest levels, at 54%.
| Gender identity | My organisation makes fair recruitment and promotion decisions, based on merit | |
| Strongly agree or agree | Strongly disagree or disagree | |
| Transgender women | 52%* | 22%* |
| Transgender men | 48%* | 21%* |
| Other trans, non-binary or gender diverse | 34% | 35% |
| Cisgender women | 54% | 17% |
| Cisgender men | 52% | 22% |
Source: 2021 workplace gender audit data (People matter survey data) Notes: Total sample of 106,069 respondents. ‘Neither agree nor disagree’ and ‘Don’t know’ response options are not included in the table.
Asexual people, as well as bisexual and pansexual men, were least likely of any sexual orientation to agree that they had an equal chance at promotion in their organisations.
As Table 5.16 shows, gay men (51%) had the highest levels of agreement with the statement ‘I feel I have an equal chance at promotion in my organisation’, while asexual women agreed least often (38%).
| Sexual orientation and gender | I feel I have an equal chance at promotion in my organisation | |
| Strongly agree or agree | Strongly disagree or disagree | |
| Asexual women | 38%* | 32%* |
| Bisexual and pansexual women | 46% | 28% |
| Lesbian women | 48% | 25% |
| Straight women | 46% | 24% |
| Asexual men | 42%* | 31%* |
| Bisexual and pansexual men | 43% | 33% |
| Gay men | 51% | 25% |
| Straight men | 47% | 26% |
Source: 2021 workplace gender audit data (People matter survey data) Notes: Total sample of 106,069 respondents. ‘Neither agree nor disagree’ and ‘Don’t know’ response options are not included in the table.
Non-binary and gender-diverse people were least likely of any gender identity to agree that they had an equal chance at promotion in their organisations.
As Table 5.17 shows, other trans, non-binary and gender diverse people had low confidence in their equal consideration for promotion in their organisations, with only 30% agreeing that they would have an equal chance at promotion and 45% disagreeing. All other gender identities reported notably higher levels of agreement and lower levels of disagreement. Transgender men and straight men had the highest levels of agreement, at 46%.
| Gender identity | I feel I have an equal chance at promotion in my organisation | |
| Strongly agree or agree | Strongly disagree or disagree | |
| Transgender women | 40%* | 35%* |
| Transgender men | 46%* | 28%* |
| Other trans, non-binary or gender diverse | 30% | 45% |
| Cisgender women | 45% | 25% |
| Cisgender men | 46% | 27% |
Source: 2021 workplace gender audit data (People matter survey data) Notes: Total sample of 106,069 respondents. ‘Neither agree nor disagree’ and ‘Don’t know’ response options are not included in the table.
Flexible work practices
Women were more likely than men with the same sexual orientation to report working flexibly, with bisexual and pansexual women reporting the highest rates of flexible working arrangements.
Women reported noticeably higher levels of flexible working arrangements than men. However, bisexual, pansexual, asexual and gay men were more likely to report use of flexible work options than straight men. Table 5.18 illustrates the proportion of respondents in each group who reported accessing flexible work opportunities.
| Sexual orientation and gender | PMS Respondents reporting flexible work |
| Asexual women | 31%* |
| Bisexual and pansexual women | 36% |
| Lesbian women | 29% |
| Straight women | 31% |
| Asexual men | 29%* |
| Bisexual and pansexual men | 30% |
| Gay men | 24% |
| Straight men | 22% |
Source: 2021 workplace gender audit data (People matter survey data) Notes: Total sample of 106,069 respondents.
Women, apart from asexual women, most often reported using flexible start and finish times. Asexual women most frequently reported working part-time. Asexual and gay men also reported using flexible start and finish times most often, while bisexual, pansexual and straight men most often reported working part time.
Transgender women, cisgender women and gender-diverse people were more likely to report flexible work arrangements.
Gender-diverse people and women (regardless of whether they are cisgender or transgender) were more likely to report flexible work arrangements compared to cisgender men and transgender men. Transgender women and gender-diverse people were slightly more likely to report using flexible work than cisgender women. Transgender men and cisgender men reported flexible work arrangements at similar rates to each other.
| Gender identity | PMS Respondents reporting flexible work |
| Transgender women | 36% |
| Transgender men | 24% |
| Other trans, non-binary or gender diverse | 33% |
| Cisgender women | 31% |
| Cisgender men | 22% |
Source: 2021 workplace gender audit data (People matter survey data) Notes: Total sample of 106,069 respondents.
The most common type of flexible work reported by cisgender men was working ‘Part-time’. For every other gender identity, ‘Flexible start and finish times’ were reported most often.
Discussion and conclusion
This chapter highlights the importance of considering the varied experiences and circumstances of LGBTIQ+ people in the workplace. It also highlights the need for organisations to improve data collection on the basis of both sexuality and diverse gender identity.
The lack of workforce data on gender identity and sexual orientation has meant that this analysis has relied on survey data that is not linked to employee records. The impact of this is that the Commission was unable to explore the access to training and other professional development and promotion opportunities, and occupational and industrial segregation experienced by, people of different gender identities and sexualities in Victorian public sector organisations. The Commission also had to estimate pay gaps rather than being able to rely on precise salary data.
Consistent with previous research, the analysis of the 2021 People matter survey and workforce gender audit data shows how gender inequality compounds with other discrimination against many LGBTIQ+ people to cause avoidable harm, hinder career progression and contribute to the gender pay gap (ACON n.d.; AWEI 2022e; PwC and Pride in Diversity 2018). These issues must be addressed to achieve meaningful equality for LGBTIQ+ and gender-diverse people in the Victorian public sector.
The Commission’s data shows notable variation in the rates of management roles held by different members of the LGBTIQ+ community. Lesbian women report holding managerial positions at similar rates to both straight men and gay men. This is a notable departure from the existing literature, which suggests that many LGBTIQ+ women believe their career progression is hindered by discrimination (AWEI 2022e; Ellsworth et al. 2022). Similarly, fewer lesbian women report working part-time compared to women of all other sexual orientations, despite the existing research suggesting that queer women are overrepresented in part-time work (AWEI 2022e).
Alternatively, bisexual, pansexual and asexual women report being in supervisor and manager roles less frequently than lesbian women, at a comparable rate to straight women. It may be that traditional gender expectations of women are more present in relationships which may involve men, rather than those between women, impacting the career progression of some bisexual, pansexual, and potentially asexual women (e.g. Brewster 2017). Similarly, the data shows that lesbian women within the Victorian public sector are slightly less likely to work part time than straight women, while transgender women are equally likely to work part time as cisgender women.
Reported salaries vary across sexual orientation and gender identity. Trans and gender diverse people consistently report lower salaries than their cisgender colleagues, while women are more likely to report lower salaries than men with the same sexual orientation. These findings are reflective of the diverse and compounding experiences of inequality across the LGBTIQ+ community. However, within these broad trends there is some variation. For example, lesbians generally report higher salaries than women with other sexual orientations. Transgender men report higher salaries than other trans and gender diverse respondents and cisgender women, while transwomen are noticeably overrepresented in lower salary brackets. Additional research is needed to understand how factors such as traditional gender roles (e.g. Shamloo et al. 2022), as well as acute stressors experienced by transgender women and gender diverse people, may impact the ability of particular groups of people to advance their careers.
Despite inequalities in access to management roles and higher salaries, most LGBTIQ+ respondents report similar levels of agreement to their straight and cisgendered colleagues that recruitment and promotion processes in their organisations are fair and equal. However, other trans, non-binary and gender diverse people were a notable exception to this trend.
The Commission’s data reveals that LGBTIQ+ respondents report experiencing sexual harassment and discrimination at higher rates compared to their straight and cisgendered colleagues. This is in line with previous research demonstrating that members of the LGBTIQ+ community face elevated rates of sexual harassment and discrimination across multiple areas of their lives, including in employment (e.g. Casey et al. 2019; Deloitte 2022). While further research is needed to fully understand, and therefore address, the drivers of these negative behaviours towards LGBTIQ+ workers, they may be a response to queer people deviating from cisgendered, heterosexual norms (e.g. Brassel et al. 2019).
While this chapter highlights some major areas of concern in the treatment of LGBTIQ+ employees, there is still a large gap in data collection regarding both sexuality and gender identity outside the binary. To adequately support their LGBTIQ+ employees and identify areas for improvement, Victorian public sector organisations should work to improve data collection processes and actively address any biases held by their employees.
Figure 5.4. Estimated pay gaps by comparator groups and industry.
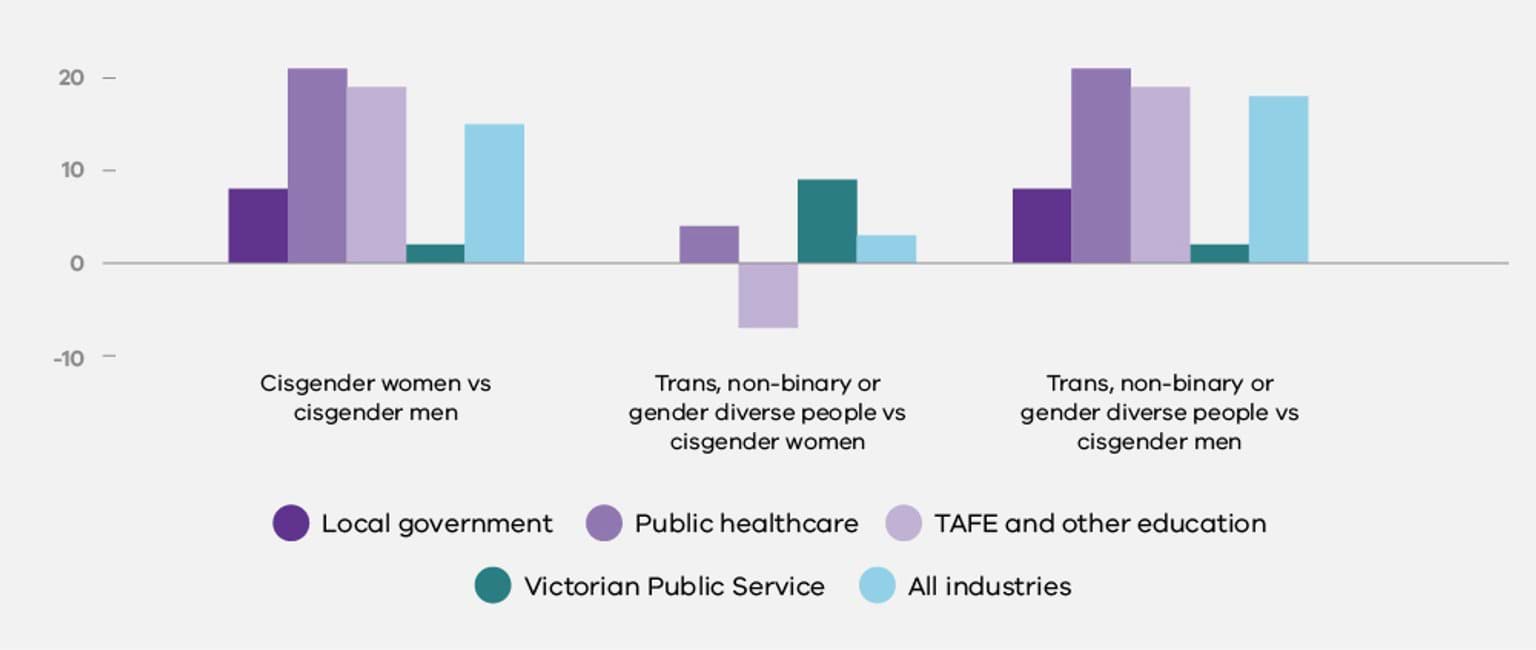
- Cisgendered means that an individual’s gender identity is consistent with their biological sex (Victorian Government 2022b).
Special Look: Rurality, Gender and Workforce Participation
This chapter provides a special look at research on the intersection of gender and workforce participation in rural areas.
In 2022-23, the Commission engaged Dr Cathy Tischler, Dr Kelsey McDonald, Ms Emma Dallamora and Professor Keir Reeves to undertake research into the gendered challenges faced by women working rurally in the Grampians region of Victoria. Their findings demonstrate the unique challenges and barriers faced by women working in the Victorian public sector in a rural location.
The researchers reviewed both CGEPS audit data for organisations primarily located in the Grampians region and literature to inform questions for individual and group interviews. These interviews were conducted with employees, managers, and executives from nine local public sector organisations based in the Grampians area. A total of 75 interviews were conducted, with 36 of these being individual interviews. A gendered breakdown of participants shows that 36% of interviewees were men and 64% were women. The research team asked open ended questions regarding career progression, workplace flexibility and management practices to understand the different needs of rural workforces and how women in these areas can be best supported. For further details of the research methodology, please visit our research page.
Key findings
Recruitment
The location of rural organisations often causes issues when recruiting required experts. Participants reported risks when bringing technical staff to rural areas, as new hires may not like the location and leave after just a few months. Limited applicant pools can also cause issues in achieving a diverse workforce – participants recounted at least one instance where all applicants for a particular role were men.
Workplace flexibility
Researchers found that low staffing rates and high workloads compromised workplace flexibility. They reported that this creates additional barriers for women to work while supporting their families, as they tend to have more caring responsibilities. In many instances, women’s partners were unable to share caring duties due to the nature of their own work. A lack of childcare options, as well as challenges related to distance between school or childcare and workplaces further constrained women’s ability to participate in the workforce.
Additionally, participants reported inconsistencies in flexible working policies and procedures between organisations, as some women received more support than others.
The researchers also found that women who moved to part-time work – particularly when returning from maternity leave – at times faced workload challenges. Women in this position sometimes found they were expected to, or had the perception that they needed to, do the same amount of work as a full-time worker, but without appropriate compensation.
Leadership aspirations
The researchers identified several barriers to women’s leadership aspirations in rural settings. They found that women perceive senior management roles as having limited flexibility and low supports for family caring responsibilities. Participants expressed their careers are often tied to a limited location, based on where their partners work.
The researchers also found that reductions in senior and middle-management roles further reduced leadership opportunities for women. This was compounded by executives (who are mostly men) staying in these limited leadership roles for lengthy periods.
Attitudes towards gender equity
The researchers found a variety of attitudes towards considering gender in employment and the workforce. When leadership promoted merit-based recruitment approaches, they seemed to believe their practices were ‘naturally fair’. The researchers discuss how this ignores gendered barriers to work success and perpetuates gender inequality. The research found that barriers to workforce participation for women in rural areas were often hidden. It recommended embedding gender equality considerations structurally in organisational values and culture, so that people of all genders can participate more fully in caring responsibilities.
Furthermore, the researchers found that in smaller, rural public sector organisations, gender equality-focused work was often assigned as an additional responsibility to one worker’s already busy workload. This additional task also often fell onto women employees.
Recommendations for intersectional data collection, analysis, and interpretation
Introduction
Taking an intersectional approach to workplace gender auditing is necessary to understand whether your organisation’s systems, structures, policies, and practices are working to promote workplace gender equality for all.
Using workforce data and employee experience data to understand intersecting forms of inequality can add more complexity, but as this report has demonstrated, it is very important.
At the centre of the concept of intersectionality is the idea that experiences of inequality cannot be compartmentalised into distinct, separate categories (Bowleg 2008, p.314). However, analysing workforce and employee experience data with an intersectional lens involves combining and comparing data about different attributes – for example, comparing rates of sexual harassment for women with disabilities (combining gender and disability attribute data), versus other groups with different combinations of attributes. The Commission acknowledges that this approach does not fully reflect the concept of intersectionality.
Despite these limitations, workforce and employee experience data can provide important information about workplace outcomes for groups facing intersecting forms of disadvantage, including pay gaps, experiences of sexual harassment, access to training and promotional opportunities, and more. Additional qualitative data will need to be obtained to understand how groups facing intersecting forms of disadvantage experience inequality in the workplace and how to address this (Bowleg 2008; Hankivsy and Grace 2015).
Structure of the recommendations
The recommendations that follow are organised into 5 chronological sections. They are primarily aimed at defined entities with reporting obligations under the Act, but they may also be helpful for any organisation aiming to improve intersectional data collection about their workforce. Firstly, the chapter begins with a short section outlining key recommendations for approaching intersectionality and intersectional data collection within your organisation. The next 3 sections cover the 3 main activities of data collection, data analysis and data interpretation. The recommendations in each of these 3 sections provide advice on how to improve your collection and use of intersectional data across these phases of the process. Finally, the fifth section briefly outlines how to monitor and track your work over time.
The recommendations focus on how to improve intersectional data collection in your organisation. They do not provide advice on how to improve intersectional inequalities that organisations might uncover through their data collection, or other methods. The focus on data here is because many defined entities were unable to provide intersectional workforce data in the inaugural 2021 workplace gender audit. Collecting accurate data is central to understanding the state and nature of intersectional gender inequality in your organisation. For recommendations on how to address intersecting forms of disadvantage and discrimination in your organisation, you may consider reviewing projects funded under the Commission’s 2022 Research Grants Round (our grants focus on Aboriginal women, gender and caring, women with disability, migrant and refugee women, and gender in a rural context; also see our 2021 funded grant looking at how organisations can achieve gender equality for culturally diverse women), as well as resources from the Victorian Government (for LGBTIQ+ inclusion see ‘LGBTIQ+ workforce inclusion plans’ and ‘Gender affirmation in Victorian public sector workplaces’) and the Australian Public Service Commission (for a useful overview and further resources about age inclusion, see ‘Creating an age inclusive workplace’).
Approaching intersectionality in your organisation
Recommendation 1
Develop and communicate a clear, shared understanding of intersectionality
Having a clear understanding of intersectionality in your organisation will help you consider how to approach data collection, analysis and consultation with your employees and other stakeholders. It will also help you make informed decisions in addressing any inequalities you discover through your data.
The recommendations that follow primarily cover consideration of intersectionality in relation to collecting, analysing and interpreting your workforce and lived experience data. To learn more about how to apply intersectionality in your work (particularly with regard to your other obligations under the Gender Equality Act 2020 (Vic) (the Act)), please visit:
- Applying intersectionality in Gender Impact Assessments
- Applying intersectionality in Gender Equality Action Plans.
Recommendation 2
Engage diverse voices respectfully
It is important to engage people with lived experience of varying forms of inequality to ensure your data collection, analysis and interpretation are respectful and fit-for-purpose. However, when involving diverse individuals in this work, it is important to ensure you are not creating unpaid or unrecognised labour for people in your organisation. Research funded by the Commission in 2021-22 found that the burden of work being done within organisations to meet the obligations under the Act disproportionately fell to women, particularly women with disability, women of colour and Aboriginal women (Ryan et al. 2022).
To ensure this work is not expected of marginalised groups in addition to their standard workload, you should formally allocate time in participants’ workload for them to take part. Offering times and modes of engagement that reflect flexible work and accessibility needs is also important. Where possible, avoid one-off forms of engagement with these groups, instead inviting them to participate in longer-term processes of improvement and change.
Data collection
Recommendation 3
Review the Commission’s Baseline report for recommendations related to the 7 workplace gender equality indicators
The Act specifies the kind of data you need to collect. You can learn more about specific strategies to collect data under the 7 workplace gender equality indicators in the Commission’s 2021 Baseline report. Recommendations are located at the end of each chapter. The recommendations that follow here are not organised around the workplace gender equality indicators but will help you to understand more broadly how to collect, analyse and interpret your data using an intersectional lens.
For more information on how to undertake a workplace gender audit, please visit our progress audit guidance.
Recommendation 4
Update, or plan to update, your employee management system so it can collect demographic data about your workforce
If you are not doing so already, it is important that you start collecting demographic data from your employees to enable you to understand how gender inequality may be compounded by other forms of disadvantage or discrimination that a person may experience on the basis of Aboriginality, age, disability, ethnicity, gender identity, race, religion, sexual orientation and other attributes. This is in addition to the data you collect on the 7 Workplace gender equality indicators.
To achieve this, your employee systems must be able to collect and store this type of data. These systems may be your workforce management, recruitment, training and payroll systems.
A good time to ask employees for this information is when a new individual joins your organisation as part of onboarding, as this is generally a time when you will collect a lot of information from the employee. Or you may want to ask for it during recruitment, noting that the incentive for a user to provide this information when the don’t have a guarantee of a job interview of job offer, may not be as compelling. You can also ask existing employees if they are prepared to provide this data so you can add it into your employee data systems retrospectively.
Be conscious of Recommendations 5 and 6, below, when designing your workforce systems. Also try to abide by the principle of ‘tell me once’. That is, if the potential or current employee has already provided you this information in another collection process, consider if you really need to ask for it again.
Conducting an employee experience survey is a great way for organisations to see where workers may be experiencing compounded disadvantage, but survey data does not show the full picture. Collecting both workforce data and employee experience data is important because they are complementary. They work together to give an organisation a holistic picture of its performance against the workplace gender equality indicators. Because employee experience data is not tied to an employee record, it cannot tell us things such as the exact remuneration an employee received, meaning it is impossible to calculate accurate pay gaps. In addition to remuneration information, workforce data can provide detail around career progression opportunities, leave-taking including parental leave, recruitment and exits, and occupational and hierarchical segregation within an organisation. For these reasons, it is important that both datasets include a robust range of demographic attributes.
The Victorian Public Sector Commission is currently leading the development of core, common workforce data standards for the collection of diversity information about public sector employees. Embedding these types of diversity workforce data standards into people and culture systems in organisations can help ensure effective and consistent workforce data collection.
Recommendation 5
Explain to your employees why you are collecting their personal information
Building an environment where your employees feel comfortable sharing personal information is crucial. This is particularly important where individuals with specific demographic attributes might stand out due to their small numbers in your organisation. Your employees will feel more comfortable to provide their personal information if they understand how it will be used and stored. Clearly communicating to your employees why you are collecting the information, how it will be used to support and benefit them and others in the organisation, and how it will be stored securely, can build trust, and allow them to provide informed consent. You can do this using tools like consent forms and data collection notices. You might also consider consulting with employee networks and diversity and inclusion committees to understand your employees’ concerns and be able to address them clearly in your communications.
The Victorian Public Sector Commission is currently researching and developing the best way to design and structure forms that ask for this personal information from employees in a way that is safe and inclusive.
Finally, it is important to move from communicating to demonstrating your organisation’s commitment to intersectionality. This means showing how you are meaningfully addressing inequalities revealed by your data collection. Actions that follow through on commitments to use data to improve equality can help to build accountability and trust (Global Partnership for Sustainable Development Data 2021).
Recommendation 6
Maintain confidentiality and privacy when collecting, managing and storing sensitive information from employees
It is vital to ensure privacy when collecting sensitive demographic information. This can also contribute to building trust and making sure your employees feel safe to disclose details about their identities. The Office of the Victorian Information Commissioner (OVIC) provides a range of advice and resources about the privacy obligations of organisations, including organisations that collect workplace gender audit data under the Act. As part of your workplace gender audit, and when collecting intersectional data, you may be required to collect:
- personal information (which may be used to identify an individual)
- sensitive information (which includes attribute information such as cultural background or sexual orientation)
- health information (which includes whether an employee identifies as a person with disability).
It is important to handle these types of information correctly. You can access further information about privacy and the Act more generally on OVIC’s website here.
Data analysis
Recommendation 7
Look for trends in your workforce data using an intersectional lens
An intersectional analysis can help to identify patterns of inequality experienced by people who share a combination of attributes. These trends may not be visible when you analyse data about each attribute in isolation. Look for trends in your workforce and employee experience data that may reveal how gender inequality combines with other forms of disadvantage and discrimination to create advantages and disadvantages for different groups (Bowleg 2008).
For example, a single demographic analysis might involve looking at representation of women in leadership positions compared to men. But this analysis may hide intersecting forms of inequality. Taking an intersectional approach could involve also looking at representation of different women in leadership positions. See Table 6.1 for some examples of how to expand from a gendered analysis to an intersectional analysis of your data.
Table 6.1. Some examples of gendered versus intersectional analyses of workforce data.
| Gendered analyses | Intersectional analyses |
| Representation of women in leadership positions compared to people of self-described gender and men. | Representation of Aboriginal women in leadership positions, compared to:
|
| Pay differences between women, men and people of self-described gender. | Pay differences between:
|
| Workplace sexual harassment complaints received by women, people of self-described gender and men. | Workplace sexual harassment complaints received by culturally and racially marginalised (CARM) women, compared to:
|
Recommendation 8
Decide which analyses to prioritise for your organisation
When applying an intersectional lens, there are many possible combinations of data that can be analysed and you may not be able to look at every combination. Consider your organisation, the demographics of your employees and your community, the data that you hold, and your priorities for addressing inequality. It’s a good idea to consult with employees across your organisation to help identify which analyses should be prioritised (Hankivsky & Grace 2015).
Recommendation 9
Be creative with your data analysis
Methods for applying an intersectional lens to quantitative data are still being developed (Ben 2018). As such, there is no single, correct way to undertake an intersectional analysis of your workforce and employee experience data. While such data is an important tool to shine a spotlight on inequality, it will not be able to provide the whole picture about inequality in your organisation. Try examining different combinations of attributes to see whether you can uncover patterns of inequality. You can use the sample data analysis and literature contained in this report for ideas about where to start and where patterns of inequality tend to be found.
Data interpretation
Recommendation 10
Consult with your employees to support your data interpretation
To make sense of the results of your analyses, and to develop a more comprehensive understanding of how intersecting forms of inequality are experienced in your organisation (and what to do about this), it is very important to consult your employees (and perhaps other stakeholders) from diverse backgrounds. Consultation can also assist in understanding the greater level of diversity within high-level categories, such as ‘people with disability’. This should include consulting with people who have different combinations of the attributes listed in the Act (Aboriginality, age, disability, ethnicity, gender identity, race, religion, sexual orientation), as well as other communities your employees represent. One way to do this is to draw on established groups, such as diversity and inclusion committees, external experts with real-life experience, and employee networks. You could also use interviews, focus groups or free-text surveys and draw on qualitative data that is external to your organisation, including the Commission’s funded research projects. Ideally, you will also use consultation with employees who experience intersecting forms of disadvantage and discrimination to co-design solutions to the problems uncovered by your data (Hankivsky & Cormier 2019).
Recommendation 11
Consider how your organisational structures and processes might contribute to patterns in your data
Patterns of disadvantage in your data could mean that there are structural problems to address (Bowleg 2008). Structural inequalities within an organisation are inequalities that are built into the way your organisation operates. They could be embedded in systems, processes, or organisational cultures, and might be difficult to see and shift.
For example, your employee experience data might reveal that carers and people with disability report lower levels of belonging and lower confidence in the fairness of progression and promotion practices in your organisation that other groups. Your workforce data might also show low promotion and career development opportunities for carers and people with disabilities and low representation of these cohorts in leadership roles. Consultation with diverse employees could reveal that this may be related to the structure of a typical workday, where people are expected to work from 9am to 5pm, Monday to Friday. As a result of this structure, carers and people with disabilities might both face different barriers to progression. Addressing this structural problem – a rigid approach to work hours – might benefit both groups. You might do this by offering and promoting flexible work options in your organisation, and by lowering the requirement to justify non-standard work hours (an “all roles flex” approach e.g. Roderick 2018).
Monitoring and tracking
Recommendation 13
Monitor and track efforts regularly to ensure progress is maintained
Regularly track and monitor data collected under the 7 workplace gender equality indicators to assess progress towards intersectional gender equality. Evaluate changes over time and identify areas where disparities or gaps persist for specific groups (Hankivsky & Cormier 2019). You might wish to use the resources provided by the Commission to support progress reporting as a starting point (review ‘Recommendation 1’ and ‘Commissioner’s recommendations for analysis’ in our progress reporting guidance).
Use information about changes in your data over time to evaluate your progress, review your data collection approach, improve strategies to drive intersectional gender equality in your organisation, and to measure the impact of those strategies. This may be done through formal processes, such as your organisation’s progress reporting obligations under the Act, as well as internal processes.
Concluding comments and next steps
This report represents a crucial first step towards understanding and addressing complex inequalities in Victorian workplaces. Each chapter draws attention to how gender inequality is compounded by another form of discrimination for Victorian public sector workers. The chapters begin by outlining key barriers to equality for each group, before presenting a summary of insights from the Commission’s Research Grants Round 2022 or related Victorian Government initiatives. They also present key findings from the Commission’s inaugural workplace gender audit data collected under the Gender Equality Act 2020 (Vic) (the Act) in 2021. The Recommendations chapter provides defined entities with advice for how to improve intersectional data collection practices and data quality in future workplace gender audits. The recommendations may also support a broader range of organisations to improve data collection from, and understanding of, diverse groups of employees.
This report represents several ‘firsts’. For many organisations, this is the first time they have had to collect and report on workforce data about many of the attributes listed in the Act (Aboriginality, age, disability, ethnicity, gender identity, race, religion, and sexual orientation). Understandably, there remains work to do to build the systems to collect and store this data, to build employee trust around data collection and management, and to fill the gaps in data available. Without accurate and meaningful data about how different forms of inequality intersect to shape the working lives of employees, barriers to equality cannot be addressed.
This is also the first time the Commission has attempted to analyse data pertaining to intersectional gender equality. As noted in several places throughout this report, doing so is complex. Applying an intersectional lens to data analysis and interpretation means balancing the need to provide accurate representations of complex lives with the need to identify broad patterns of systemic inequality. The Commission is committed to continuous improvement in future intersectional analyses.
Improving data collection and data quality
In addition to reporting on the Commission’s intersectional data from the inaugural workplace gender audit under the Act, this report has also provided defined entities and broader organisations with an overview of approaches that could be used to improve future data collection initiatives. In the Recommendations chapter, the Commission discussed the importance of setting your organisation up for success in collecting, analysing and interpreting intersectional data. This involved developing and communicating a shared understanding of intersectionality, as well as engaging diverse voices in a respectful manner to avoid burdening employees with additional unpaid or unrecognised labour. By meaningfully engaging diverse voices, organisations can ensure their change-making initiatives are reflective of, and remain relevant to, the lived experiences of employees who suffer disadvantage and discrimination.
It is important for organisations to update employee management systems to ensure they are equipped to collect both demographic data as well as data points related to the 7 Workplace gender equality indicators under the Act. Building trust and accountability in relation to data collection and storage is also crucial to ensure employees feel comfortable disclosing their personal information. Demonstrating your organisation’s commitment to intersectional gender equality, for example by working to meaningfully address any inequalities revealed through the collection of employee data, can help to reassure employees about the integrity of this process.
Once data collection is complete, organisations then need to analyse and interpret their data through an intersectional lens. These two steps should involve consultation with employees with lived experience of disadvantage and discrimination in your workplace to maximise your ability to use the data to create positive change in your organisation. Analysis and interpretation may also require some creative thinking. For instance, trends related to intersectional gender equality will not be visible when data is analysed by only one attribute in isolation, for example just looking at gender, LGBTIQ+ status, or cultural background. The type of intersectional analysis you undertake, and the attributes that you combine in your analysis, should be specific to the context of your organisation. In other words, you should consider the demographics of your employees and the community in which you work to decide which types of analyses to focus on. There is no ‘one-size-fits-all’ approach to intersectional workforce data analysis. Rather, organisations should attempt to analyse their data in diverse combinations to try to uncover any existing patterns of inequality.
Any patterns of disadvantage uncovered by this process will require targeted structural change. An organisation’s progress towards intersectional gender equality can be evaluated through future iterations of data collection and reporting under the Act, as well as internal monitoring and evaluation processes.
Where are we now?
As this report is being released, defined entities with reporting obligations under the Act are preparing to report for the first time on their progress in advancing gender equality. Progress reports will require defined entities to:
- collect updated data as part of a progress audit
- report on gender impact assessments conducted on all new or renewing programs, policies or services with a direct and significant impact on the public
- report on their progress in implementing their Gender Equality Action Plans
- demonstrate their progress in relation to the 7 workplace gender equality indicators.
The first progress reports submitted under the Act will be the culmination of work by both the Commission and defined entities to drive intersectional gender equality in Victorian public sector organisations and the communities they serve.
As explored within this report, considering intersecting experiences is vital when discussing gender equality. For many, the gendered impacts of navigating the workplace do not occur in isolation. By highlighting common experiences and barriers faced by those experiencing intersecting forms of inequality, this report deepens our understanding of workplace disadvantage and discrimination. In doing so, it provides important context which will support defined entities in their journey to address gender inequality. By opening up these conversations and supplying robust data and analysis, the Commission seeks to inspire defined entities and other jurisdictions to drive intersectional gender equality. It also seeks to grow the ability of organisations and data collection agencies to collect data about people of all genders, including those outside the binary.
Intersectional analysis is crucial for moving towards positive change
The Act represents an ambitious step up in equality law in Australia. It is the first piece of Australian legislation to officially acknowledge intersectionality, embedding the consideration of intersectionality throughout each of its reporting obligations. While intersectional approaches to data collection, research and workplace equality initiatives are still being refined, the hard work of defined entities has allowed the Commission to collect the most comprehensive dataset relating to intersectional gender inequality in public sector organisations in Australia. Collecting, analysing and presenting this data helps us to understand the state and nature of intersectional gender inequality in Victorian public sector organisations, universities and local councils. Only by understanding our current state can we make positive change. By doing so, Victoria can carve a path for other jurisdictions to similarly drive intersectional gender equality in their organisations and communities.
Glossary
Ableism
Ableism is discrimination or prejudice towards people with disability. It can be described as the systemic and interpersonal exclusion and oppression of people with disability. For more information see: https://www.vic.gov.au/state-disability-plan/our-language/ableism
Ageism
Is based on the belief that people of a certain age should behave in a certain way and are only capable of certain things. Age discrimination and prejudice are usually targeted by one age group against another, but can also be directed towards people in the same age group. Ageism can also be internal, affecting how a person perceives their own abilities in relation to prejudicial attitudes.
Base salary
Base salary is an employee’s full-time equivalent annual salary, including standard benefits such as annual leave and casual loading. Base salary excludes extras like overtime and allowances.
Binary (in relation to gender)
The gender binary is the idea that there are only two genders, men, and women. The gender binary is also linked to the belief that gender is assigned at birth and aligns with biological sex.
Cisgender
Refers to a person whose gender corresponds with their biological sex. For more information see: https://www.vic.gov.au/pride-our-future-victorias-lgbtiq-strategy-2022-32/definitions-and-key-terms
Colonialism
Refers to the domination of First Nations populations by colonisers who settle among and retain control over them through practices such as violence, dispossession of land, and exploitation of resources.
Bullying
Repeated unreasonable behaviour directed at an employee that creates a risk to their health and safety.
Complaint/complainant
A complainant is an employee, member of an organisation’s governing body, or member of the public who makes a formal complaint of sexual harassment in a workplace or work-related setting. The complaint may be made internally with an employer or with an external agency.
Compounded gender inequality
Section 6(8) of the Gender Equality Act 2020 (Vic) outlines that “gender inequality may be compounded by other forms of disadvantage or discrimination that a person may experience based on Aboriginality, age, disability, ethnicity, gender identity, race, religion, sexual orientation and other attributes.” The Commission also refers to this concept as “intersectional gender inequality”.
Cultural identity
Affiliation with, or a sense of belonging to, a cultural group based on categories including country of birth, race, ethnicity, religion and/or nationality. Cultural identity also refers to the shared customs, practices, beliefs, languages, and world views of a cultural group.
Cultural safety
The ability to create an environment that is safe for people from diverse cultures. When a person feels culturally safe, this means there is no challenge or denial of their identity and experience, and they are free from experiences of violence, racism, bullying and harassment.
Defined entities
The Act applies to defined entities that have 50 or more employees, including: public service bodies, public entities, special bodies, local councils, universities, Court Services Victoria and the Office of Public Prosecutions (s5(1)). A full list of defined entities is available on our website.
Direct and indirect racism
Direct racism includes unequal treatment resulting in unequal opportunity, whereas indirect racism includes equal treatment resulting in unequal opportunity. Direct racism is often more blatant whereas indirect racism can be more subtle and therefore more difficult to identify.
Discrimination
When a person treats, or proposes to treat, a person unfavourably because of a personal characteristic or attribute.
Gender
Part of how you understand who you are and how you interact with other people. Many people understand their gender as being a man or woman. Some people understand their gender as a mix of these or neither. A person’s gender and their expression of their gender can be shown in different ways, such as through behaviour or physical appearance. For more information see: https://www.vic.gov.au/pride-our-future-victorias-lgbtiq-strategy-2022-32/definitions-and-key-terms
Gendered violence
Violence directed against a person because of their gender, or violence that affects people of one gender disproportionately. The violence could include physical, sexual, or psychological harm or suffering.
Gender identity
A person’s sense of whether they are a man, a woman, non-binary, gender fluid or any combination of these identities. People may use a variety of terms to describe their gender identity.
Gender roles
The stereotypes that have traditionally been culturally associated with a particular gender. These roles include how people are expected to behave, dress, speak and physically present themselves to the world based on their gender.
Employee
Section 3 of the Act defines an employee as follows: an employee, of a defined entity, means a person employed by the defined entity on a full-time, part-time, casual or fixed term basis (including an apprentice or trainee) but does not include:
- a contractor or subcontractor; or
- an outworker; or
- a person on a vocational placement; or
- a student gaining work experience; or
- a volunteer.
Flexible working arrangements
Access to one or more of the following arrangements, as chosen by the employee:
- Working more hours over fewer days
- Flexible start and finish times
- Working remotely (negotiated by the employee – i.e. not as a requirement under COVID-19 restrictions)
- Working part-time (negotiated by the employee only)
- Shift swap
- Job sharing
- Study leave
- Purchased leave
- Using leave to work flexible hours
Part-time or remote working arrangements that were mandated or instigated by the employer or by government requirements related to COVID-19 restrictions are not considered flexible work.
Heteronormative
The assumption that heterosexuality is the norm and that everyone is heterosexual.
Heterosexism
Discrimination or prejudice based on the belief that sexual orientations other than heterosexuality are unnatural.
Homophobia
Irrational fear or hatred of people who are not heterosexual.
Intersectionality
A theory that seeks to account for how systems of power, such as gender, race, and class, ‘intersect’ to shape experiences of the social world, and potentially exacerbate inequalities.
Intersectional gender inequality
The recognition that gender inequality may be compounded by other forms of disadvantage or discrimination that a person may experience based on Aboriginality, age, disability, ethnicity, gender identity, race, religion, sexual orientation and other attributes. Consideration of intersectionality is an object of the Act under section 4(c).
Lateral violence
Denotes violence which is directed between members of a marginalised group. Sometimes this is described as violence directed sideways at peers, rather than at those in more powerful positions.
Median
The median of a set of values is the middle value when the set is ordered from least to greatest. Half of the set of values are below the median, and half are above the median.
People matter survey (PMS)
An anonymous survey completed by approximately 90% of organisations with reporting obligations under the Gender Equality Act 2020 (Vic). The People matter survey is administered by the Victorian Public Sector Commission (VPSC). For more information see: https://vpsc.vic.gov.au/data-and-research/about-the-people-matter-survey/
Promotions
People who were appointed to a role at a higher classification than their previous role. This includes promotions awarded through competitive recruitment processes as well as those awarded after a fixed period. It does not include lateral transfers (at the same classification) or temporary higher duties opportunities.
Psychological safety
The ability to be one’s whole self in a given context, such as the workplace, without fear of negative consequences.
Racism
Is a process through which ideologies, actions, beliefs, and formal policies such as laws produce inequalities between people based on race. Racism can be interpersonal or systemic, and includes prejudice, discrimination or hatred directed at a person because of their skin colour, ethnicity or religion. Racism can also be subtle and does not always include direct acts of abuse or harassment. Racism can evolve over time and impacts specific communities in different ways.
Recruitment
People who have been newly appointed to a role from both internal and external recruitment processes. It doesn’t include people who have been promoted.
Self-described gender
For the purposes of the 2021 workplace gender audit, the Commission collected data within three categories – women, men and self-described gender. Gender is part of how someone understands who they are and how they interact with other people. Many people identify their gender as being ‘woman’ or ‘man’. Some people understand their gender as a combination of these or neither. Gender can be expressed in different ways, such as through behaviour or physical appearance. A person’s gender does not necessarily mean they have particular sex characteristics or a particular sexuality, or vice versa. The Commission recommended allowing an option for self-described gender with a free text option, in addition to ‘woman’ and ‘man’ when collecting gender data. For those people who identify with a self-described gender, their gender should have been recorded in relevant systems using the term(s) provided by the employee.
This report refers to people of self-described gender as a group; however, the Commission acknowledges that an individual with a self-described gender may identify as non-binary, trans, gender diverse, agender, qenderqueer, genderfluid or using any other term. For more information on gender-inclusive language, please refer to: www.vic.gov.au/inclusivelanguage-guide.
Sex
A person’s biological sex characteristics. The term ‘sex’ has previously been understood as either female or male. For more information see: https://www.vic.gov.au/pride-our-future-victorias-lgbtiq-strategy-2022-32/definitions-and-key-terms
Sexism
Is based on the belief that men are superior to women. Sexism can be interpersonal or systemic, and includes prejudice, discrimination or hatred directed at a person, usually women, based on sex. Sexism can also be subtle and does not always include direct acts of abuse or harassment. Sexism takes multiple forms and can happen across multiple contexts.
Sexual harassment
Non-consensual or unwelcome sexual behaviour that could be expected to make a person feel offended, humiliated or intimidated. Sexual harassment may be physical, spoken or written and can be directed at, and perpetrated by, persons of any sex or gender. A single incident can constitute sexual harassment, as can a broader pattern of behaviour.
Sexuality
See ‘sexual orientation’.
Sexual orientation
A person’s romantic or sexual attraction to others. A person’s gender does not mean they have certain sex characteristics or a particular sexuality, or vice versa. For more information see: https://www.vic.gov.au/pride-our-future-victorias-lgbtiq-strategy-2022-32/definitions-and-key-terms
Transphobia
Irrational fear or hatred of people who are transgender.
Workplace adjustments
A modification to a work process, practice, procedure or setting that enables a person with disability to perform their job in a way that minimises the impact of barriers they face at work. For more information see: https://www2.education.vic.gov.au/pal/disability-and-reasonable-adjustment/policy-and-guidelines/what-are-workplace-adjustments
References
This page provides references for sources used throughout this report.
ABS (Australian Bureau of Statistics) (2019) Census of Population and Housing: Characteristics of Aboriginal and Torres Strait Islander Australians, abs.gov.au, accessed 19 April 2023.
ABS (Australian Bureau of Statistics) (2019) Disability, Ageing and Carers, Australia: Summary of Findings, abs.gov.au, accessed 8 August 2023.
ABS (Australian Bureau of Statistics) (2020) Characteristics of recent migrants, abs.gov.au, accessed 16 February 2023.
ABS (Australian Bureau of Statistics) (2022a) Victoria: Aboriginal and Torres Strait Islander population summary, abs.gov.au, 23 August 2023.
ABS (Australian Bureau of Statistics) (2022b) Average weekly earnings, Australia: estimates of weekly earnings classified by industry, sector, state and territory(opens in a new window), ABS, accessed 20 August 2023.
ABS (Australian Bureau of Statistics) (2022c) Pensioners experience higher increases in living costs, abs.gov.au, accessed 12 July 2023.
ABS (Australian Bureau of Statistics) (2022d) Religious affiliation in Australia, abs.gov.au, accessed 27 June 2023.
ACON (n.d.) Sapphire Initiative(opens in a new window), ACON website, accessed 21 August 2023.
AFDO (Australian Federation of Disability Organisations) (n.d.) Language Guide, afdo.org.au, accessed 6 October 2023.
Afrouz R and Robinson K (2023) ‘Domestic and Family Violence for Culturally and Linguistically Diverse Communities in Australia during COVID-19 Pandemic’, Practice, 35:3:235-254, doi:10.1080/09503153.2022.2114443.
AHRC (Australian Human Rights Commission) (2015) National prevalence survey of age discrimination in the workplace 2015, AHRC, Australian Government, accessed 6 October 2023.
AHRC (Australian Human Rights Commission) (2016) Willing to Work: National Inquiry into Employment Discrimination, AHRC, Australian Government, accessed 1 September 2023.
AHRC (Australian Human Rights Commission) (2018) Everyone’s business: Fourth national survey on sexual harassment in Australian workplaces, AHRC, Australian Government, accessed 7 September 2023.
AHRC (Australian Human Rights Commission) (2020) Wiyi Yani U Thangani (Women’s voices): Securing our rights, securing our future report, AHRC, Australian Government, accessed 1 September 2023.
AHRC (Australian Human Rights Commission) (2021a) Employing and retaining older workers (2021), AHRC, Australian Government, accessed 28 August 2023.
AHRC (Australian Human Rights Commission) (2021b) What’s age got to do with it? A snapshot of ageism across the Australian lifespan, AHRC, Australian Government, accessed 14 August 2023.
AHRC (Australian Human Rights Commission) (2022a) Annual Report 2021-2022, AHRC, Australian Government, accessed 12 September 2023.
AHRC (Australian Human Rights Commission) (2022b) National Anti-Racism Framework Scoping Report 2022, AHRC, Australian Government, accessed 5 July 2023.
AHRC (Australian Human Rights Commission) (2022c) Time for respect: Fifth national survey on sexual harassment in Australian workplaces, AHRC, Australian Government, accessed 29 August 2023.
AHRC (Australian Human Rights Commission) (n.d.) Chapter 1: The case for addressing workplace discrimination related to pregnancy, parental leave and on return to work after parental leave, AHRC, Australian Government, accessed 12 September 2023.
AIHW (Australian Institute of Health and Welfare) (2021) Indigenous employment, AIHW, Australian Government, accessed 20 June 2023.
AIHW (Australian Institute of Health and Welfare) (2022a) People with disability in Australia 2022, AIHW, Australian Government, accessed 28 September 2023.
AIHW (Australian Institute of Health and Welfare) (2022b) Reporting on the health of culturally and linguistically diverse populations in Australia: An exploratory paper, AIHW, Australian Government, accessed 30 August 2023.
AIHW (Australian Institute of Health and Welfare) (2023a) Profile of First Nations people, AIHW, Australian Government, accessed 10 October 2023.
AIHW (Australian Institute of Health and Welfare) (2023b) Older Australians, AIHW, Australian Government, accessed 14 September 2023.
Allen L (2021) ‘Understanding ethnicity in contemporary Australia using the census’, Australian Population Studies, 5(1):56-64, doi:10.37970/aps.v5i1.82.
Amos N, Hill AO, Melendez-Torres GJ, Carman M, Lyons A and Bourne A (2023) ‘Affirming educational and workplace settings are associated with positive mental health and happiness outcomes for LGBTA + youth in Australia’, BMC Public Health, 23(1421):1-12, doi:10.1186/s12889-023-16034-7.
Annese L (3 July 2023) ‘Measuring Cultural Diversity’, DCA, accessed 9 October 2023.
Armillei R and Mascitelli B (2017) ‘‘White Australia Policy’ to ‘multicultural’ Australia: Italian and other migrant settlement in Australia, living in two homes’, in Espinoza-Herold M and Contini RM (eds) Living in two homes: Integration, identity and education of transnational migrants in a globalized world, Emerald Publishing, UK.
Australian Government (2020) Closing the gap report 2020, Australian Government, accessed 21 February 2023.
Australian Government (n.d.) Marriage equality in Australia, Australian Government, accessed 21 August 2023.
AHRC (Australian Human Rights Council (2022) Time for respect: Fifth national survey on sexual harassment in Australian workplaces, AHRC, Australian Government 10 October 2023.
Australian HR Institute and AHRC (2023) Employing and Retaining Older Workers, AHRC, Australian Government, accessed 6 October 2023.
Australian Workplace Equality Index (AWEI) (2022a) 2022 Practice Points – Edition 2: Being out at work, Pride in Diversity & ACON, accessed 11 September 2023.
Australian Workplace Equality Index (AWEI) (2022b) 2022 Practice Points – Edition 3: Trans and Gender Diverse Inclusion, Pride in Diversity & ACON, accessed 21 August 2023.
Australian Workplace Equality Index (AWEI) (2022c) 2022 Practice Points – Edition 5: Regional Australia, Pride in Diversity & ACON, accessed 21 August 2023.
Australian Workplace Equality Index (AWEI) (2022d) 2022 Practice Points – Edition 6: Aboriginal and Torres Strait Islander Inclusion, Pride in Diversity & ACON, accessed 21 August 2023.
Australian Workplace Equality Index (AWEI) (2022e) 2022 Practice Points – Edition 7: LGBTQ Women & Those Perceived as Women in the Workplace, Pride in Diversity and ACON, accessed 21 August 2023.
Australian Workplace Equality Index (AWEI) (2022f) 2022 Practice Points – Edition 1: Key Insights(opens in a new window), Pride in Diversity & ACON, accessed 21 August 2023.
Baird M, Cooper R, Hill E, Probyn E and Vromen A (2018) Women and the future of work: Report 1 of the Australian Women’s Working Futures Project, University of Sydney, accessed 7 September 2023.
Bargallie D (2020) Unmasking the racial contract: Indigenous voices on racism in the Australian Public Service, Aboriginal Studies Press, Canberra.
Bargallie D (2023) ‘Indigenous Australian peoples and work: Examining worklife histories’, in Billett S, Salling Olesen H and Filliettaz L (eds) Sustaining employability through work-life learning: Practices and policies, Springer Nature Singapore, Singapore.
Bargallie D, Carlson B and Day M (2023) Make Us Count: Understanding Aboriginal Women’s Experiences in Victorian Public Sector Workplaces, Griffith University and Macquarie University.
Beagan BL, Bizzeth SR, Pride TM and Sibbald KR (2022) ‘LGBTQ+ identity concealment and disclosure within the (heteronormative) health professions: “Do I? Do I not? And what are the potential consequences?”’, SSM – Qualitative Research in Health, 2:1–8, doi:10.1016/j.ssmqr.2022.100114.
Beaupert F, Steele L and Gooding (2017) ‘Introduction to Disability, Rights and Law Reform in Australia: Pushing Beyond Legal Futures’, Law in Context, 35(2):1-14, doi:10.26826/law-in-context.v35i2.5.
Ben ER (2018) ‘Intersectionality in the practice of mixed methods gender research’, Journal of Research in Gender Studies, 8(1):73–88, doi:10.22381/JRGS8120184.
Blackford K, Crawford G, McCausland K and Zhao Y (2023) ‘Describing homelessness risk among people from culturally and linguistically diverse backgrounds in Western Australia: A cluster analysis approach’, Health Promotion Journal of Australia, doi:10.1002/hpja.704.
Blackham A (2022) Reforming Age Discrimination Law: Beyond Individual Enforcement, Oxford University Press, Oxford.
Blackham A (2023) ‘A Life Course Approach to Addressing Exponential Inequalities: Age, Gender, and COVID-19’ in Shreya Atrey and Sandra Fredman (eds) Exponential Inequalities: Equality Law in Times of Crisis, Oxford University Press, doi:10.1093/oso/9780192872999.003.0013.
Blackham A, Hewitt A and Lam J (2022) Reimagining Age Equality at Work, pursuit.unimelb.edu.au, accessed 28 August 2023.
Blackham A, Ryan L and Ruppanner L (2024, accepted 19 June 2023) ‘Enacting intersectionality: A case study of gender equality law and positive equality duties in Victoria’, Monash University Law Review, 49(3).
Blair K, Dunn K, Kamp A and Alam O (2017) Challenging racism project: 2015-16 National survey report, Western Sydney University, Sydney.
Biddle N, Hunter B, Yap M and Gray M (6 June 2016) ‘Eight ways we can improve Indigenous employment’, The Conversation, accessed 21 February 2023.
Bowleg L (2008) ‘When Black + lesbian + woman ≠ Black lesbian woman: the methodological challenges of qualitative and quantitative intersectionality research’, Sex Roles, 59:312–325, doi:10.1007/s11199-008-9400-z
Brassel ST, Settles IH and Buchanan NT (2013) ‘Lay (mis)perceptions of sexual harassment toward transgender, lesbian, and gay employees’, Sex Roles, 80:76–90, doi:10.1007/s11199-018-0914-8.
Bretherton I, Thrower E, Zwickl S, Wong A, Chetcuti D, Grossman M, Zaja JD, Cheung AS (2020) ‘The health and well-being of transgender australians: a national community survey’, LGBT Health, 8(1):42-49, doi:10.1089/lgbt.2020.0178.
Brewster, ME (2017) ‘Lesbian women and household labor division: a systematic review of scholarly research from 2000 to 2015’, Journal of Lesbian Studies, 21(1):47–69, doi:10.1080/10894160.2016.1142350.
Carangio V, Farquharson K, Bertone S and Rajendran D (2021) ‘Racism and White privilege: highly skilled immigrant women workers in Australia’, Ethnic and Racial Studies, 44(1):77-96, doi:10.1080/01419870.2020.1722195.
Carman M, Farrugia C, Bourne A, Power J and Rosenberg S (2020) Research Matters: How many people are LGBTIQ?, Rainbow Health Victoria website, accessed 22 August 2023.
Casey LS, Reisner SL, Findling MG, Blendon RJ, Benson JM, Sayde JM and Miller C (2019) ‘Discrimination in the United States: experiences of lesbian, gay, bisexual, transgender, and queer Americans’, Health Services Research, 54(S2):1454–1466, doi:10.1111/1475-6773.13229.
Cho HE and Segrave M (2023) Victorian Local Councils and Gender Equality: Examining Commitments to Diversity and the Experiences of Women from Migrant and Refugee Backgrounds, Monash University.
Chomik R and Khan FJ (2021) Tapping into Australia’s ageing workforce: Insights from recent research, CEPAR, Australian Government, accessed 2 September 2023.
CGEPS (Commission for Gender Equality in the Public Sector) (2022) Baseline report – 2021 workplace gender audit data analysis, CGEPS, Victorian Government, accessed 1 September 2023.
Circle In (2021) Menopause and the workplace, Circle In, accessed 1 September 2023.
Collins PH (1990) Black feminist thought: Knowledge, consciousness, and the politics of empowerment. Routledge, New York.
Collins PH and Chepp V (2013) ‘Intersectionality’ in Waylen G, Celis K, Kantola J and Weldon L (eds) The Oxford handbook of gender and politics, Oxford University Press, Oxford.
COTA (2022) Mature Workforce Survey Report, COTA, accessed 2 September 2023.
Crenshaw K (1989) ‘Demarginalizing the intersection of race and sex: A Black feminist critique of antidiscrimination doctrine, feminist theory and antiracist politics’, University of Chicago Legal Forum 1989(1):139-167.
Dangar K, Gunawansa M, Blackham A, Ruppanner L, Gaze B, Ainsworth S, Churchill B, Acosta Rueda L and Patrick C (2023) Caring and Workplace Gender Equality in the Public Sector in Victoria, University of Melbourne.
Darcy S, Taylor T and Green J (2016) ‘‘But I can do the job’: examining disability employment practice through human rights complaint cases’, Disability & Society, 31(9):1242-1274, doi:10.1080/09687599.2016.1256807.
DARU (Disability Advocacy Resource Unit) (2019) How we talk about disability matters, DARU, accessed 28 August 2023.
Davis M (2009) ‘Essay: A woman’s place…’, Griffith Review: A Quarterly Review of Writing and Ideas, 24:156-162.
DCA (Diversity Council Australia) (2021) Counting Culture: Towards a Standardised Approach to Measuring and Reporting on Workforce Cultural Diversity in Australia, DCA, accessed 8 August 2021.
DCA (Diversity Council Australia) (2023) Culturally and racially marginalised women in leadership: A framework for (intersectional) organisational action, DCA, accessed 6 September 2023.
Deloitte (2022) LGBT+ Inclusion @ Work 2022: A Global Outlook, Deloitte, accessed 21 August 2023.
Department of Education and Training Victoria (DET) (2023) Inclusive Workplaces Guide(opens in a new window), DET, accessed 21 August 2023.
Department of Health (2023) LGBTIQ+ Victorians, health.vic.gov.au, accessed 4 September 2023.
Devine A, Vaughan C and Kavanagh A (2020) ‘If I had stable housing I would be a bit more receptive to having a job. Factors influencing the effectiveness of Disability Employment Services reform’, Work, 65(4):775–787, doi:10.3233/WOR-203130.
Devine A, Shields S, Dimov S, Dickinson H, Vaughan C, Bentley R, LaMontagne AD and Kavanagh A (2021) ‘Australia’s Disability Employment Services Program: Participant Perspectives on Factors Influencing Access to Work’, International Journal of Environmental Research and Public Health, 18(21):1-20, accessed 3 October 2023.
D'Ignazio C and Klein LF (2020) Data feminism. MIT Press, Cambridge MA.
Disability Royal Commission (2020) Employment Issues Paper, Disability Royal Commission, accessed 3 October 2023.
Diversity Council Australia (DCA) (2018) Out at Work: From Prejudice to Pride(opens in a new window), DCA, accessed 21 August 2023.
Diversity Council Australia & Pride in Diversity (DCA and Pride in Diversity) (2022) Intersections at Work: Understanding the Experiences of Culturally Diverse LGBTQ Talent, DCA and Pride in Diversity, accessed 14 April 2023.
Diversity Council Australia/Jumbunna Institute (Brown C, D’Almada-Remedios R, Gilbert J, O’Leary J and Young N) (2020) Gari Yala (Speak the truth): Centreing the work experiences of Aboriginal and/or Torres Strait Islander Australians, Diversity Council Australia/Jumbunna Institute, Sydney.
Donelly M, Gordon S and Bowling A (2020) ‘Income and employment equity of graduates with and without disabilities’, Work, 65(3):547-561, doi:10.3233/WOR-203109.
Dowse, L., Soldatic, K., Spangaro, J. and van Toorn, G (2016), ‘Mind the gap: the extent of violence against women with disabilities in Australia’, Australian Journal of Social Issues, 51(3): 341-359. doi:10.1002/j.1839-4655.2016.tb01235.
Duncan C and Loretto W (2004) ‘Never the Right Age? Gender and Age-Based Discrimination in Employment’, Gender, Work & Organisation, 11(1):95-115, doi:10.1111/j.1468-0432.2004.00222.x.
Elias A, Mansouri F and Paradies Y (2021) Racism in Australia Today, Palgrave Macmillan, Singapore, doi: 10.1080/07256868.2022.2060991.
Ellsworth D, Mendy A and Sullivan G (2020) How the LGBTQ+ community fares in the workplace(opens in a new window), McKinsey & Company, accessed 14 April 2023.
Evans O (2021) Gari Yala (Speak the truth): Gendered insights, WGEA Commissioned Research Report in partnership with the Jumbunna Institute of Education and Research and Diversity Council Australia, Sydney.
FECCA (Federation of Ethnic Communities’ Councils of Australia) (2020) If we don’t count it … it doesn’t count!, FECCA, accessed 2 October 2023.
FECCA (Federation of Ethnic Communities’ Councils of Australia) (2022a) Annual Report 2021-22, FECCA, accessed 3 July 2023.
FECCA (Federation of Ethnic Communities’ Councils of Australia) (2022b) A Secure and Successful Multicultural Workforce: FECCA Submission to the Employment White Paper, FECCA, accessed 16 February 2023.
Frohmader C (2014) ‘Gender Blind, Gender Neutral’: The effectiveness of the National Disability Strategy in improving the lives of women and girls with disabilities, WWDA, accessed 21 June 2023.
Frohmader C, Dowse L and Didi A (2015) Preventing violence against women and girls with disabilities: Integrating a human rights approach, WWDA, accessed 3 October 2023.
Gedro J (2009) ‘LGBT career development’, Advances in Developing Human Resources, 11(1):54–66, doi:10.1177/1523422308328396.
Global Partnership for Sustainable Development Data (2021) A primer on an intersectional approach to data(opens in a new window), Global Partnership for Sustainable Development Data, accessed 7 August 2023.
Gyimah M, Azad A, Begum S, Kapoor A, Ville L, Henderson A and Dey M (2022) Broken Ladders: The myth of meritocracy for women of colour in the workplace, The Runnymede Trust & The Fawcett Society, accessed 12 July 2023.
Haber MG, Mazzotti VL, Mustian AL, Rowe DA, Bartholomew AL, Test DW and Fowler CH (2016) ‘What Works, When, for Whom, and With Whom: A Meta-Analytic Review of Predictors of Postsecondary Success for Students With Disabilities’, Review of Educational Research, 86(1):123-162, doi:10.3102/0034654315583135.
Harmony Alliance (2019) A strategic approach to improving employment outcomes of women from migrant and refugee backgrounds in Australia, Harmony Alliance, accessed 30 August 2023.
Handy J and Davy D (2007) ‘Gendered ageism: Older women’s experiences of employment agency practices’, Asia Pacific Journal of Human Resources, 45(1):85-99, doi:10.1177/1038411107073606.
Hankivsky O and Cormier R (2019) ‘Intersectionality and public policy: some lessons from existing models’, in Hankivsky O and Jordan-Zachery, JS (eds) The Palgrave Handbook of Intersectionality in Public Policy, London.
Hankivsky O and Grace D (2015) ‘Understanding and emphasizing difference and intersectionality in multimethod and mixed methods research’ in Hesse-Biber SN and Johnson RB (eds) The Oxford Handbook of Multimethod and Mixed Methods Research Inquiry, Oxford.
Harnois CE (2015) ‘Age and Gender Discrimination: Intersecting Inequalities across the Lifecourse’ in At the Center: Feminism, Social Science and Knowledge, Emerald Group Publishing Limited, doi:10.1108/S1529-212620150000020005.
Hausknecht S, Low LF, O’Loughlin K, McNab J and Clemson L (2020) ‘Older adults’ self-perceptions of aging and being older: A scoping review’, The Gerontologist, 60(7):524-534, doi:10.1093/geront/gnz153.
Healey L, Howe K, Humphreys C, Jennings C and Julian F (2008) Building the Evidence: A Report on the Status of Policy and Practice in Responding to Violence against Women with Disabilities in Victoria, Women’s Health Victoria and Victorian Women With Disabilities Network, accessed 3 October 2023.
Henriques-Gomes L (11 April 2022) ‘People with disability working for legal pay as low as $2.27 an hour, inquiry hears’, The Guardian, accessed 28 September 2023.
ILO (International Labour Organization) (2021) An update on the youth labour market impact of the COVID-19 crisis, ILO, Geneva, accessed 1 September 2023.
Jones L (2019) Women’s progression in the workplace, Global Institute for Women’s Leadership & Government Equalities Office, UK, accessed 25 July 2022.
Kidd J (2000) Black lives, government lies, UNSW Press, Randwick.
Khadem N (6 March 2023) ‘Why racially marginalised women hide their identity by 'code-switching' to act 'white' at work’, ABC News, accessed 17 July 2023.
KPMG (2021) Towards a more equal sharing of work, KPMG, accessed 25 August 2023.
KPMG (2022) She’s Price(d)less: The economics of the gender pay gap, KMPG
Kukutai T and TaylorJ (2016) Indigenous data sovereignty: Towards an agenda, ANU Press, Canberra.
Leigh A (16 May 2023) ‘Discrimination must be eliminated from the public service’, The Mandarin, accessed 2 October 2023.
Lenette C, Baker S and Hirsch A (2019) ‘Systemic policy barriers to meaningful participation of students from refugee and asylum seeking backgrounds in Australian higher education: Neoliberal settlement and language policies and (deliberate?) challenges for meaningful participation’ in McBrien JL (eds) Educational policies and practices of English-speaking refugee resettlement countries, Brill Publishers, Netherlands.
Loxton D, Townsend N, Forder P, Barnes I, Byrnes E, Anderson A, Cavenagh D, Egan N, Tuckerman K and Byles J (2021) Australian women’s mental health and wellbeing in the context of the COVID19 pandemic in 2020, Women’s Health Australia, Australian Government, accessed 1 September 2023.
Lyons A, Alba B, Waling A, Minichiello V, Hughes M, Barrett C, Fredriksen-Goldsen K, Edmonds S, and Pepping CA (2021) ‘Comfort among older lesbian and gay people in disclosing their sexual orientation to health and aged care services’, Journal of Applied Gerontology, 40(2):132–141, doi:10.1177/0733464820925330.
Mansouri F (29 March 2022) ‘Racism is still an everyday experience for non-white Australians. Where is the plan to stop this?’, The Conversation, accessed 3 July 2023.
McFadden C and Crowley-Henry M (2018) ‘”My People”: the potential of LGBT employee networks in reducing stigmatization and providing voice’, The International Journal of Human Resource Management, 29(5):1056-1081, doi:10.1080/09585192.2017.1335339.
McGann M, Ong R, Bowman D, Duncan A, Kimberley H and Biggs S (2016) ‘Gendered Ageism in Australia: Changing Perceptions of Age Discrimination among Older Men and Women’, Economic Papers, 35(4):375-388, doi:10.1111/1759-3441.12155.
Meltzer A, Robinson S and Fisher KR (2020), ‘Barriers to finding and maintaining open employment for people with intellectual disability in Australia’, Social Policy and Administration, 54(1):88-101, doi:10.1111/spol.12523.
Messerschmidt JW (2019) ‘The Salience of “Hegemonic Masculinity”’, Men and Masculinities, 22(1):85-91, doi:10.1177/1097184X18805555.
Minderoo Foundation (2022) Woort Koorliny - Australian Indigenous Employment Index 2022 National Report, Minderoo Foundation, accessed 19 April 2023.
Minei EM, Hastings SO and Warren S (2023) ‘LGBTQ+ sensemaking: the mental load of identifying workplace allies’, International Journal of Business Communication, 60(3):823-843, doi:10.1177/2329488420965667.
Montoya C (2019) ‘Race’, in Shepherd LJ (eds) Handbook on Gender and Violence, Edward Elgar Publishing Limited, UK.
Moore K (2021) ‘Critical factors that influence a young person’s journey toward sustainable employment. International Journal for Educational and Vocational Guidance, 21, 329-354.
Moraga C and Anzaldúa G (1981) This bridge called my back: Writings by radical women of colour. Persephone Press, Watertown, MA.
Murfitt K, Crosbie J, Zammit J, Williams G, Koch LC and Rumrill PD (2018), Employer engagement in disability employment: A missing link for small to medium organizations – a review of the literature’, Journal of vocational rehabilitation, 48(3):417-431, doi:10.3233/JVR-180949.
Murray PA and Ali F (2017) ‘Agency and coping strategies for ethnic and gendered minorities at work’, The International Journal of Human Resource Management, 28(8):1236-1260, doi:10.1080/09585192.2016.1166787.
NAA (National Archives of Australia) (n.d.) The Immigration Restriction Act 1901, naa.gov.au, accessed 2 October 2023.
National Centre for Transgender Equality (NCTE) (2016), 2015 U.S. Transgender Survey (USTS)(opens in a new window), NCTE, accessed 21 August 2023.
National Resource Center on LGBTQ+ Aging (2013) Advancing employment equality for LGBT older adults(opens in a new window), The National Resource Center on LGBTQ+ Aging (USA), accessed 2 October 2023.
NSW Public Service Commission (2021) Diversity: Chapter 5, Workforce profile report 2021, nsw.gov.au, accessed 3 September 2023.
O’Loughlin K, Kendig H, Hussain R and Cannon L (2017) ‘Age discrimination in the workplace: The more things change…’, Australasian Journal on Ageing, 36(2):98-101, doi:10.1111/ajag.12429.
O’Meara R, Dunstan L, Debinski A, and Ryan C (2023) Disability and Screen Work in Australia: Report for Industry, Melbourne Disability Institute, accessed 4 October 2023.
O‘Shea A and Frawley P (2020) ‘Gender, sexuality and relationships for young Australian women with intellectual disability’, Disability & Society, 35(4):654-675, doi:10.1080/09687599.2019.1647148.
Opare-Addo J and Bertone S (2021) ‘Slow and uneven progress: The representation of non-English-speaking background employees in the Australian Public Service’, Australian Journal of Public Administration, 80(3):385-406, doi:10.1111/1467-8500.12484.
Our Watch (2018) Changing the picture: A national resource to support the prevention of violence against Aboriginal and Torres Strait Islander women and their children, Our Watch, Melbourne.
Patterson K (2021) Safety and Security for Older Women, humanrights.gov.au, accessed 6 October 2023.
Patterson K (28 July 2023) ‘Ageism is the least-challenged form of discrimination – but it can be fought’, The Guardian, accessed 14 August 2023.
Pellegrini V, De Cristofaro V, Giacomantonio M, Salvati M (2020) ‘Why are gay leaders perceived as ineffective? The role of the type of organization, sexual prejudice and gender stereotypes’, Personality and Individual Differences, 157:1–11, doi:10.1016/j.paid.2020.109817.
Pettinicchio D and Maroto M (2017) ‘Employment Outcomes Among Men and Women with Disabilities: How the Intersection of Gender and Disability Status Shapes Labor Market Inequality’, Research in Social Science and Disability, 10(1):3-33, doi:10.1108/S1479-354720170000010003
Peterson Gloor JL, Okimoto TG and King EB (2021) ‘”Maybe Baby?” The employment risk of potential parenthood’, Journal of Applied Psychology, 52(1):623-642, doi:10.1111/jasp.12799.
Pillay V, Jayasinghe P and Light A (2021) How defined entities can achieve gender equality for Culturally Diverse Women in the Victorian Public Sector, Victorian Multicultural Commission and Mindtribes, accessed 5 July 2023.
PwC and Pride in Diversity (2018) Where are all the women?(opens in a new window), PwC, accessed 19 April 2023.
PWDA (People With Disability Australia) (2021) PWDA Language Guide: A guide to language about disability, PWDA, accessed 5 October 2023.
Raymond M, Olsen J, Ainsworth S, Lotia Nuzhat, Harbridge R and Holland A (2019) Improving Access and Inclusion in Employment for People with Disabilities: Implementation of Workplace Adjustment in ‘Best-Practice’ Organisations, Centre for Workplace Leadership, University of Melbourne, accessed 3 October 2023.
Respect@Work (n.d.) Culturally and linguistically diverse, Respect@Work, accessed 7 September 2023.
Robertson S, Monaghan L and Southby K (2019) Disability, embodiment and masculinities, in Gottzén L, Mellström U and Shefer (eds) Routledge International Handbook of Masculinity Studies, Taylor & Francis Ltd, London.
Roderick T (2018) Does this desk make my job look big? The design, implementation and impact of “all roles flex” in a range of Australian organisations, Sydney Policy Lab, The University of Sydney, accessed 25 September 2023.
Ryan L, Blackham A, Ainsworth S, Ruppanner L, Gaze B and Yang E (2022) Laying the foundation for gender equality in the public sector, The University of Melbourne.
Scanlon Foundation (2021) Mapping Social Cohesion 2021, Scanlon Foundation, accessed 27 June 2023.
Segrave M, Wickes R and Keel C (2021) Migrant and Refugee Women in Australia: The Safety and Security Survey, Monash University, accessed 30 August 2023.
Shamloo SE, De Cristofaro V, Pellegrini V and Salvati M (2022) ‘Masculinity and leadership effectiveness (self-)perceptions: the case of lesbian leaders’, International Journal of Environmental Research in Public Health, 19(24):1–14, doi:10.3390/ijerph192417026.
Stafford L, Marston G, Chamorro-Koc M, Betson A and Drennan J (2017) ‘Why one size fits all approach to transition in Disability Employment Services hinders employability of young people with physical and neurological disabilities in Australia’, The Journal of Industrial Relations, 59(5):631-651.
State of Queensland (2017) Queensland Public Sector LGBTIQ+ Inclusion Strategy, State of Queensland (Public Service Commission), accessed 21 August 2023.
Thomas M (2021) ‘The Impact of Mandated Maternity Leave Policies on the Gender Gap in Promotions: Examining the Role of Employer-Based Discrimination’, doi:10.2139/ssrn.3729663.
Tischler C, McDonald K, Dallamora E and Reeves K (2023) Rurality and Workforce Participation: Exploring Prevalence of Part-time and Insecure Work in Grampians Public Sector Roles, Federation University.
Trades Union Congress (TUC) (2019) Sexual harassment of LGBT people in the workplace, TUC, accessed 21 August 2023.
Villegas PE (2019) ‘“I made myself small like a cat and ran away”: workplace sexual harassment, precarious immigration status and legal violence’, Journal of Gender Studies, 28(6):674-686, doi:10.1080/09589236.2019.1604326.
VEOHRC (Victorian Equal Opportunity & Human Rights Commission) (n.d.) Race discrimination and vilification: Race discrimination at work, humanrights.vic.gov.au, accessed 27 June 2023.
Victorian Government (2016) Safe and Strong: A Victorian Gender Equality Strategy, vic.gov.au, accessed 26 June 2023.
Victorian Government (2020) State Apology for laws against homosexual acts, vic.gov.au, accessed 21 August 2023.
Victorian Government (2021) The Victorian commissioner for LGBTIQ+ communities, vic.gov.au, accessed 4 September 2023.
Victorian Government (2022a) Pride in our future: Victoria’s LGBTIQ+ strategy 2022-32, vic.gov.au, accessed 4 October 2023.
Victorian Government (2022b) Definitions and key terms, vic.gov.au, accessed 4 October 2023.
Vlachantoni A, Evandrou M, Falkingham J and Gomez-Leon M (2020) ‘Caught in the middle in mid-life: Provision of care across multiple generations’, Ageing & Society, 40(7):1490-1510, doi:10.1017/S0144686X19000047.
VPSC (Victorian Public Sector Commission) (2022) Employee numbers, VPSC, Victorian Government, accessed 25 August 2023.
VPSC (Victorian Public Sector Commission) (2023a) Acknowledging the lived experience of Aboriginal employees, VPSC, Victorian Government, accessed 25 August 2023.
VPSC (Victorian Public Sector Commission) (2023b) Aboriginal and/or Torres Strait Islander employees, VPSC, Victorian Government, accessed 6 September 2023.
VPSC (Victorian Public Sector Commission) (2023c) Cultural Diversity, VPSC, Victorian Government, accessed 2 October 2023.
Victorian Public Sector Commission (VPSC) (2023d) Gender affirmation in Victorian public sector workplaces: a guide for managers supporting employees affirming their gender(opens in a new window), VPSC, accessed 10 September 2023.
Wade M (2001) ‘Women and salary negotiation: The costs of self-advocacy, Psychology of Women Quarterly, 25(1):65-76, doi:10.1111/1471-6402.00008.
Waite S (2021) ‘Should I Stay or Should I Go? Employment Discrimination and Workplace Harassment against Transgender and Other Minority Employees in Canada’s Federal Public Service’, Journal of Homosexuality, 68(11):1833-1859
Weatherall R and Gavin M (2021) ‘Safeguarding women at work? Lessons from Aotearoa New Zealand on effectively implementing domestic violence policies’, Journal of Industrial Relations, 63(4):568–590, doi:10.1177/0022185621996766.
Webster JR and Adams GA (2023), ‘Stifled from the start: biased allocation of developmental opportunities and the underrepresentation of lesbian women and gay men in leadership’, Equality, Diversity and Inclusion, 42(2):300–318, doi:10.1108/EDI-05-2022-0120.
Weeden KA, Cha Y, Bucca M (2016) ‘Long Work Hours, Part-Time Work, and Trends in the Gender Gap in Pay, the Motherhood Wage Penalty, and the Fatherhood Wage Premium’, RSF: The Russell Sage Foundation Journal of the Social Sciences 2(4):71-102.
Welsh S, Carr J, MacQuarrie B and Huntley A (2006) ‘“I’m not thinking of it as sexual harassment” understanding harassment across race and citizenship’, Gender & Society, 20(1)87-107, doi:10.1177/0891243205282785.
WGEA (Workplace Gender Equality Agency) (2022) Wages and Ages: Mapping the Gender Pay Gap by Age, WGEA, Australian Government, accessed 2 September 2023.
WGEA (Workplace Gender Equality Agency) (2023) Gender equality and intersecting forms of diversity, WGEA, Australian Government, accessed 5 April 2023.
WHO (World Health Organization) (2021) Global Report on Ageism, WHO, Geneva, accessed 14 August 2023.
Wibberley G, Bennett T, Jones C and Hollinrake A (2018) ‘The role of trade unions in supporting victims of domestic violence in the workplace’, Industrial Relations Journal, 49(1):69-85, doi:10.1111/irj.12204.
Williams J, Khan MH, Mayes R, Obst P and Lowe B (2023) Getting on at Work: Progression and Promotion of Women with Disability in the Victorian Public Service, Queensland University of Technology.
WWDA (Women with Disabilities Australia) (2020) WWDA Response to Employment Issues Paper of the Royal Commission into Violence, Abuse, Neglect and Exploitation of People with Disablity, WWDA, accessed 10 May 2023.
Yates S, Carey G, Malbon E and Hargrave J (2022) ‘‘Faceless monster, secret society’: Women's experiences navigating the administrative burden of Australia's National Disability Insurance Scheme’, Health & Social Care in the Community, 30(5):2308-2317, doi:10.1111/hsc.13669.
YWC (Young Workers Centre) (2017) Young Workers Annual Report 2016-17, Young Workers, youngworkers.org.au, accessed 28 August 2023.
YWC (Young Workers Centre) (2020) Victorian Government Youth Strategy Submission, youngworkers.org.au, accessed 28 August 2023.
YWC (Young Workers Centre) (2022) Young Workers’ Experience of Age Discrimination, youngworkers.org.au, accessed 28 August 2023.