

This chapter discusses the experiences of LGBTIQ+ women, men and gender diverse people. The acronym LGBTIQ+ was chosen because it reflects the title of the Victorian Commissioner for LGBTIQ+ Communities, a role that advocates for the rights and safety of people with diverse genders and sexualities (Victorian Government 2021), as well as Pride in our future: Victoria’s LGBTIQ+ strategy 2022-32 (Victorian Government 2022a). In this report, the Commission uses the terms LGBTIQ+ to discuss people with sexualities that are not heterosexual and/or a gender identity that is not cisgendered.1 Use of the terms ‘women’ and ‘men’ includes transgender women and transgender men. In addition, these terms also include gender-diverse individuals who are perceived as either women or men, as they may experience disadvantage and discrimination on the basis of their perceived gender. The language used in this report is not intended to minimise or lessen any aspect of a person’s identity. The Commission acknowledges the significant diversity and variety of terminology that exists within the LGBTIQ+ community.
Within the LGBTIQ+ community there are a wide variety of sexual orientations and gender identities. The LGBTIQ+ acronym is an evolving term which stands for lesbian, gay, bisexual, transgender, intersex, queer, and more (Victorian Government 2021). These identities are not mutually exclusive, and there are a range of other terms (such as pansexual, asexual and non-binary) that people use to describe their gender and sexuality (e.g., Department of Health 2023). People who appear to be LBGTIQ+ may or may not identify as such, and people within this community may not wish, or feel safe, to disclose this information to others (Lyons et al. 2021). This, combined with inadequate reporting mechanisms, makes it hard to gauge accurate numbers of LGBTIQ+ people (Carman et al. 2020). Despite these limitations, in 2020, 3-4% of the Australian population reported identifying as lesbian, gay, or bisexual – with 19% of women and 9% of men having ‘reported same gender attraction and behaviour’ (Carman et al. 2020:3). Internationally, it is estimated that 1% of the population identify as transgender, and 1.7% of people are born with intersex characteristics (Carman et al. 2020:3).
LGBTIQ+ people face inequalities because societies and individuals assume that heterosexual and cisgendered is the standard. These assumptions are reinforced and normalised through policies, cultures and interactions which discriminate against members of the LGBTIQ+ community and perpetuate unequal structures (Beagan et al. 2022; McFadden and Crowley-Henry 2018). In Victoria, homosexuality was a criminal offence until 1980 (Victorian Government 2020). However, criminal convictions related to homosexuality were only expunged 34 years later, in 2014 (Victorian Government 2020). In 2016, Victorian Premier Daniel Andrews “delivered an historic apology for gay convictions in Parliament,” (Victorian Government 2020) and it wasn’t until late 2017 that the right to marry was extended to homosexual couples (Australian Government n.d.).
Key workplace issues for LGBTIQ+ people
High levels of workplace discrimination, exclusion and harassment
According to the Australian Workplace Equality Index’s 2022 survey, 26.7% of respondents have witnessed negative behaviours towards people of diverse sexualities or genders at work, and 10.9% have witnessed serious bullying (AWEI 2022a:9). This mirrors international research, with a 2022 survey of 5,474 LGBTIQ+ people globally finding that 40% experienced non-inclusive behaviours at work (Deloitte 2022:18). Concerningly, 39% of these respondents reported sexual harassment across both remote and office working environments (Deloitte 2022:18). The risk of harassment and abuse is even greater for LGBTIQ+ individuals who belong to more than one minority group (AWEI 2022b; AWEI 2022c; AWEI 2022d; AWEI 2022e; TUC 2019).
Prejudice in the form of homophobia, transphobia, tokenism, stereotyping and being misunderstood are often the root causes of negative behaviours towards LGBTIQ+ people (State of Queensland 2017; DCA and Pride in Diversity 2022; Waite 2021). Like other forms of harassment and discrimination in workplace settings, homophobic or transphobic behaviour can be subtle, meaning victims feel they cannot formally report this (McFadden and Crowley-Henry 2018). Consequently, LGBTIQ+ people often feel unsafe at work and experience higher levels of psychological distress compared to their non-LGBTIQ+ counterparts (Deloitte 2022; Amos et al. 2023). This can impact the workforce participation and career progression of LGBTIQ+ people (WGEA 2023; Ellsworth et al. 2020).
Lack of safety to be themselves in workplace settings
The Australian Workplace Equality Index in 2022 reported that despite workplace inclusion initiatives, there has been a downward trend over the past three years of LGBTIQ+ employees disclosing their identities at work (AWEI 2022f:4). There are many reasons that people choose not to disclose their sexual or gender identity. These include fears of bias hindering career opportunities, interpersonal relationships changing, isolation, and subtle or overt discrimination (McFadden and Crowley-Henry 2018). For most LGBTIQ+ people, ‘coming out’ is an ongoing process with introductions to new workplaces, co-workers, and stakeholders. Never being certain how these conversations will go, and the continuous nature of this process, leads to ongoing stress (McFadden and Crowley-Henry 2018). However, hiding these aspects of one’s identity at work can be emotionally and psychologically exhausting (Minei et al. 2023; McFadden and Crowley-Henry 2018; State of Queensland 2017). A large number of LGBTIQ+ people in Australia expend significant energy to hide their identity, detracting from their ability to participate at work (State of Queensland 2017). Barriers are also exacerbated for LGBTIQ+ people who identify as trans or gender diverse (DCA 2018), are a person of colour (DCA and Pride in Diversity 2022), are First Nations peoples (AWEI 2022d) or are of older age (Cray 2013).
Barriers to career development and progression
Research suggests that LGBTIQ+ people are less likely to receive career development opportunities and experience barriers to progression, promotion and accessing leadership opportunities in the workplace (Webster and Adams 2023; Gedro 2009). Associations between leadership and men/masculinity also disadvantage some LGBTIQ+ people, who regardless of gender identity and sexual orientation may not conform to stereotypical understandings of masculinity (Pellegrini et al. 2020). These barriers have flow-on effects across a broad range of measures, including representation, pay equity, discrimination, and occupational segregation (Gedro 2009).
Trans, gender-diverse and intersex people face additional barriers to inclusion
While all LGBTIQ+ individuals can face inclusion challenges in the workplace, trans and gender-diverse people are especially likely to experience barriers at every stage of the employment process (Waite 2021). In 2018, the unemployment rate of trans people was 3 times that of the general population in Australia (Bretherton et al. 2021:47), a trend that is mirrored in international research (NCTE 2016:5). When they do have access to paid employment, trans and gender-diverse people are more likely to be in entry-level positions, miss out on career progression opportunities and experience social exclusion (Ellsworth et al. 2022; DET 2023). Trans and gender-diverse individuals, as well as intersex people, are also more likely to be misgendered in the workplace and encounter false assumptions about their gender, bodies, and sexuality (Ellsworth et al. 2022). This can result in privacy breaches, where a trans, gender-diverse or intersex employee’s personal information is shared with their colleagues without consent (Ellsworth et al. 2022). Privacy breaches such as these can have detrimental effects on LGBTIQ+ people’s physical and psychological safety.
Trans, gender-diverse and intersex people are more likely to experience negative behaviours at work
Trans and gender-diverse people are more likely to experience and witness negative behaviours than their other LGBTIQ+ colleagues (AHRC 2022c; Amos et al. 2023). These behaviours include discrimination, bullying and harassment, which can affect their ability to participate in the workforce (AWEI 2022b). In the last 5 years, 70% of people with intersex characteristics experienced workplace sexual harassment in Australia – the highest rate of any population examined in the Australian Human Rights Commission’s 2022 national survey (AHRC 2022c:12). Trans and gender-diverse people are more than twice as likely as cisgender people to hear sexist jokes or demeaning comments about themselves and people in their community (AWEI 2022b:7; see also Ellsworth et al. 2022). For those that formally report this harassment, only 16.2% feel that it is dealt with satisfactorily (AWEI 2022b:7). As a result of these negative behaviours in the workplace, trans and gender-diverse people are more likely to think about leaving their current employer, compared to cisgender people (AWEI 2022b).
Key workplace issues for LGBTIQ+ women
Compounding barriers to progression and promotion
LGBTIQ+ women are more likely to experience workplace disadvantage when compared to straight women and LGBTIQ+ men, or those perceived as men. LGBTIQ+ women experience a ‘double glass ceiling’ – the compounding impacts of being perceived as a woman and LGBTIQ+ – when trying to access career progression opportunities at work (ACON n.d.; AWEI 2022e; PwC and Pride in Diversity 2018). This can be seen in the Australian context, as the Australian Workplace Equality Index Survey demonstrated that only 4% of LGBTIQ+ women (both cisgender and transgender) and gender diverse respondents were in senior leadership roles or above in 2022 (AWEI 2022e:3). LGBTIQ+ women are also more likely to report that they have missed out on a raise or promotion due to their gender and sexual orientation when compared to their straight and cisgendered counterparts (AWEI 2022e; Ellsworth et al. 2022).
Unstable employment
LGBTIQ+ women are overrepresented in part-time, temporary or contract roles (AWEI 2022e:3). This overrepresentation is a contributing factor to the gender pay gap (AWEI 2022e:3). LGBTIQ+ women who are out at work feel as though they need to evidence their competence more frequently than LGBTIQ+ men and their straight colleagues (Ellsworth et al. 2022).
High levels of discrimination and sexual harassment
In 2022, nearly half of all LGBTIQ+ women experienced sexual harassment at work, a much higher rate than LGBTIQ+ men (AWEI 2022e:6; see also TUC 2019:13-17). Moreover, instances of sexual harassment towards LGBTIQ+ women are more likely to occur on a regular basis rather than as a single incident (AWEI 2022e:6). Safe and inclusive workplaces for LGBTIQ+ women that are free from discrimination and harassment support their improved workforce participation. Research from the US indicates that LGBTIQ+ women who are safe and out at work are half as likely to leave their employer and are a third more likely to plan to stay for 5 years or more (Ellsworth et al. 2022).
Victoria’s LGBTIQ+ strategy 2022-32
In 2022, the Department of Families, Fairness and Housing, the Minister for Equality and the Commissioner for LGBTIQ+ Communities published Victoria’s first whole-of-government LGBTIQ+ strategy, Pride in our Future: Victoria’s LGBTIQ+ strategy 2022-32 (the strategy). The strategy provides the vision and plan to drive gender equality and inclusion for Victoria’s diverse lesbian, gay, bisexual, trans and gender diverse, intersex and queer (LGBTIQ+) communities, within all aspects of government work over the next decade.
The vision of the strategy is that all Victorians feel safe, are healthy, have equal human rights and can live wholly and freely.
The strategy identifies 4 priority areas (outlined below), alongside action items and desired outcomes to drive equality and inclusion for Victoria’s LGBTIQ+ communities throughout all government processes and initiatives.
To acknowledge and better support the many LGBTIQ+ community members living with compounding forms of inequality, the strategy takes an intersectional approach. The development of the strategy was informed by consultations over 1600 LGBTIQ+ Victorians. Further details of the strategy can be found on the Victorian Government website.
Key priority areas in the strategy
Equal rights and freedoms
The strategy commits to creating, reviewing, and reforming laws with an equity lens. It aims to strengthen legal protections for LGBTIQ+ Victorians and reduce the harm caused by the disproportionate levels of discrimination experienced by LGBTIQ+ people. Several key actions have been undertaken to advance this goal, such as establishing a specialist legal service for LGBTIQ+ Victorians, developing and delivering the LGBTIQ+ Justice Action Plan, implementing the Equal Opportunity (Religious Exceptions) Amendment Act 2021, the Change or Suppression (Conversion) Practices Prohibition Act 2021 and commencing the Summary Offences Amendment (Nazi Symbol Prohibition) Act 2022 making it an offence to publicly display the Nazi Hakenkreuz.
Equitable, inclusive, and accessible services
To ensure all governmental decision makers and service providers recognise the needs of LGBTIQ+ community members, key actions have been identified that will improve the health and wellbeing of queer people. Progress against this goal includes delivery state-wide to help organisations to embed LGBTIQ+ inclusive practices within their workplace and services, establishing a Trans and Gender Diverse Peer Support Program and rolling out safe spaces for LGBTIQ+ young people in Western Victoria. Further work will be done over the life of the strategy to improve LGBTIQ+ specialist services, enable people with intersex variations to access the care and support they require, ensure relationship, sexuality and consent education is LGBTIQ+ inclusive, and improve public fertility care access for LGBTIQ+ families.
Visibility to inform decision making
The strategy highlights ways to improve data collection about the lives and experiences of LGBTIQ+ Victorians, and to ensure data-collection processes are inclusive. For example, improving and standardising how, and for what purpose, government departments collect personal demographic data from their employees. The focus of this work will be to define a set of consistent whole-of-Victorian Public Service collection standards and indicators that government uses in its workforce data standards reporting. The standards will be underpinned by clear and consistent approaches to why data is collected, what it is used for and how it is shared.
Through this initiative, it is expected there will be an increase in the number of organisations using inclusive data collection methods. In turn, this should amplify LGBTIQ+ voices so that their experiences can be heard by government. Key actions to achieve this goal include supporting LGBTIQ+ data and research, improving Victorian Government data standards, developing guidance materials on how to collect, analyse and report on data by government and government-funded services and increasing diverse LGBTIQ+ representation on Victorian Government boards.
Safe, strong and sustainable communities
This priority area aims to increase LGBTIQ+ people’s feeling of their value in society, which is currently at 41.4%. For LGBTIQ+ people, being a part of the community is a valued and positive part of life. It leads to better physical and mental health outcomes.
This priority area aims to build whole-of-community understanding and celebration of LGBTIQ+ people to prevent discrimination, stigma and abuse. Reducing discrimination leads to better health and wellbeing outcomes. This creates a stronger and more cohesive society where everyone experiences economic security, feels valued, is safe in public places and can enjoy participating in social and community activities, like sports and the arts. Several key actions have been outlined to achieve this, including delivering state-wide LGBTIQ+ awareness raising, as well as events and festivals that celebrate LGBTIQ+ communities, promoting self-sufficiency for the sector and reviewing and improving LGBTIQ+ inclusion in government policies, programs, and services.
CGEPS audit data: Key insights
This section reports on insights from the Commission’s 2021 workplace gender audit workforce data and the 2021 People matter survey (PMS). Workforce data is data drawn from organisations’ human resources and payroll systems. The People matter survey is an anonymous survey completed by approximately 90% of organisations with reporting obligations under the Gender Equality Act 2020 (Vic) (the Act).
LGBTIQ+ employees in the 2021 workplace gender audit
Few organisations were able to provide data regarding the sexual orientation of their employees, or employees with self-described genders.
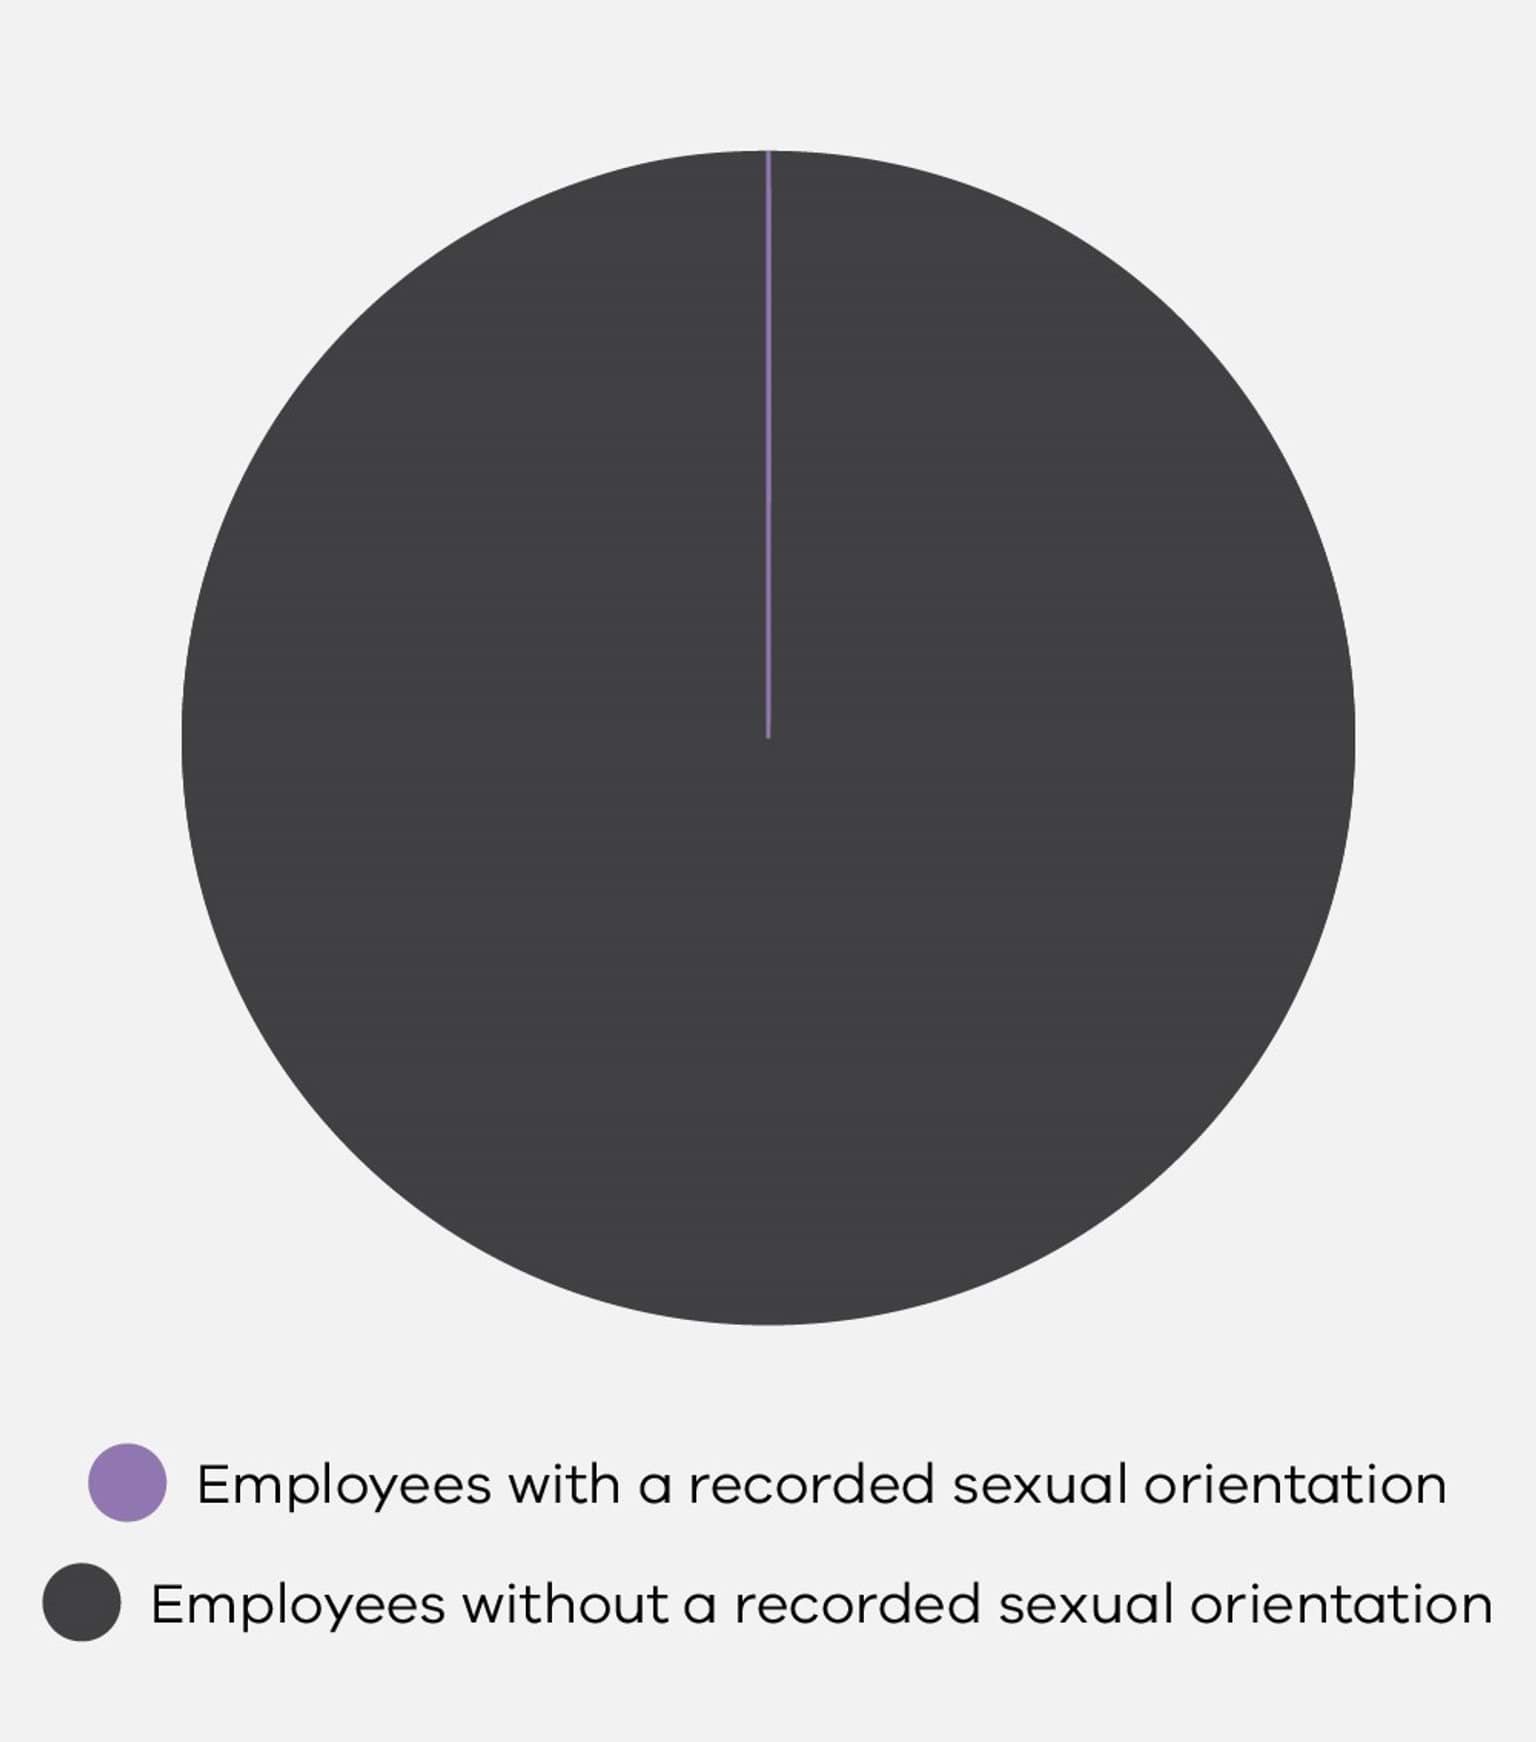
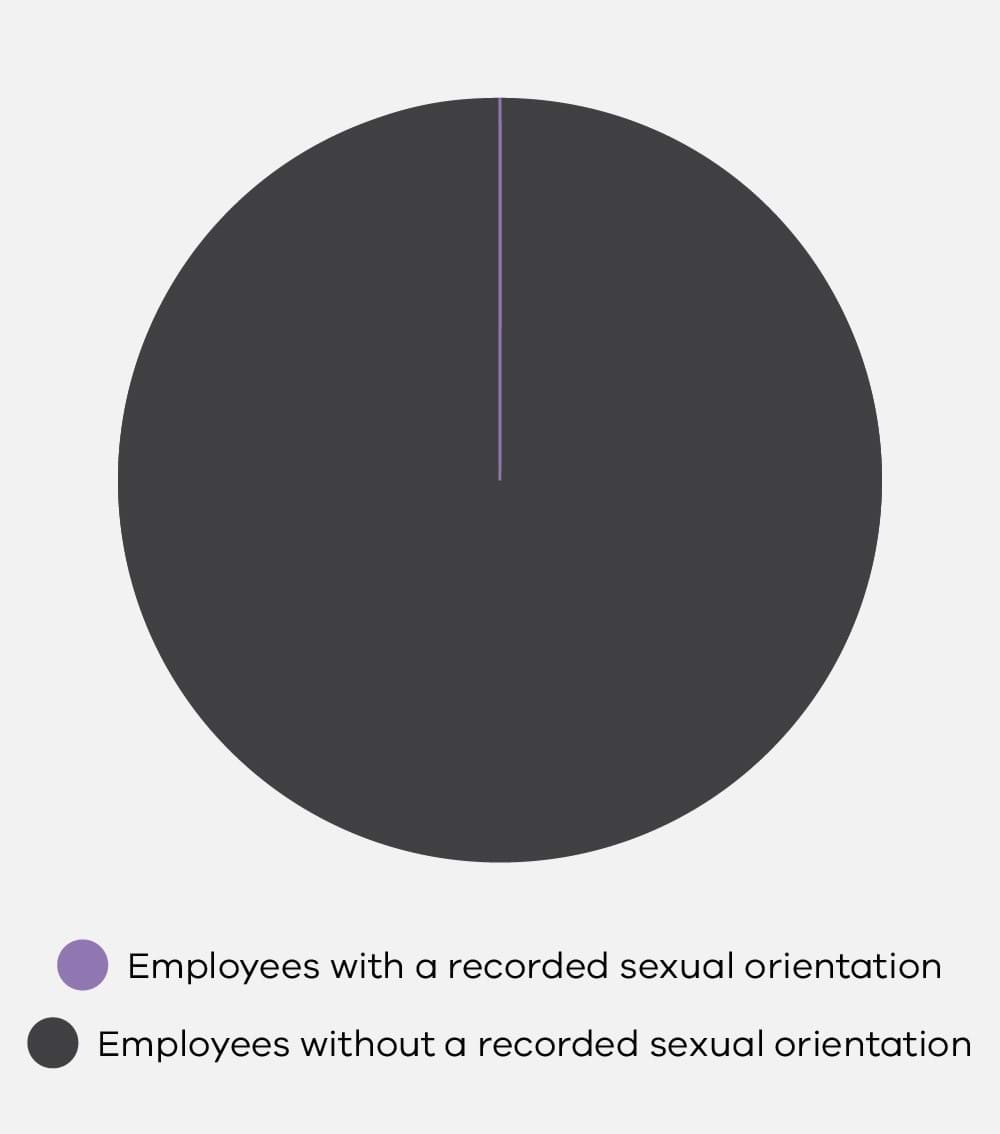
Only 6% of defined entities included any data related to sexual orientation in their workforce reporting. Across all organisations with reporting obligations in the 2021 workplace gender audit, only 0.5% of employees had a recorded sexual orientation. The remaining 99.5% of employees covered by the 2021 workforce data either had no sexual orientation recorded or worked for organisations that did not collect and store information about LGBTIQ+ identities through their workforce systems.
Figure 5.1. Availability of sexual orientation information in the workforce data, workplace gender audit 2021
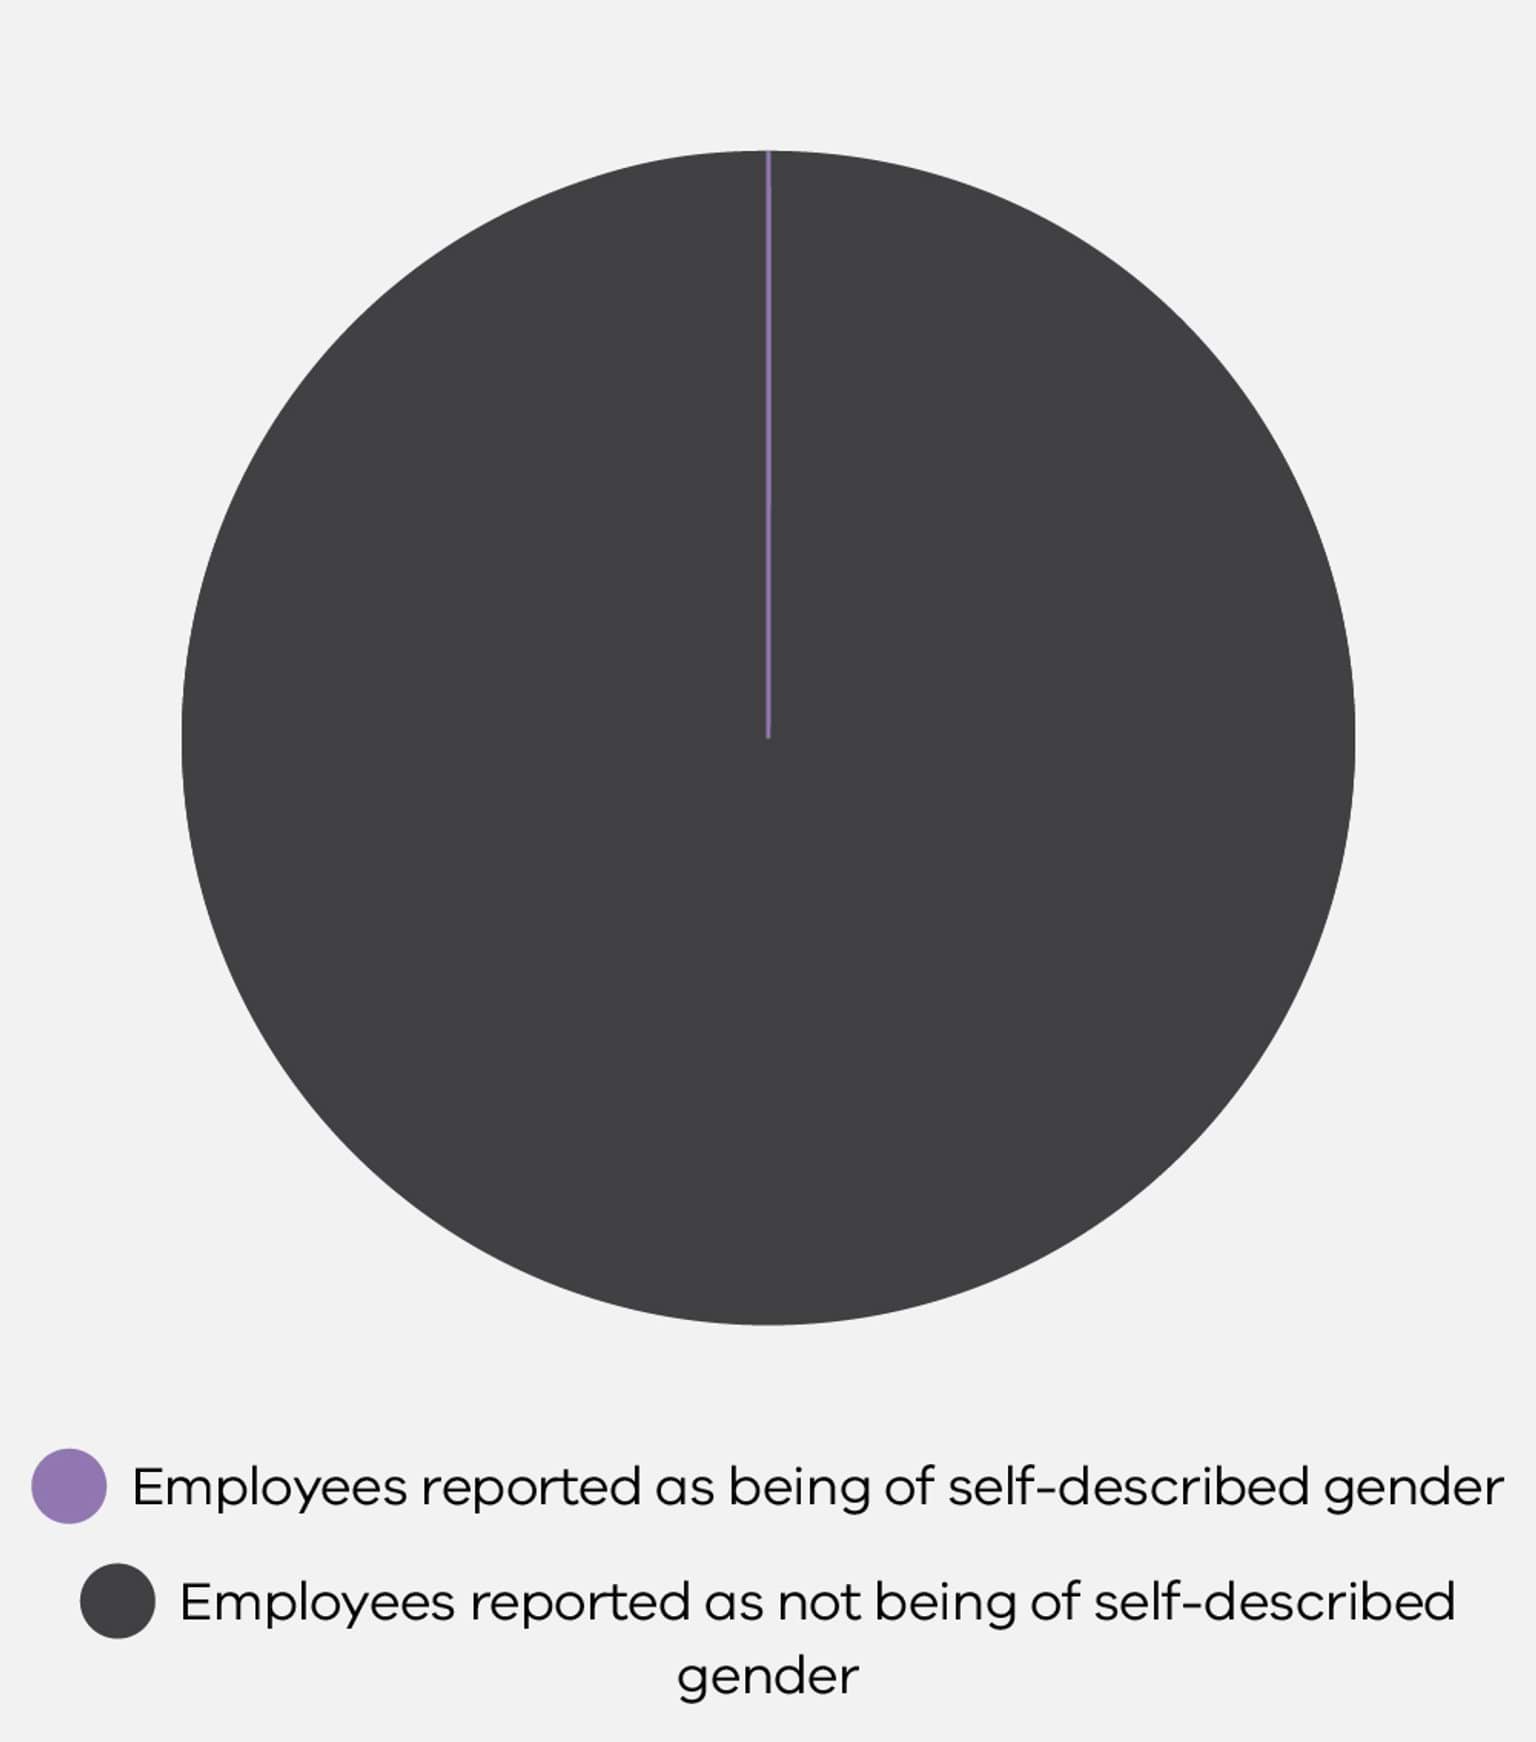
Only 0.1% of employees were reported as having self-described gender. Gender identities outside the binary are likely to be underreported due to a combination of workforce systems failing to offer gender options beyond women and men, as well as individuals not feeling safe to disclose their self-described gender to their employer (VPSC 2023d).
This lack of workforce data makes it very difficult to draw reliable conclusions. As a result, the remainder of the analysis presented in this section is derived from the 2021 People matter survey (PMS) data.
Figure 5.2. Proportion of employees who were reported as being of self-described gender
Respondents to the People matter survey reported being LGBTIQ+ at higher rates than the general population.
As illustrated in Table 5.1, 6.4% of respondents identified as asexual, bisexual, gay, lesbian, or pansexual. This figure is 1.2% higher than the level reported in the 2017 Victorian Population Health Survey. Respondents reported being trans and gender diverse at more than three times the rate of the Victorian population, though still constituted a very small percentage of the workforce at 0.64%.
| LGBTIQ+ group | PMS Respondents | Victorian population (2017) |
| Asexual | 0.4% | 0.4% |
| Bisexual or pansexual | 3% | 3% |
| Gay or lesbian | 3% | 1.8% |
| Trans, non-binary or gender diverse | 0.64% | 0.2% |
Source: 2021 workplace gender audit data (People matter survey data) Notes: Total sample of 106,069 respondents.
While the survey data was larger than the workforce data, the low number of respondents identifying as LGBTIQ+ meant that responses were too low to generate reliable results in some analyses. This was particularly the case for analyses involving transgender men. The data below includes some figures that have a wide confidence interval, meaning due to the small amount of data available, it is only possible to confidently determine a large range that they fall within. This means that sometimes percentages within a table may be closer to each other than they appear. These numbers are indicated with an asterisk (*).
Gender composition at all levels of the workforce
Lesbian women held managerial positions at similar rates to both straight men and gay men.
As Table 5.2 shows, lesbian women were equally likely to hold positions as senior managers (overseeing lower-level managers) and supervisors (managing employees who are not managers themselves) compared to both straight men and gay men.
| Sexual orientation and gender | PMS Respondents reporting senior manager roles | PMS Respondents reporting supervisor roles |
| Asexual women | 4% | 11% |
| Bisexual and pansexual women | 5% | 12% |
| Lesbian women | 12% | 17% |
| Straight women | 4% | 11% |
| Asexual men | 4%* | 8%* |
| Bisexual and pansexual men | 9% | 17% |
| Gay men | 13% | 17% |
| Straight men | 13% | 20% |
Source: 2021 workplace gender audit data (People matter survey data) Notes: Total sample of 106,069 respondents.
While lesbian women reported holding managerial positions at similar rates to straight and gay men, bisexual, pansexual and asexual women reported lower rates of both senior manager and supervisor roles, in line with straight women. Research suggests that lesbian couples more equally distribute household labour, which may contribute to their ability to develop their careers in the paid workforce (Brewster 2017). However, further research is required to fully understand the differences in rates of management roles.
Transgender women, transgender men, gender-diverse people and cisgender women were underrepresented in managerial roles, but this underrepresentation was greater for transgender women. As Table 5.3 shows, cisgender men were far more likely to hold positions as senior managers (overseeing lower-level managers) and supervisors (managing employees who are not managers themselves) than other gender identities.
| Gender identity | PMS Respondents reporting senior manager roles | PMS Respondents reporting supervisor roles |
| Transgender women | 4%* | 10% |
| Transgender men | 7%* | 13%* |
| Other trans, non-binary or gender diverse | 5% | 14% |
| Cisgender women | 7% | 15% |
| Cisgender men | 13% | 20% |
Source: 2021 workplace gender audit data (People matter survey data) Notes: Total sample of 106,069 respondents.
Lesbian women were slightly less likely to work part time than straight women, while transgender women were equally likely to work part time as cis-gendered women.
As Table 5.4 shows, 27% of lesbian women reported working part time. This is much lower than straight women, at 45%. However, lesbian women were more than twice as likely than straight men, and much more likely than gay men, to work part time.
Bisexual, pansexual, and asexual women had similar part-time work rates to straight women, while men identifying as gay, bisexual, pansexual, and asexual were more likely to work part-time (16%) compared to straight men (12%).
| Sexual orientation and gender | PMS Respondents reporting part-time employment |
| Asexual women | 38% |
| Bisexual and pansexual women | 38% |
| Lesbian women | 27% |
| Straight women | 45% |
| Asexual men | 21%* |
| Bisexual and pansexual men | 16% |
| Gay men | 16% |
| Straight men | 12% |
Source: 2021 workplace gender audit data (People matter survey data) Notes: Total sample of 106,069 respondents.
Table 5.5 shows that transgender women reported working part time at almost the same rate as cisgender women. Non-binary people and transgender men were also more likely to work part time compared to cisgender men, but less likely than cisgender women.
| Gender identity | PMS Respondents reporting part-time employment |
| Transgender women | 45% |
| Transgender men | 19% |
| Other trans, non-binary or gender diverse | 30% |
| Cisgender women | 44% |
| Cisgender men | 12% |
Source: 2021 workplace gender audit data (People matter survey data) Notes: Total sample of 106,069 respondents.
Gender pay equity
Women across different sexuality groups were more likely to be overrepresented in lower income brackets and underrepresented in higher income brackets than men, regardless of sexuality.
The only exception to this trend was lesbian women, who on average had higher salaries than bisexual and pansexual men. Respondents to the People matter survey 2021, from which this data is drawn, were able to select their yearly income from salary brackets increasing in $10,000 increments. These ranged from ‘Less than $45,000’, followed by ‘$45,000-$54,999’, through to ‘$175,000-$184,999’ and finally ‘$185,000 or more’. Respondents were also given the option to select ‘Prefer not to say’. Table 5.6 shows these salary options rolled up into $30,000 groupings.
The average annual full-time salary in Australia, based on the ABS full-time weekly earnings in November 2021, was approximately $91,000 (ABS 2022b). While the options provided to respondents in the People matter survey do not allow analysis of salaries above or below $91,000 specifically, Table 5.6 shows that women of all sexual orientations were more likely than straight and gay men to report a full-time equivalent salary of less than $95,000. Bisexual and pansexual women (60%) and asexual men (61%) had the highest rates of salaries under $95,000 of any group in the table.
| Salary Range | Asexual women | Bisexual or pansexual women | Lesbian women | Straight women | Asexual men | Bisexual or pansexual men | Gay men | Straight men |
| Less than $65,000 | 24%* | 23% | 12% | 23% | 15%* | 16% | 9% | 10% |
| $65,000 – 94,999 | 40%* | 37% | 33% | 32% | 46%* | 31% | 32% | 28% |
| $95,000 –$124,000 | 23%* | 22% | 29% | 22% | 25%* | 30% | 32% | 28% |
| $125,000 –$154,999 | 4%* | 4% | 8% | 5% | 4%* | 9% | 10% | 11% |
| $155,000 –$184,999 | 2%* | 2% | 4% | 2% | 0%* | 3% | 5% | 5% |
| Over $185,000 | 0%* | 1% | 5% | 2% | 2%* | 3% | 5% | 6% |
| Prefer not to say | 5%* | 5% | 6% | 10% | 6%* | 5% | 4% | 9% |
| Unanswered | 3%* | 7% | 4% | 5% | 2%* | 4% | 4% | 3% |
Source: 2021 workplace gender audit data (People matter survey data) Notes: Total sample of 106,069 respondents.
Table 5.6 also shows that lesbian women were significantly more likely than other women to report salaries at the higher end of the scale, over $125,000, at 17%, compared to 9% of straight women and 7% of bisexual or pansexual women. Straight men were most likely to report these salaries, at 22%.
Trans, non-binary and gender-diverse employees were more likely to be overrepresented in lower income brackets and underrepresented in higher income brackets when compared to cisgender men.
As Table 5.7 shows, transgender women were the most likely gender identity to report salaries below $95,000, at 64%, compared to 38% for cisgender men. Cisgender women were next most likely to report salaries under $95,000, at 54%.
| Salary Range | Transgender women | Transgender men | Other trans, non-binary or gender diverse | Cisgender women | Cisgender men |
| Less than $65,000 | 28% | 17% | 18% | 22% | 10% |
| $65,00 – 94,999 | 36% | 36% | 29% | 32% | 28% |
| $95,000 –$124,999 | 16% | 20% | 18% | 22% | 28% |
| $125,000 –$154,999 | 5% | 9% | 4% | 4% | 11% |
| $155,000 –$184,999 | 2% | 3% | 1% | 2% | 5% |
| Over $185,000 | 2% | 3% | 2% | 2% | 5% |
| Prefer not to say | 6% | 7% | 23% | 11% | 10% |
| Unanswered | 8% | 8% | 5% | 5% | 4% |
Source: 2021 workplace gender audit data (People matter survey data) Notes: Total sample of 106,069 respondents.
At the higher end of the income scale, non-binary and gender diverse employees were the least likely of the groups listed in the table to report salaries above $125,000 at 7%, compared to a similar rate of 8% for cisgender women. Cisgender men reported salaries over $125,000 at 3 times the rate of other trans, non-binary or gender diverse people, at 21%.
The estimated pay gap at the all-industry level was largest between straight women, and men, regardless of sexual orientation.
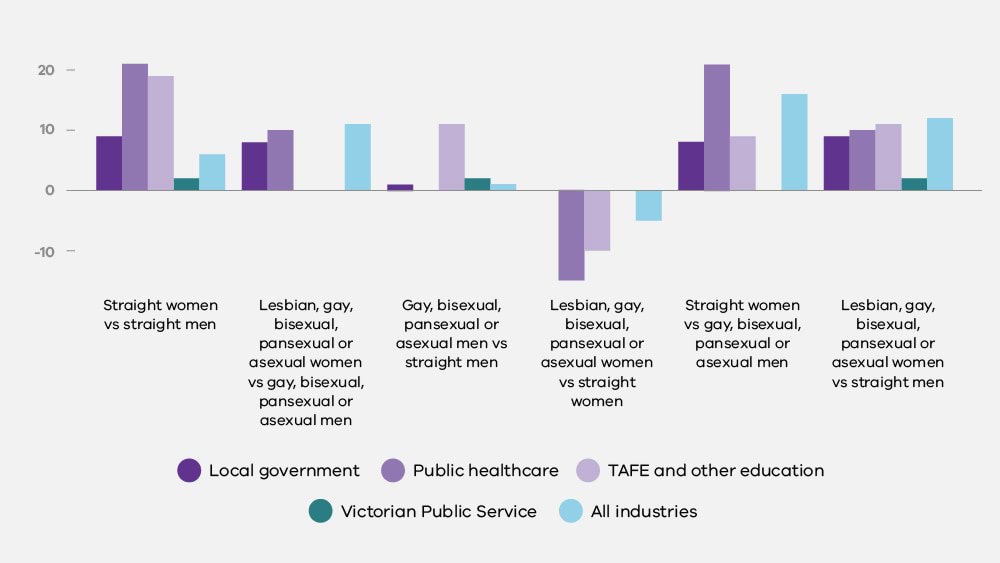
As set out in Table 5.8, at the all-industry level, estimated pay gaps were largest between straight women and men, regardless of sexual orientation, at 16%. Across all of the industry groups with sufficient data, pay gaps were largest or equal largest between straight women and straight men. In the Public healthcare sector, this gap was largest, at 21% (equal with the pay gap between straight women and asexual, bisexual, pansexual and gay men). The Victorian Public Service industry had the smallest gap between straight men and women, at 2%.
The pay gaps presented here are estimates, produced using a combination of salary bracket data from the People matter survey, outlined above, and the Commission’s workforce remuneration data. This is because the workforce data is not comprehensive enough to produce reliable pay gap calculations based on actual salaries. Please see the Introduction to this report for further detail on the approach taken.
| Industry | Local government | Public healthcare | TAFE and other education | Victorian Public Service | All industries |
| Straight women vs straight men | 9% | 21% | 19% | 2% | 16% |
| Lesbian, gay, bisexual, pansexual or asexual women vs gay, bisexual, pansexual or asexual men | 8% | 10% | 0% | 0% | 11% |
| Gay, bisexual, pansexual or asexual men vs straight men | 1% | 0% | 11% | 2% | 1% |
| Lesbian, gay, bisexual, pansexual or asexual women vs straight women | 0% | -15% | -10% | 0% | -5% |
| Straight women vs gay, bisexual, pansexual or asexual men | 8% | 21% | 9% | 0% | 16% |
| Lesbian, gay, bisexual, pansexual or asexual women vs straight men | 9% | 10% | 11% | 2% | 12% |
Source: 2021 workplace gender audit data (People matter survey data) Notes: Total sample of 106,069 respondents.
Figure 5.3. Estimated pay gaps by comparator groups and industry. Figure

While there was a pay gap between straight women and men across all four industry groupings and at the all-industry level, lesbian, gay, bisexual, pansexual and asexual women actually reported a significant pay gap in their favour when compared to straight women in the Public healthcare (15%) and TAFE and other education industries (10%). In the Local government and Victorian Public Service industries, there was no gap between these two groups.
The relatively higher salaries of non-straight women as compared to straight women suggest that, as in the leadership section above, perhaps expectations around the heterosexual division of labour impact straight women’s career progression and earning potential. For straight women, a male partner’s career may be prioritised, with more domestic labour and care work falling to the woman (Jones 2019; KPMG 2021). This division of labour may be less stark in LGBTIQ+ relationships. Further research is required to understand the drivers of the pay gaps and leadership role differences found here.
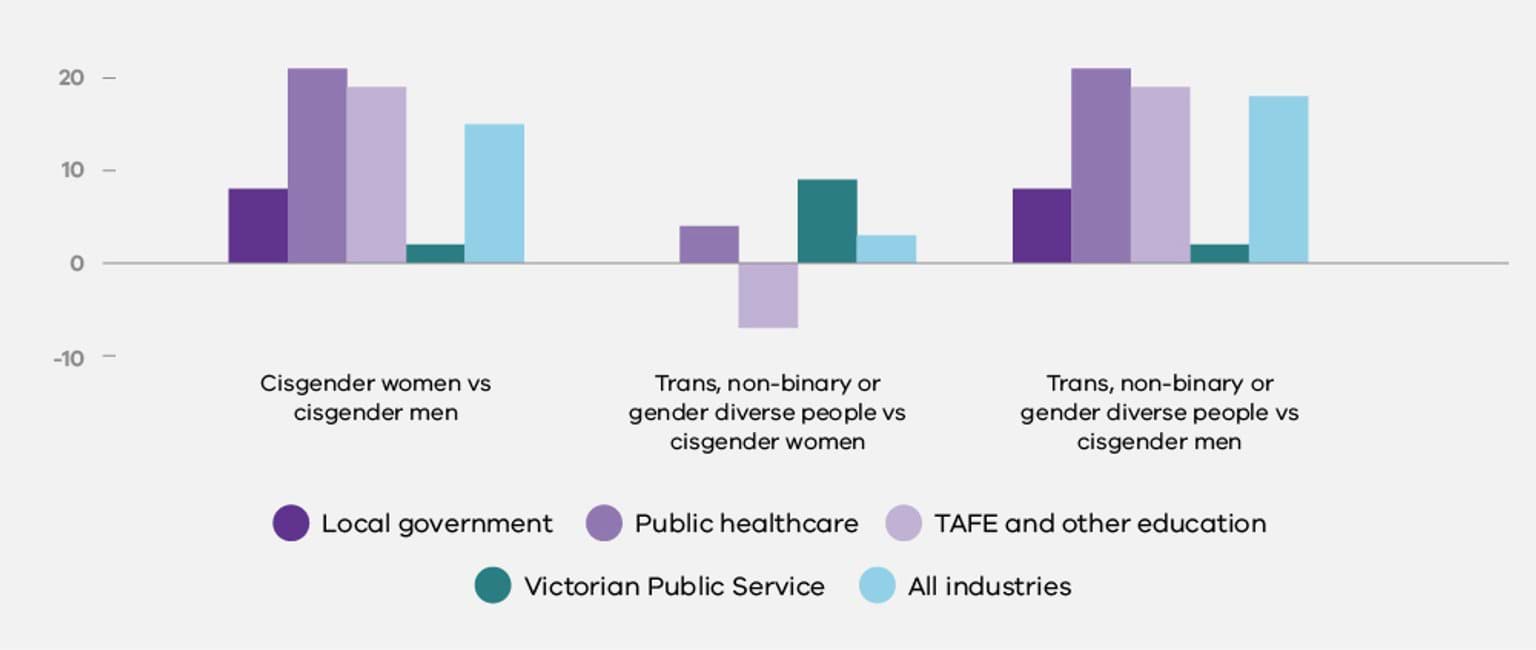
The estimated pay gap for different gender identities was largest between trans, non-binary or gender diverse people and cisgender men.
As set out in Table 5.9, at the all-industry level, the estimated pay gap was largest between trans, non-binary or other gender diverse people and cisgender men, at 18%. Across the four industries with sufficient data, the largest estimated pay gaps of 21% were found in the Public healthcare sector between cisgender women and cisgender men, as well as trans, non-binary or other gender diverse people and cisgender men. There tended to be smaller pay gaps between trans, non-binary or gender diverse people and cisgender women, with only a 3% pay gap across all industries.
| Industry | Local government | Public healthcare | TAFE and other education | Victorian Public Service | All industries |
| Cisgender women vs cisgender men | 8% | 21% | 19% | 2% | 15% |
| Trans, non-binary or gender diverse people vs cisgender women | 0% | 4% | -7% | 9% | 3% |
| Trans, non-binary or gender diverse people vs cisgender men | 8% | 21% | 19% | 2% | 18% |
Source: 2021 workplace gender audit data (People matter survey data) Notes: Total sample of 106,069 respondents.
Workplace sexual harassment and discrimination
LGBTIQ+ respondents reported experiencing sexual harassment at disproportionately higher rates than their straight and cisgendered colleagues.
As Table 5.10 shows, gay men were more than twice as likely to report experiencing sexual harassment at work in the past 12 months compared to straight men. Asexual men were five times as likely to report experiencing sexual harassment than straight men. All non-heteronormative women reported sexual harassment at higher rates than their straight colleagues, with bisexual and pansexual women reporting the highest rates at 14%.
The People matter survey 2021 was conducted during the COVID-19 pandemic. This was when many people were working from home (except for essential workers, such as healthcare workers). This means that there might have been a potential decrease in certain types of sexual harassment between workers. However, it remains unclear how much the COVID-19 pandemic impacted these numbers.
| Sexual orientation and gender | PMS Respondents reporting sexual harassment |
| Asexual women | 11% |
| Bisexual and pansexual women | 14% |
| Lesbian women | 10% |
| Straight women | 6% |
| Asexual men | 15%* |
| Bisexual and pansexual men | 12% |
| Gay men | 7% |
| Straight men | 3% |
Source: 2021 workplace gender audit data (People matter survey data) Notes: Total sample of 106,069 respondents.
The two most common types of sexual harassment reported, regardless of gender or sexual orientation, were ‘Intrusive questions about my private life or comments about my physical appearance’ and ‘Sexually suggestive comments or jokes that made me feel offended’.
Trans and gender-diverse respondents reported experiencing sexual harassment at noticeably higher rates than their cisgendered colleagues.
As shown in Table 5.11, transgender women reported experiencing sexual harassment at the highest rates of any gender identity (16%), followed closely by other trans, non-binary or gender diverse respondents at 15%. Transgender men also reported higher rates of sexual harassment at 8%, as compared to both cisgender women (6%) and cisgender men (4%).
| Gender identity | PMS Respondents reporting experiencing sexual harassment |
| Transgender women | 16%* |
| Transgender men | 8%* |
| Other trans, non-binary or gender diverse | 15% |
| Cisgender women | 6% |
| Cisgender men | 4% |
Source: 2021 workplace gender audit data (People matter survey data) Notes: Total sample of 106,069 respondents.
The two most common types of sexual harassment reported, regardless of gender identity, were ‘Intrusive questions about my private life or comments about my physical appearance’ and ‘Sexually suggestive comments or jokes that made me feel offended’. There was some small variation between genders as to which of these two answers was most commonly reported.
Lesbian, gay, bisexual, pansexual and asexual people reported experiencing discrimination at higher rates than straight people, regardless of gender.
As set out in Table 5.12, below, people with non-heteronormative sexual orientations were more likely to report discrimination in the workplace when compared to straight respondents.
| Sexual orientation and gender | PMS Respondents reporting discrimination |
| Asexual women | 7%* |
| Bisexual and pansexual women | 8% |
| Lesbian women | 7% |
| Straight women | 5% |
| Asexual men | 11%* |
| Bisexual and pansexual men | 9.9% |
| Gay men | 6% |
| Straight men | 5% |
Source: 2021 workplace gender audit data (People matter survey data) Notes: Total sample of 106,069 respondents.
The most common type of discrimination reported was being denied opportunities for promotion, except for bisexual and pansexual women, who most commonly reported being denied flexible work arrangements or other adjustments.
Gender-diverse individuals reported facing higher rates of discrimination compared to cisgender people.
Trans and gender-diverse respondents to the People matter survey were approximately 2-3 times more likely than their cisgender colleagues to report experiencing discrimination. As Table 5.13 shows, other trans, non-binary and gender diverse people reported experiencing discrimination at the highest rate of 17%, or approximately three times their cisgender peers. Transgender women reported the next highest rate of experiencing discrimination at 15%, followed by transgender men at 10%. This suggests that people who live outside of cisgender expectations are significantly more likely to experience discrimination in Victorian public sector workplaces.
| Gender identity | PMS Respondents reporting discrimination |
| Transgender women | 15% |
| Transgender men | 10%* |
| Other trans, non-binary or gender diverse | 17% |
| Cisgender women | 5% |
| Cisgender men | 6% |
Source: 2021 workplace gender audit data (People matter survey data) Notes: Total sample of 106,069 respondents.
Recruitment and promotion practices
Gay men, and bisexual, pansexual and straight women, were the most likely to agree that recruitment and promotion decisions in their organisations were fair.
As Table 5.14 shows, gay men were most likely to agree with the statement ‘My organisation makes fair recruitment and promotion decisions, based on merit’, at 57%. Bisexual and pansexual women followed close behind at 56%, with straight women at 55%. Straight women, asexual women, and bisexual and pansexual women were least likely to disagree, at 17% each.
| Sexual orientation and gender | My organisation makes fair recruitment and promotion decisions, based on merit | |
| Strongly agree or agree | Strongly disagree or disagree | |
| Asexual women | 47% | 17% |
| Bisexual and pansexual women | 56% | 17% |
| Lesbian women | 52% | 21% |
| Straight women | 55% | 17% |
| Asexual men | 52% | 21% |
| Bisexual and pansexual men | 50% | 24% |
| Gay men | 57% | 20% |
| Straight men | 53% | 22% |
Source: 2021 workplace gender audit data (People matter survey data) Notes: Total sample of 106,069 respondents. ‘Neither agree nor disagree’ and ‘Don’t know’ response options are not included in the table.
Non-binary and gender-diverse people were least likely of any gender identity to agree that recruitment and promotion decisions in their organisations were fair.
As Table 5.15 shows, other trans, non-binary or gender diverse people had low levels of confidence in the fairness of recruitment and promotion decisions in their organisations, with marginally more respondents disagreeing with the statement (35%) than agreeing (34%). Transgender men had the next lowest levels of agreement at 48%, while cisgender women had the highest levels, at 54%.
| Gender identity | My organisation makes fair recruitment and promotion decisions, based on merit | |
| Strongly agree or agree | Strongly disagree or disagree | |
| Transgender women | 52%* | 22%* |
| Transgender men | 48%* | 21%* |
| Other trans, non-binary or gender diverse | 34% | 35% |
| Cisgender women | 54% | 17% |
| Cisgender men | 52% | 22% |
Source: 2021 workplace gender audit data (People matter survey data) Notes: Total sample of 106,069 respondents. ‘Neither agree nor disagree’ and ‘Don’t know’ response options are not included in the table.
Asexual people, as well as bisexual and pansexual men, were least likely of any sexual orientation to agree that they had an equal chance at promotion in their organisations.
As Table 5.16 shows, gay men (51%) had the highest levels of agreement with the statement ‘I feel I have an equal chance at promotion in my organisation’, while asexual women agreed least often (38%).
| Sexual orientation and gender | I feel I have an equal chance at promotion in my organisation | |
| Strongly agree or agree | Strongly disagree or disagree | |
| Asexual women | 38%* | 32%* |
| Bisexual and pansexual women | 46% | 28% |
| Lesbian women | 48% | 25% |
| Straight women | 46% | 24% |
| Asexual men | 42%* | 31%* |
| Bisexual and pansexual men | 43% | 33% |
| Gay men | 51% | 25% |
| Straight men | 47% | 26% |
Source: 2021 workplace gender audit data (People matter survey data) Notes: Total sample of 106,069 respondents. ‘Neither agree nor disagree’ and ‘Don’t know’ response options are not included in the table.
Non-binary and gender-diverse people were least likely of any gender identity to agree that they had an equal chance at promotion in their organisations.
As Table 5.17 shows, other trans, non-binary and gender diverse people had low confidence in their equal consideration for promotion in their organisations, with only 30% agreeing that they would have an equal chance at promotion and 45% disagreeing. All other gender identities reported notably higher levels of agreement and lower levels of disagreement. Transgender men and straight men had the highest levels of agreement, at 46%.
| Gender identity | I feel I have an equal chance at promotion in my organisation | |
| Strongly agree or agree | Strongly disagree or disagree | |
| Transgender women | 40%* | 35%* |
| Transgender men | 46%* | 28%* |
| Other trans, non-binary or gender diverse | 30% | 45% |
| Cisgender women | 45% | 25% |
| Cisgender men | 46% | 27% |
Source: 2021 workplace gender audit data (People matter survey data) Notes: Total sample of 106,069 respondents. ‘Neither agree nor disagree’ and ‘Don’t know’ response options are not included in the table.
Flexible work practices
Women were more likely than men with the same sexual orientation to report working flexibly, with bisexual and pansexual women reporting the highest rates of flexible working arrangements.
Women reported noticeably higher levels of flexible working arrangements than men. However, bisexual, pansexual, asexual and gay men were more likely to report use of flexible work options than straight men. Table 5.18 illustrates the proportion of respondents in each group who reported accessing flexible work opportunities.
| Sexual orientation and gender | PMS Respondents reporting flexible work |
| Asexual women | 31%* |
| Bisexual and pansexual women | 36% |
| Lesbian women | 29% |
| Straight women | 31% |
| Asexual men | 29%* |
| Bisexual and pansexual men | 30% |
| Gay men | 24% |
| Straight men | 22% |
Source: 2021 workplace gender audit data (People matter survey data) Notes: Total sample of 106,069 respondents.
Women, apart from asexual women, most often reported using flexible start and finish times. Asexual women most frequently reported working part-time. Asexual and gay men also reported using flexible start and finish times most often, while bisexual, pansexual and straight men most often reported working part time.
Transgender women, cisgender women and gender-diverse people were more likely to report flexible work arrangements.
Gender-diverse people and women (regardless of whether they are cisgender or transgender) were more likely to report flexible work arrangements compared to cisgender men and transgender men. Transgender women and gender-diverse people were slightly more likely to report using flexible work than cisgender women. Transgender men and cisgender men reported flexible work arrangements at similar rates to each other.
| Gender identity | PMS Respondents reporting flexible work |
| Transgender women | 36% |
| Transgender men | 24% |
| Other trans, non-binary or gender diverse | 33% |
| Cisgender women | 31% |
| Cisgender men | 22% |
Source: 2021 workplace gender audit data (People matter survey data) Notes: Total sample of 106,069 respondents.
The most common type of flexible work reported by cisgender men was working ‘Part-time’. For every other gender identity, ‘Flexible start and finish times’ were reported most often.
Discussion and conclusion
This chapter highlights the importance of considering the varied experiences and circumstances of LGBTIQ+ people in the workplace. It also highlights the need for organisations to improve data collection on the basis of both sexuality and diverse gender identity.
The lack of workforce data on gender identity and sexual orientation has meant that this analysis has relied on survey data that is not linked to employee records. The impact of this is that the Commission was unable to explore the access to training and other professional development and promotion opportunities, and occupational and industrial segregation experienced by, people of different gender identities and sexualities in Victorian public sector organisations. The Commission also had to estimate pay gaps rather than being able to rely on precise salary data.
Consistent with previous research, the analysis of the 2021 People matter survey and workforce gender audit data shows how gender inequality compounds with other discrimination against many LGBTIQ+ people to cause avoidable harm, hinder career progression and contribute to the gender pay gap (ACON n.d.; AWEI 2022e; PwC and Pride in Diversity 2018). These issues must be addressed to achieve meaningful equality for LGBTIQ+ and gender-diverse people in the Victorian public sector.
The Commission’s data shows notable variation in the rates of management roles held by different members of the LGBTIQ+ community. Lesbian women report holding managerial positions at similar rates to both straight men and gay men. This is a notable departure from the existing literature, which suggests that many LGBTIQ+ women believe their career progression is hindered by discrimination (AWEI 2022e; Ellsworth et al. 2022). Similarly, fewer lesbian women report working part-time compared to women of all other sexual orientations, despite the existing research suggesting that queer women are overrepresented in part-time work (AWEI 2022e).
Alternatively, bisexual, pansexual and asexual women report being in supervisor and manager roles less frequently than lesbian women, at a comparable rate to straight women. It may be that traditional gender expectations of women are more present in relationships which may involve men, rather than those between women, impacting the career progression of some bisexual, pansexual, and potentially asexual women (e.g. Brewster 2017). Similarly, the data shows that lesbian women within the Victorian public sector are slightly less likely to work part time than straight women, while transgender women are equally likely to work part time as cisgender women.
Reported salaries vary across sexual orientation and gender identity. Trans and gender diverse people consistently report lower salaries than their cisgender colleagues, while women are more likely to report lower salaries than men with the same sexual orientation. These findings are reflective of the diverse and compounding experiences of inequality across the LGBTIQ+ community. However, within these broad trends there is some variation. For example, lesbians generally report higher salaries than women with other sexual orientations. Transgender men report higher salaries than other trans and gender diverse respondents and cisgender women, while transwomen are noticeably overrepresented in lower salary brackets. Additional research is needed to understand how factors such as traditional gender roles (e.g. Shamloo et al. 2022), as well as acute stressors experienced by transgender women and gender diverse people, may impact the ability of particular groups of people to advance their careers.
Despite inequalities in access to management roles and higher salaries, most LGBTIQ+ respondents report similar levels of agreement to their straight and cisgendered colleagues that recruitment and promotion processes in their organisations are fair and equal. However, other trans, non-binary and gender diverse people were a notable exception to this trend.
The Commission’s data reveals that LGBTIQ+ respondents report experiencing sexual harassment and discrimination at higher rates compared to their straight and cisgendered colleagues. This is in line with previous research demonstrating that members of the LGBTIQ+ community face elevated rates of sexual harassment and discrimination across multiple areas of their lives, including in employment (e.g. Casey et al. 2019; Deloitte 2022). While further research is needed to fully understand, and therefore address, the drivers of these negative behaviours towards LGBTIQ+ workers, they may be a response to queer people deviating from cisgendered, heterosexual norms (e.g. Brassel et al. 2019).
While this chapter highlights some major areas of concern in the treatment of LGBTIQ+ employees, there is still a large gap in data collection regarding both sexuality and gender identity outside the binary. To adequately support their LGBTIQ+ employees and identify areas for improvement, Victorian public sector organisations should work to improve data collection processes and actively address any biases held by their employees.
Figure 5.4. Estimated pay gaps by comparator groups and industry.
- Cisgendered means that an individual’s gender identity is consistent with their biological sex (Victorian Government 2022b).
Updated