

Introduction
Workplace sexual harassment remains widespread and persistent. Research collected over the past five decades confirms that it occurs in every industry and at all levels of the workforce, with 39% of Australian women and 26% of Australian men having experienced sexual harassment in the workplace in the five years to 2018.116 Seventy-nine per cent of these experiences of workplace sexual harassment were reported to have been perpetrated by men.117
The most frequently reported types of sexually harassing behaviour are sexually suggestive comments or jokes and intrusive questions about a person’s private life or physical appearance.118 Sexual harassment behaviour also includes repeated unwanted invitations to go on dates or pressure for sex, leering, unwelcome touching, cornering, or hugging, sexually explicit emails, phone calls or text messages and actual or attempted rape or sexual assault.119
Key issues: Why was this measured?
Gender inequality drives workplace sexual harassment
Gender inequality – that is, structural and social power disparities between genders – is the key driver of sexual harassment.120
Other forms of disadvantage and discrimination can intersect with gender inequality to magnify power imbalances that can also drive sexual harassment.121 In a 2018 national survey 45% of young people aged 18–29 years, 55% of Aboriginal women, 52% of people with diverse sexual orientations and 52% of women living with disability reported that they had experienced workplace sexual harassment in the preceding 5 years.122
Workplace culture and settings influence prevalence
In addition to the foundational drivers of sexual harassment, poor workplace culture, a lack of understanding about what constitutes workplace sexual harassment, and the use of alcohol in a work context, also play a critical role in contributing to the prevalence of workplace sexual harassment.123
Sexual harassment is also more prevalent in workplaces that are organised by a rigid hierarchy (such as police, legal and medical organisations), where men are over-represented in the workforce and/or over-represented in senior leadership roles, and in which the nature of the work is considered non-traditional for women. It is also more prevalent in workplaces that involve a lot of contact with patients, clients, or customers (such as social assistance and healthcare).124
Workplace sexual harassment is harmful
At the individual level, the impacts of sexual harassment can be life changing. The physical and psycho-social harms associated with workplace sexual harassment can compromise a victim-survivor’s long-term workforce participation, job satisfaction and productivity – and therefore their economic security.125
In addition to organisational impacts such as staff turnover and financial and legal costs associated with complaints, workplace sexual harassment also impacts workplace cultures and reputations.126
Workplace sexual harassment significantly impacts our economy. Deloitte Access Economics estimated that workplace sexual harassment cost the Australian economy $3.8 billion in 2018. Employers bore 70% of these financial costs, government 23% and individuals 7%.127
There are many barriers to formal reporting for victims
Research has continued to find that formal reporting of workplace sexual harassment is low, with the Australian Human Rights Commission’s 2018 Respect@Work National Inquiry finding that only 17% of respondents made a formal complaint about the sexual harassment they had experienced.128 Key barriers to reporting included fear of victimisation, a concern that others would think the victim was overreacting, uncertainty as to what amounts to sexual harassment, a perception that the behaviour was commonplace or accepted, and a lack of confidence in the effectiveness and/or confidentiality of the employer’s reporting system.129
How was this indicator measured?
Organisations covered by the Act were required to provide the following workforce data over the period from 1 July 2020 to 30 June 2021:
- the number and nature of formal sexual harassment complaints made, disaggregated in various ways, such as by gender, intersectionality attributes and the complainant’s relationship to the organisation (whether they were an employee, governing body member, member of the public alleging harassment by a staff member or other).130
- the outcomes of any formal sexual harassment complaints, including any settlement and/or non-disclosure agreements, and the overall satisfaction with these outcomes.
In addition, employees of defined entities were invited to participate in a standardised employee experience survey. Organisations were surveyed separately, and the results were reported to the Commission as percentages of respondents. Items with fewer than 10 responses were suppressed to protect respondents’ privacy.
The Commission measured this indicator from responses to questions about:
- The experience of sexual harassment in the previous 12 months and whether this was formally reported or not (disaggregated by gender and other intersectional attributes)
- If sexual harassment was experienced but not formally reported, the reasons for this (disaggregated by gender and other intersectional attributes)
- Complaint handling and outcome satisfaction
- Bystander actions
- Workplace cultures
What was found: Key data insights
Experiences of sexual harassment
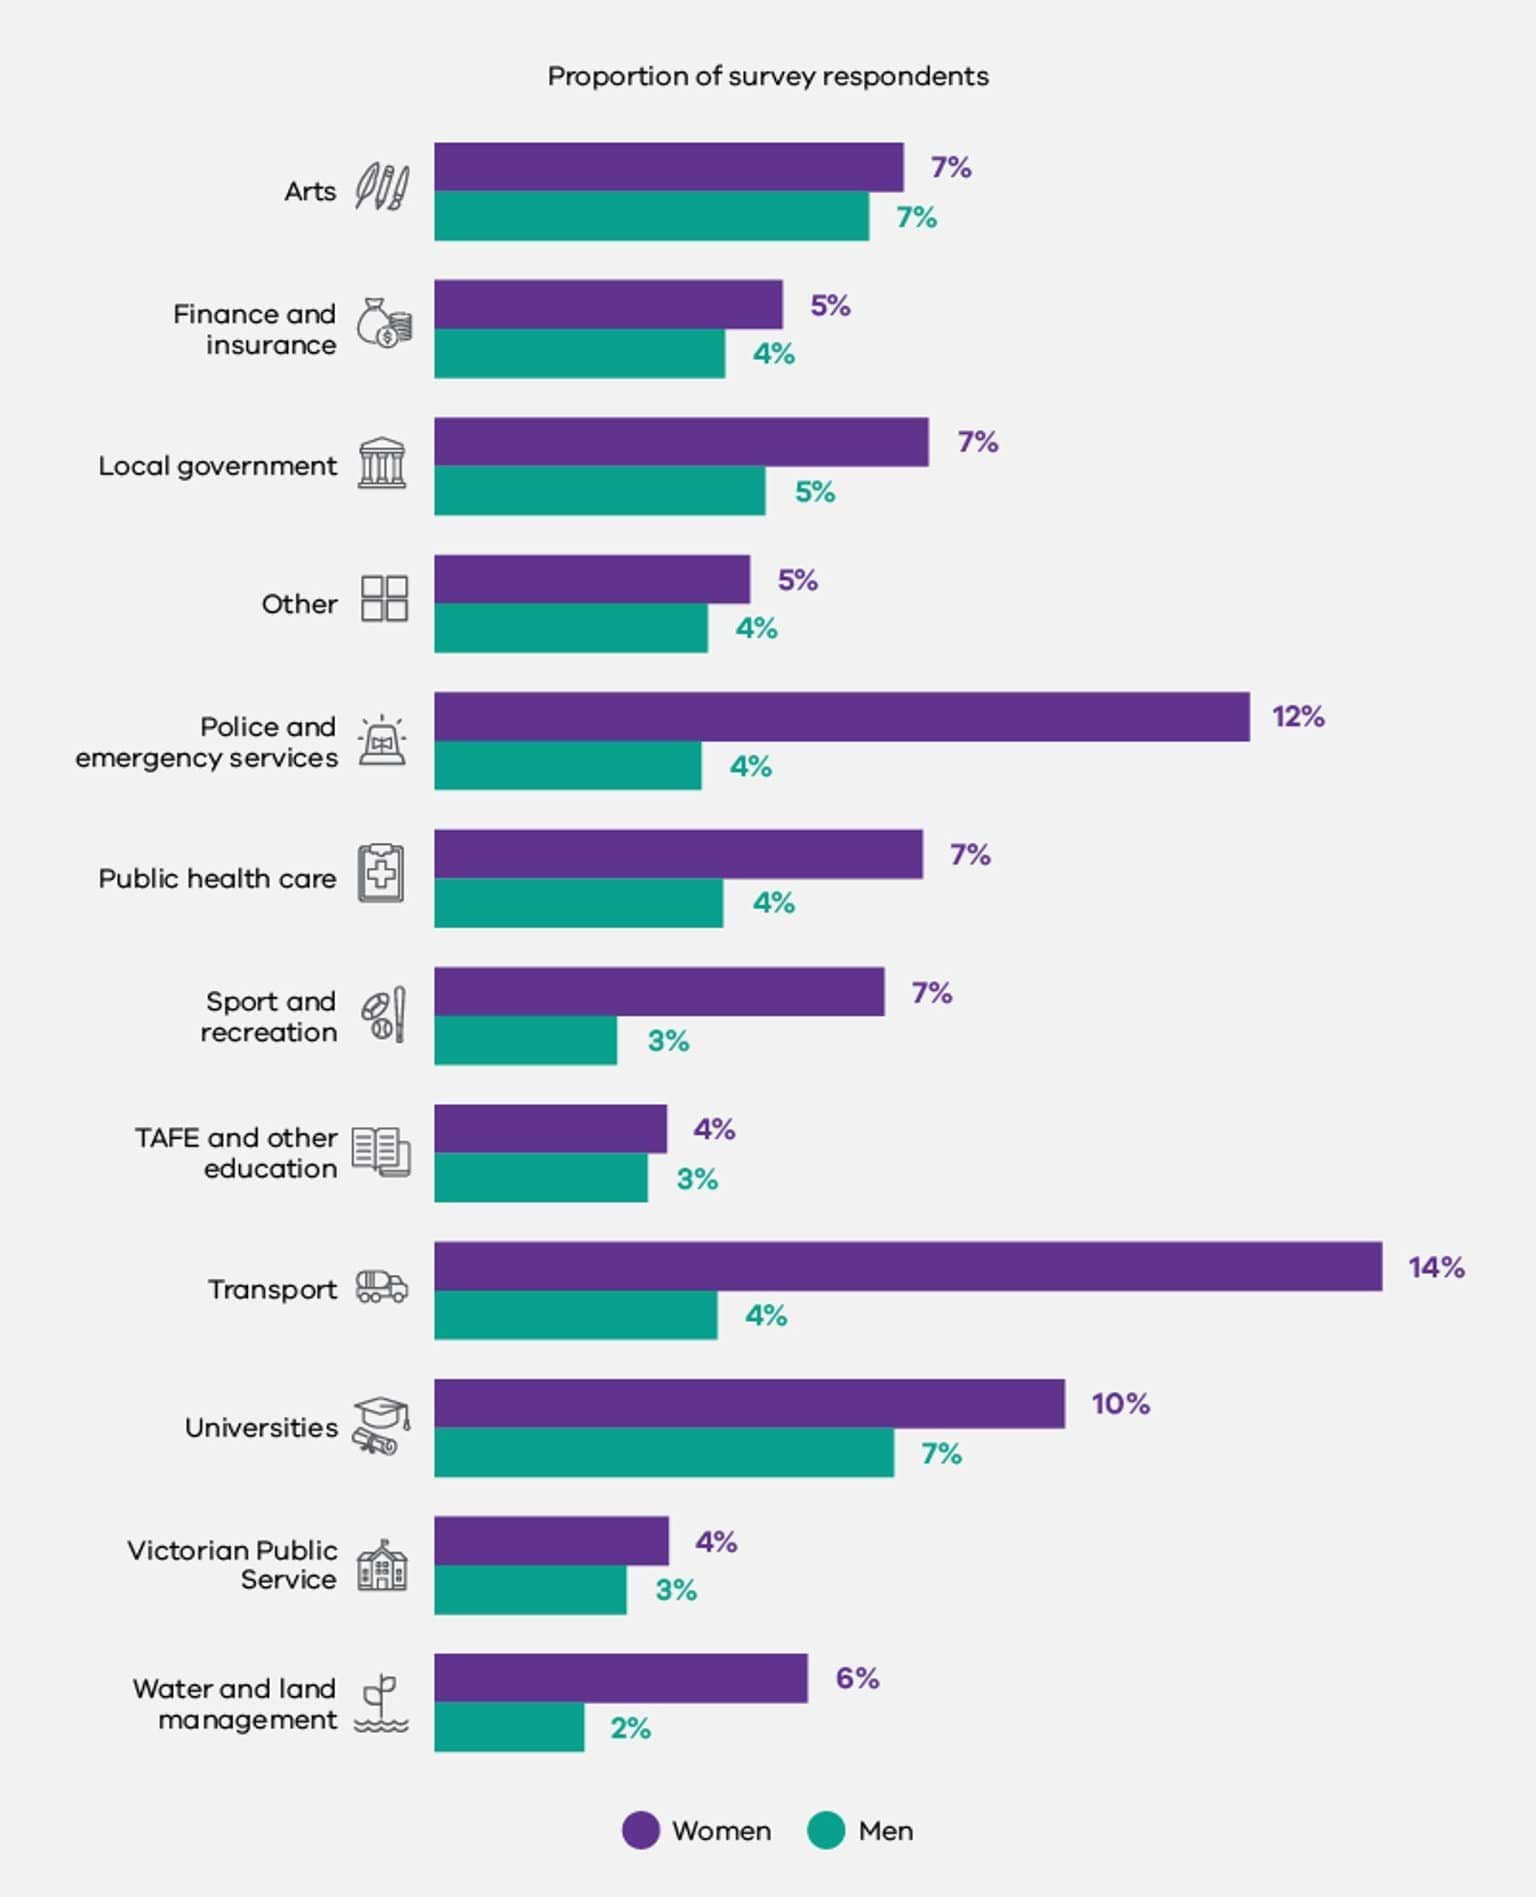
As set out in Figure 3.1 below, across organisations covered under the Act, an estimated 6% of women and 4% of men reported experiencing sexual harassment at work in the previous 12 months.131
Women were most likely to have experienced sexual harassment in the Transport industry group (14%) or in Police and Emergency Services (12%). These were also the 2 industry groups with the highest proportion of men in the workforce (75% and 64% respectively). Men were most likely to have experienced sexual harassment in Universities (7%) or in the Arts industry group (7%).
Fig 3.1. Proportion of survey respondents who reported experiencing sexual harassment at work, by industry and gender
Types of sexual harassment experienced
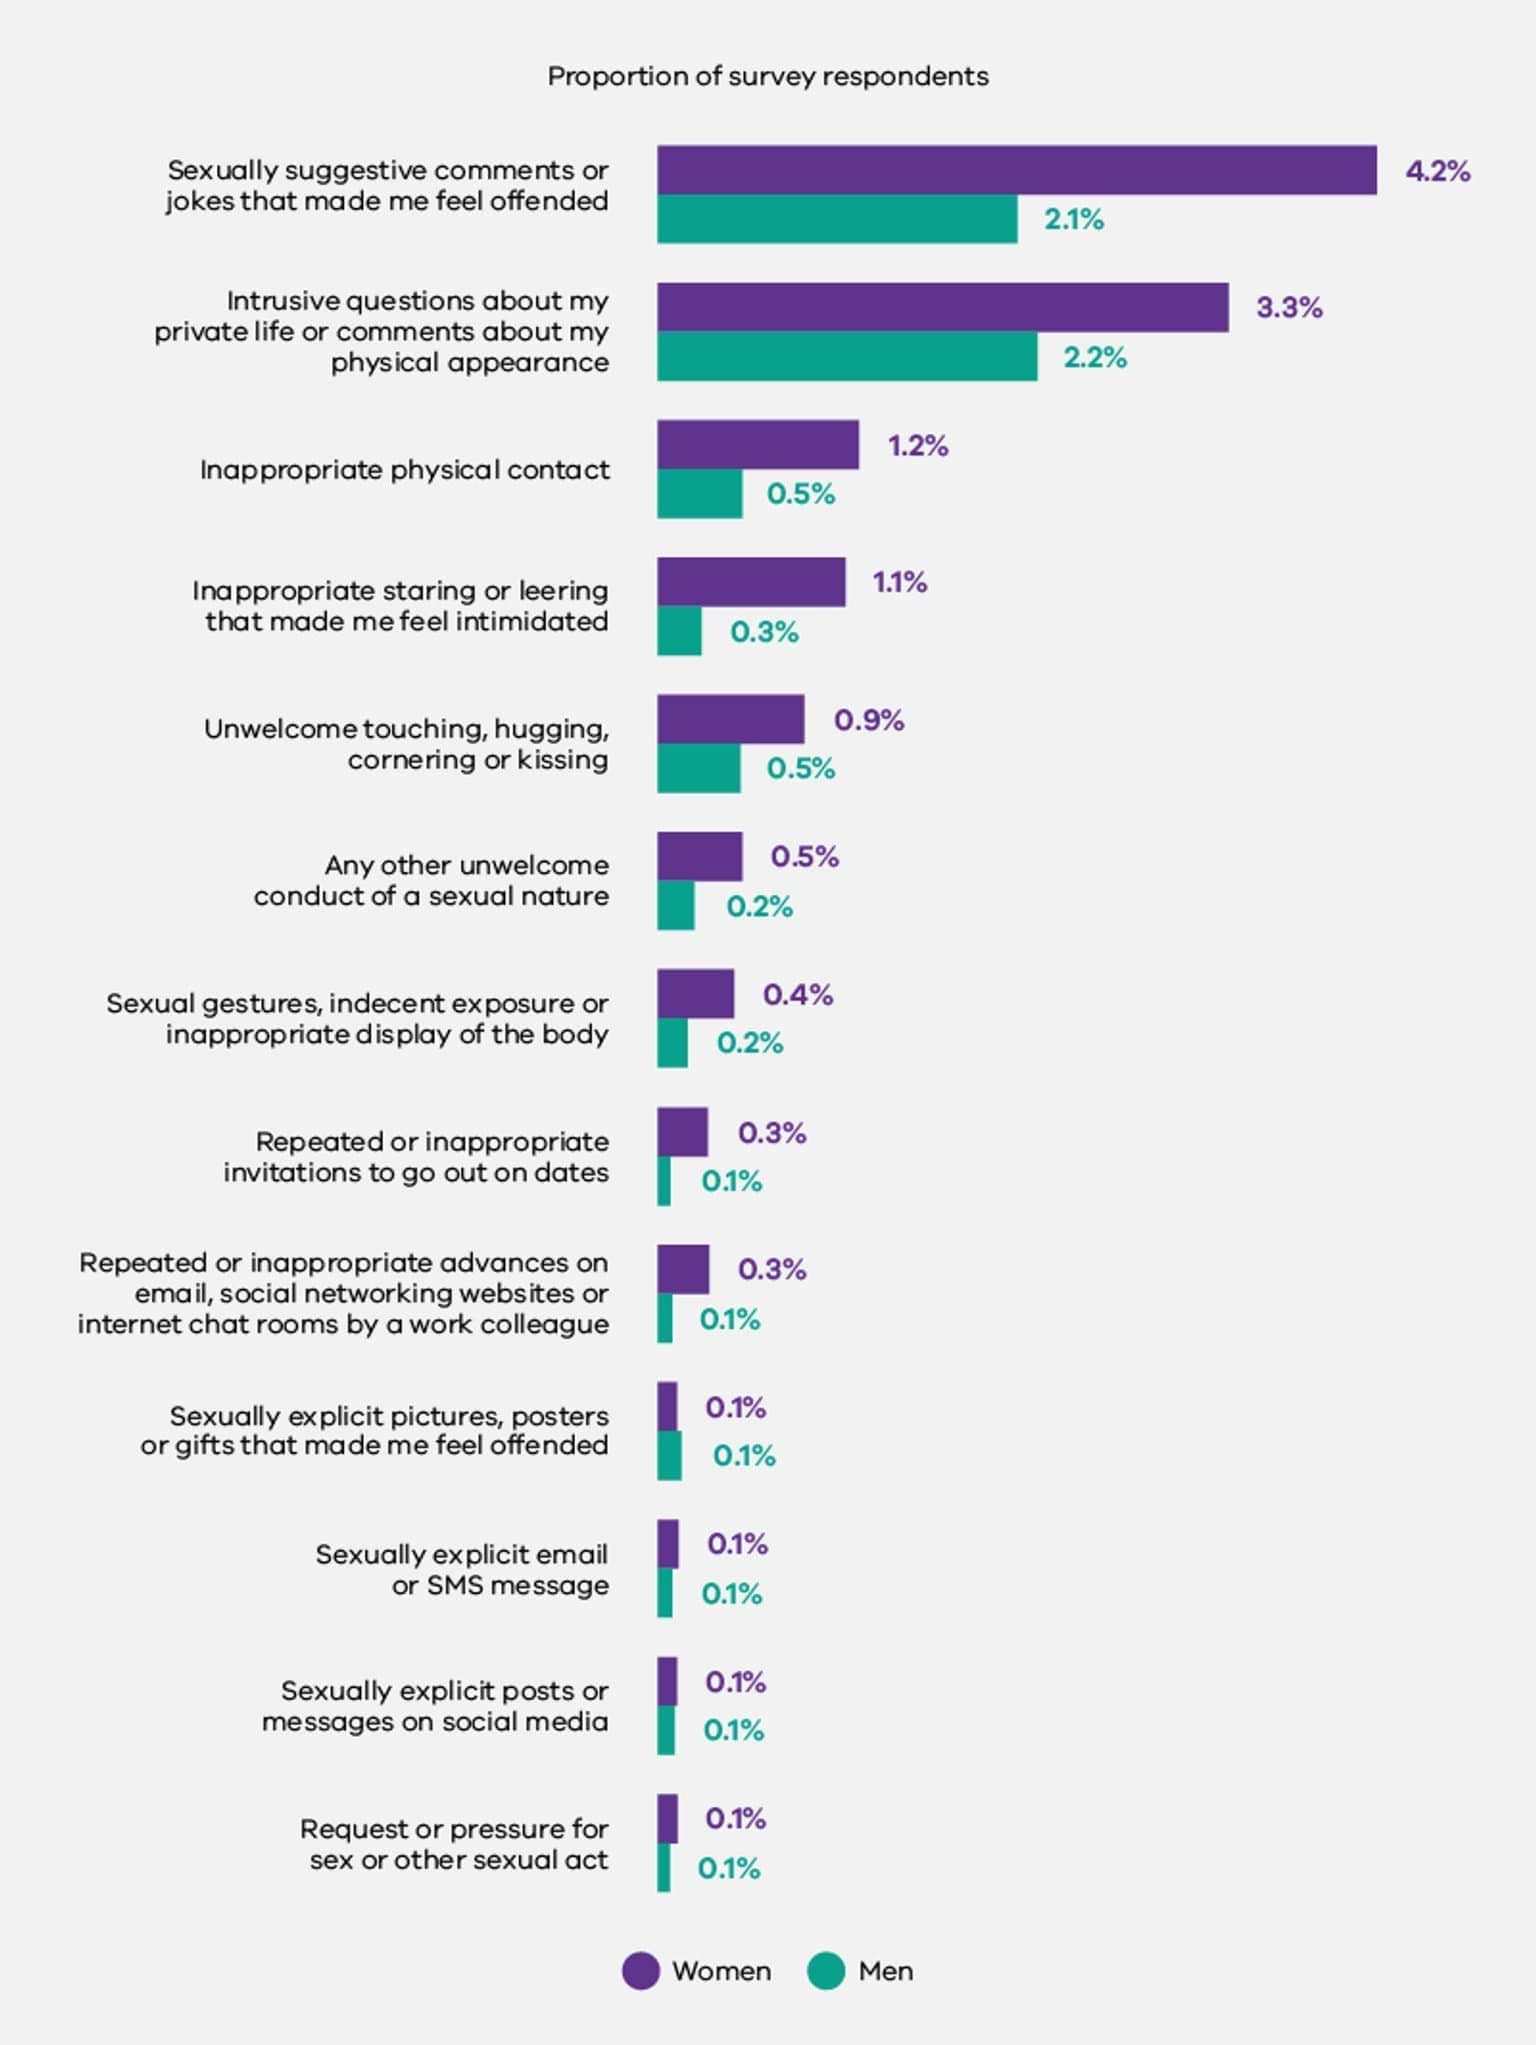
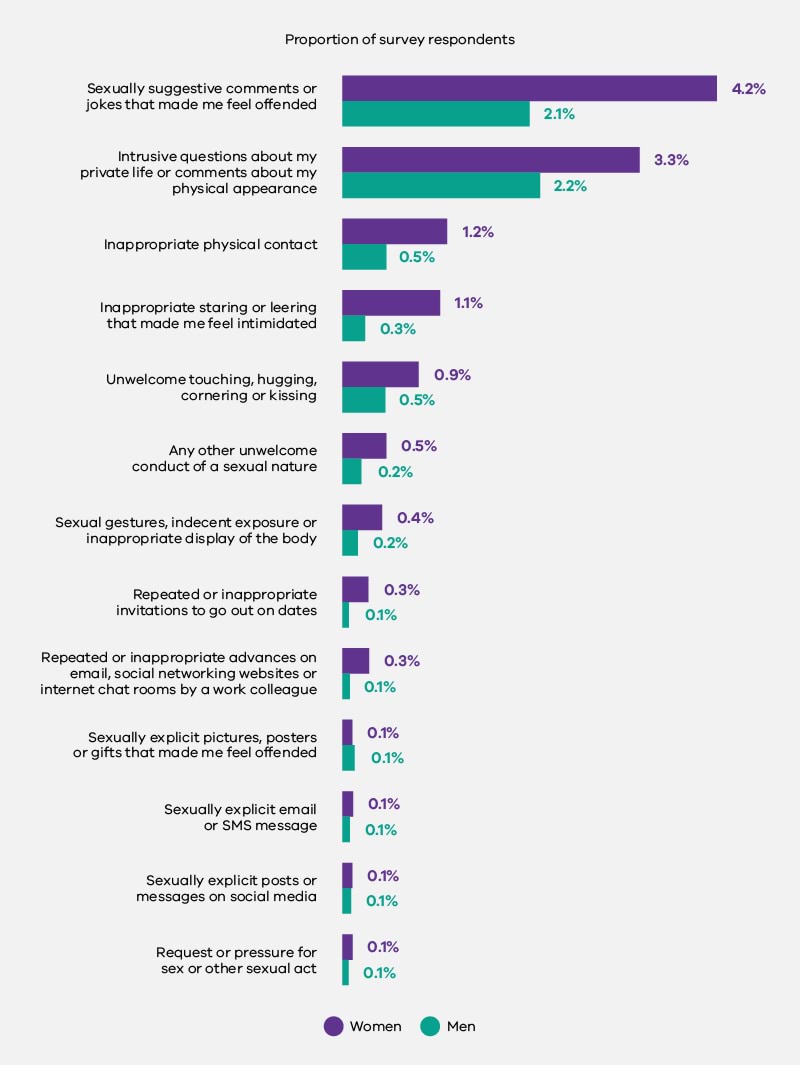
As can be seen in Figure 3.2 below, and in line with findings from other research132, the most common sexual harassment behaviours reported by both women and men were sexually suggestive comments or jokes and intrusive questions about the survey respondent’s private life or comments about their physical appearance. Women were more likely to have experienced most types of sexual harassment behaviours than men.
Fig 3.2. Types of sexual harassment behaviour reported by survey participants, by gender
Victims' responses to sexual harassment
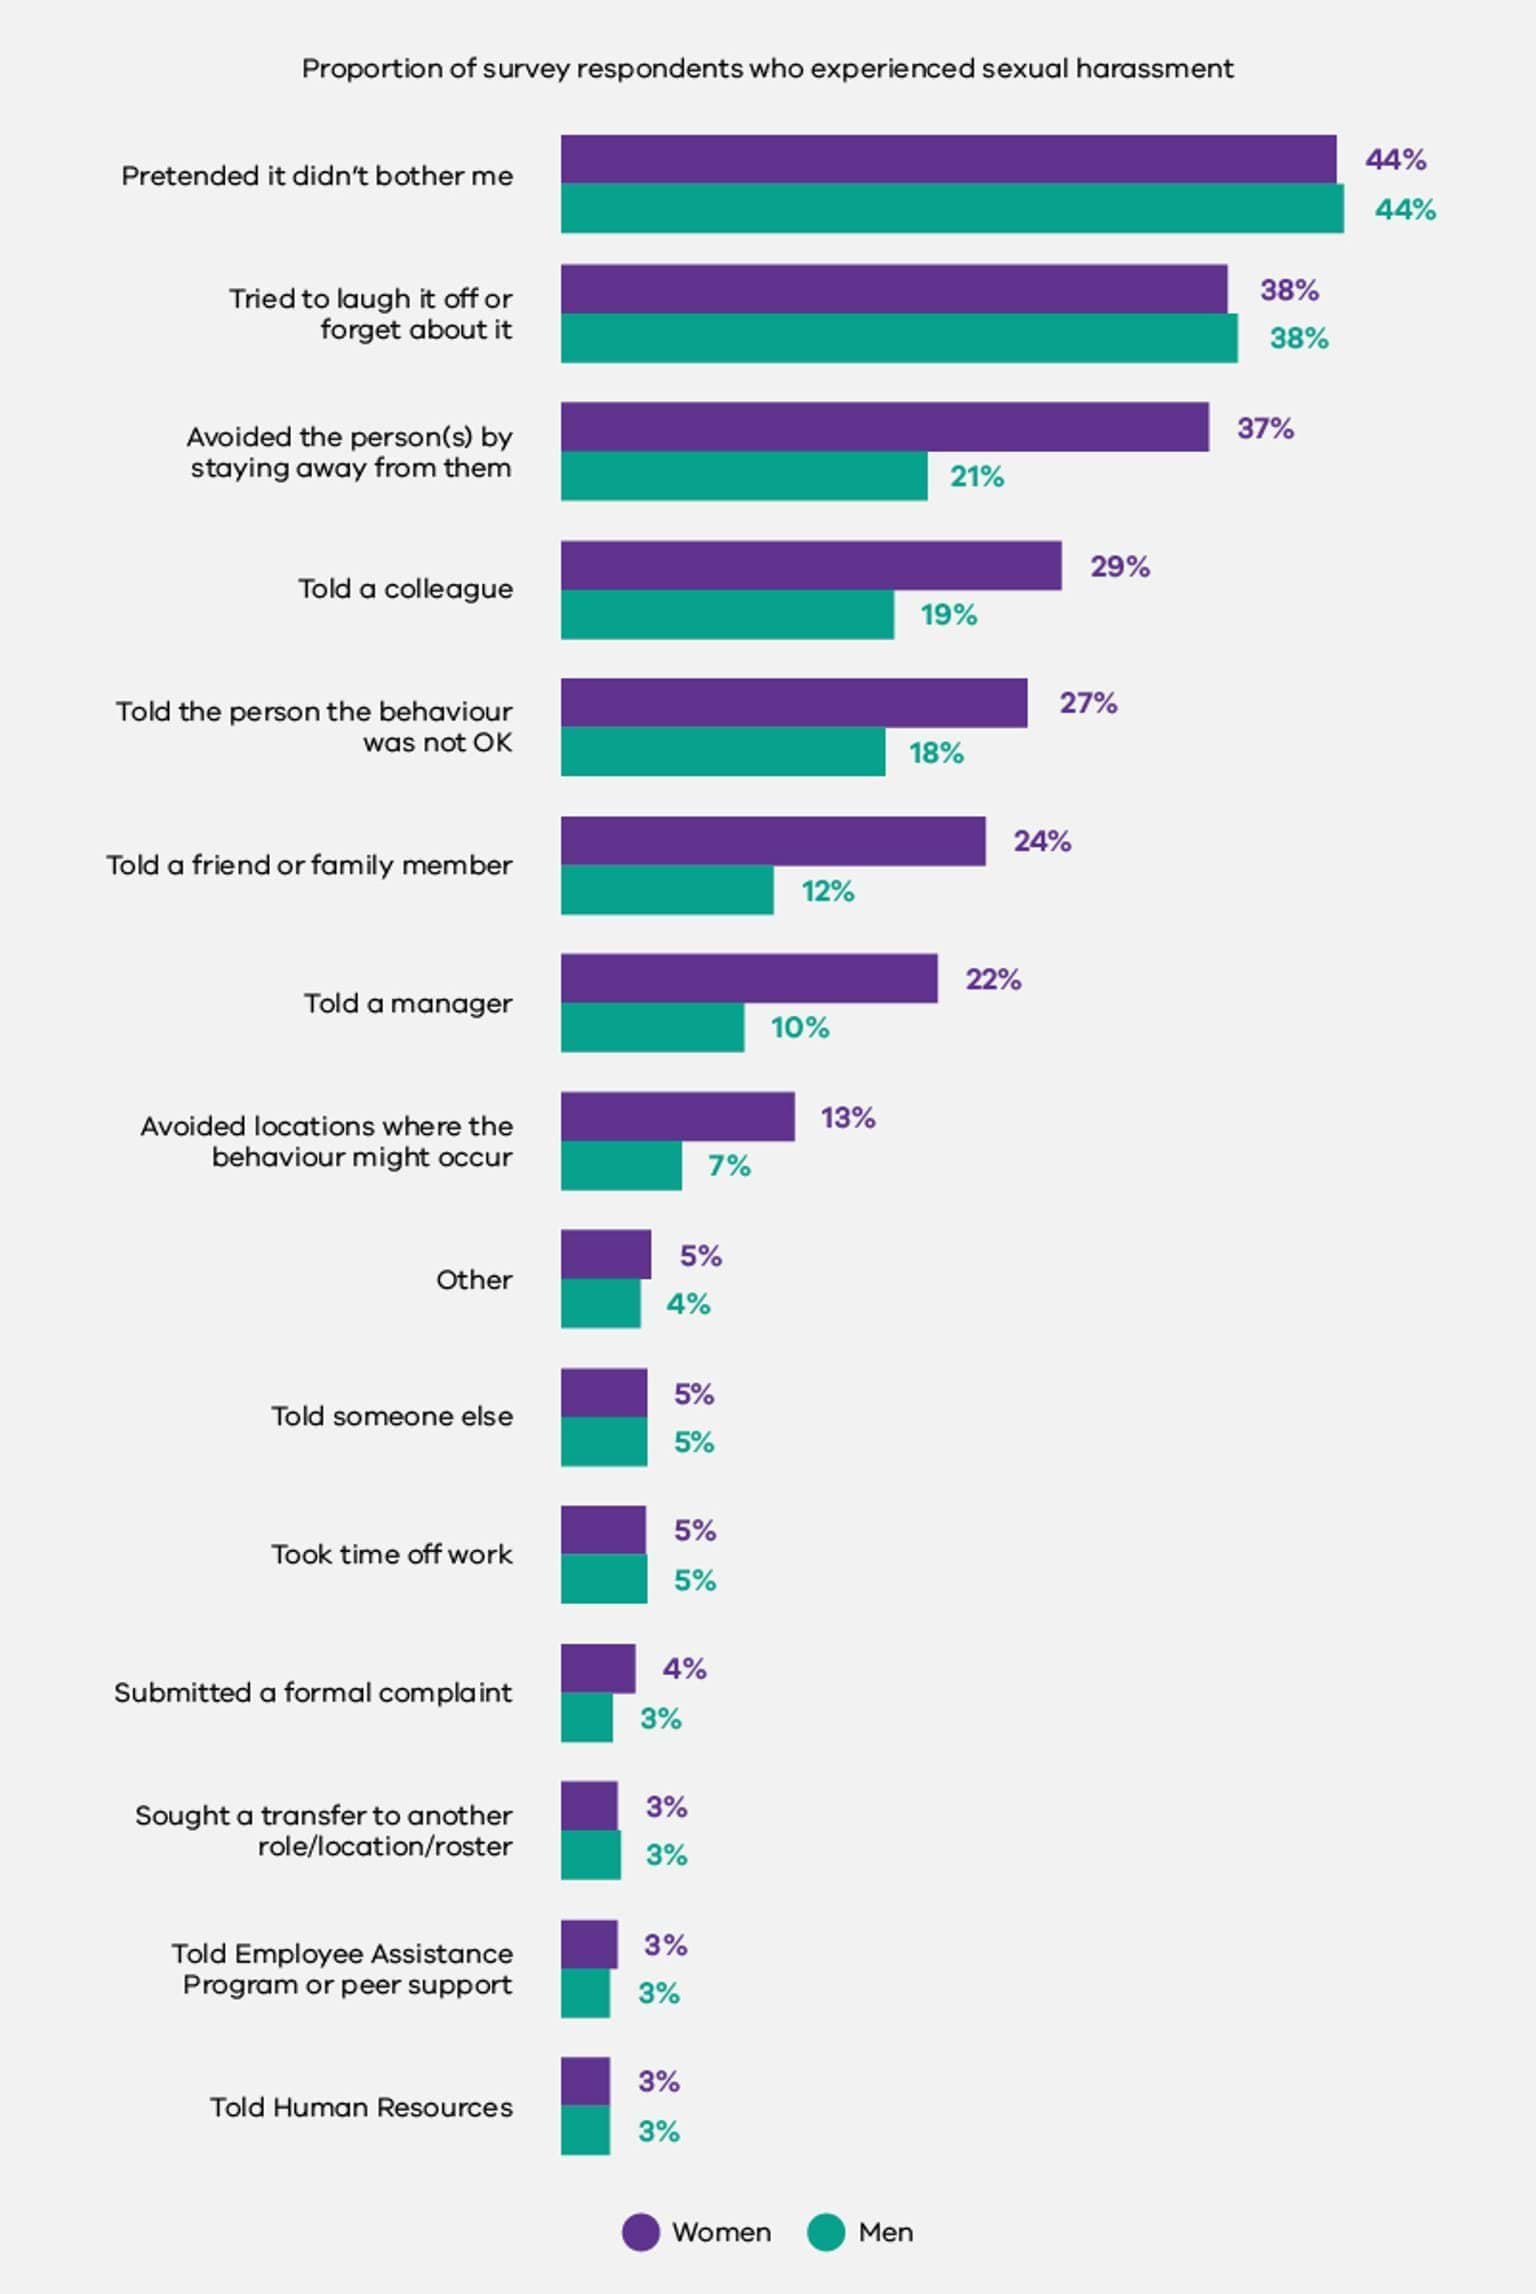
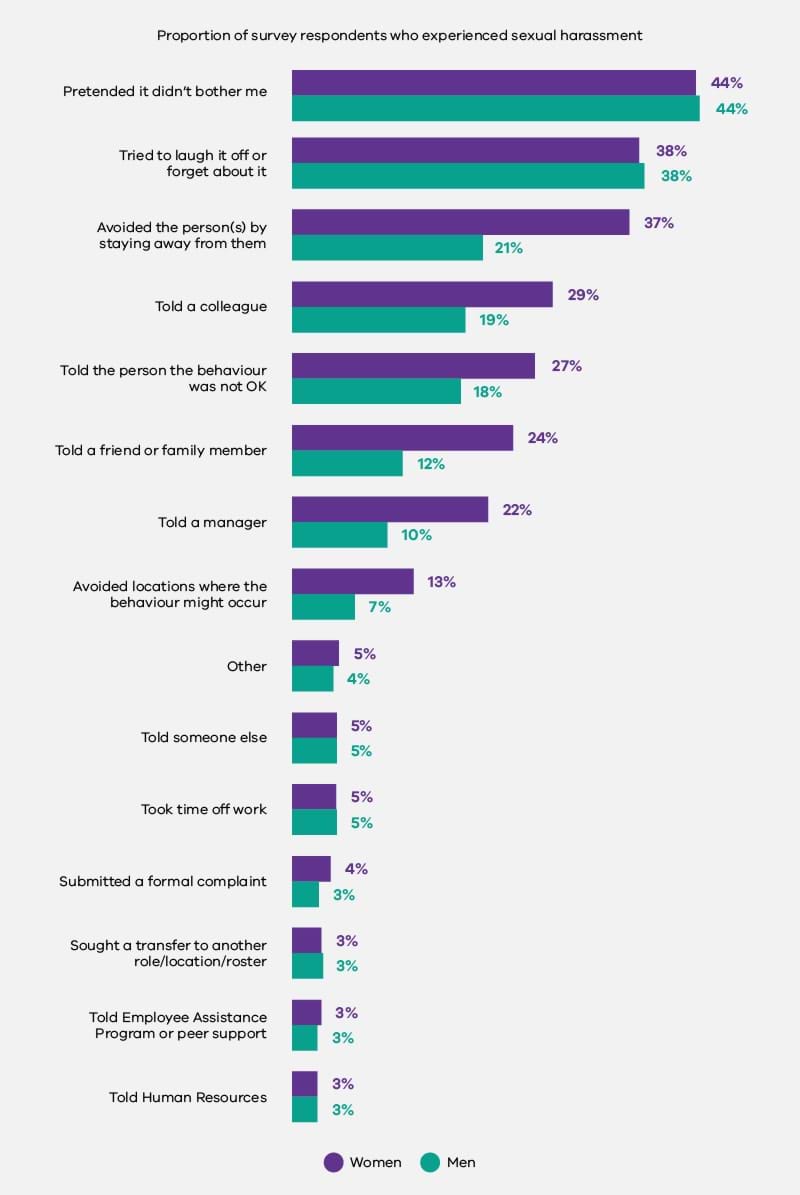
Survey respondents who indicated that they had experienced workplace sexual harassment in the previous 12 months were asked how they had responded. As Figure 3.3 below shows, the most common responses to sexual harassment for both men and women were to pretend the behaviour didn’t bother them, to try to laugh it off, or to try to forget about it. More women than men said they responded by avoiding the person, by telling a colleague, by telling the person the behaviour was not okay, by telling a friend or family member, by telling a manager, or by avoiding locations where the behaviour might occur.
Fig 3.3. Responses to sexual harassment, by gender
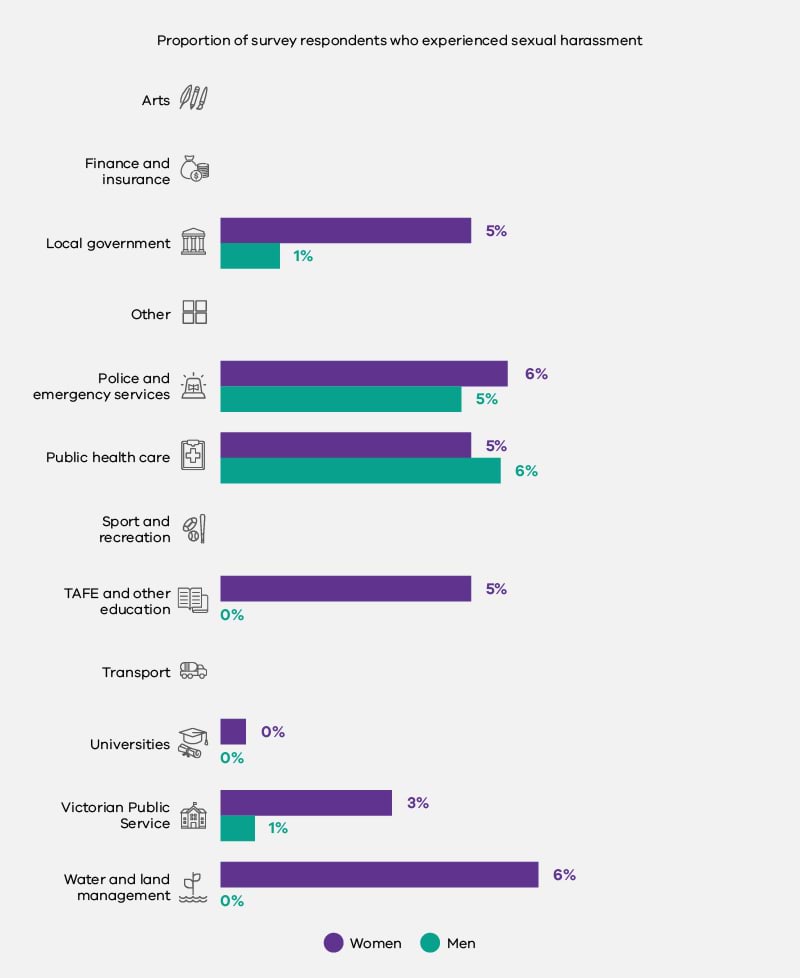
As Figure 3.4 below shows, a significant majority of experiences of sexual harassment went unreported through formal channels – regardless of the gender of the complainant or the industry in which they worked.
Across all organisations covered by the Act, only 4% of women and 3% of men who said they had experienced sexual harassment in the survey, went on to file a formal complaint. Formal complaints were most common for women in the Water and Land Management industry group.
In the Local Government industry group, there was a stark discrepancy between genders, with women more than 5 times more likely to make a formal complaint than men. In 3 industry groups, none of the men who said they had experienced sexual harassment made a formal complaint.
Fig 3.4. Proportion of survey respondents who experienced sexual harassment who made a formal complaint, by industry and gender

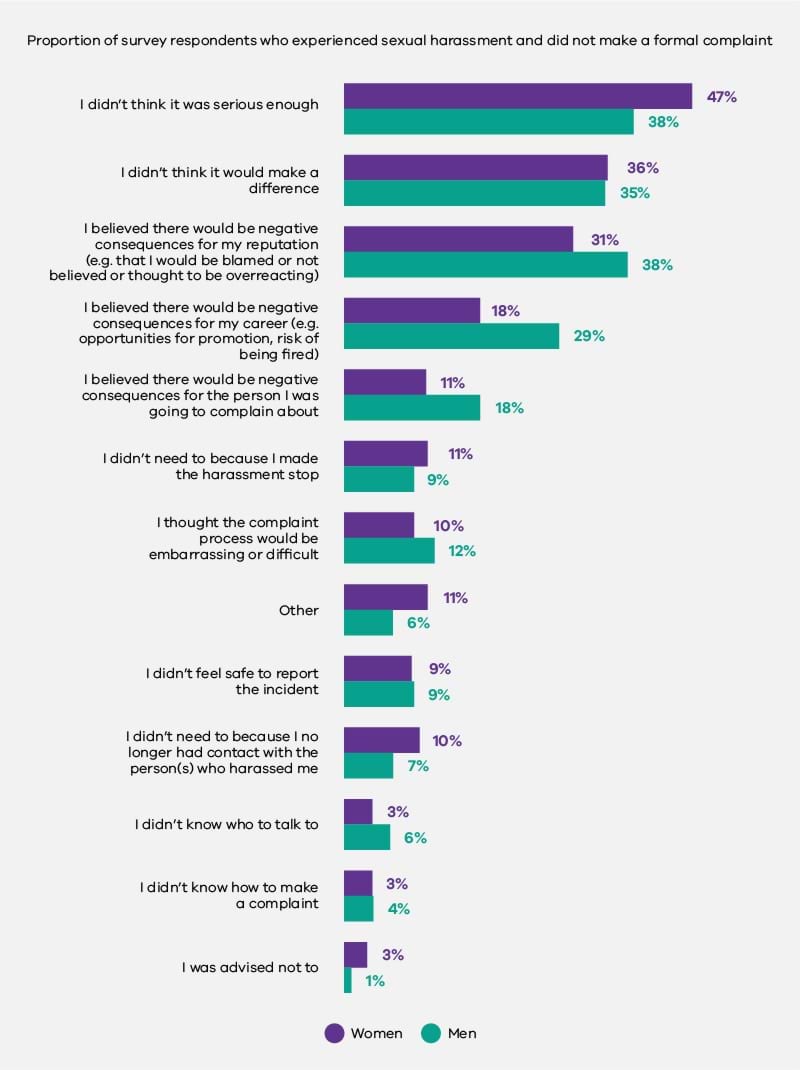
As seen in Figure 3.5 below, among those survey respondents who did not make a formal complaint after experiencing sexual harassment, 47% of women and 38% of men said they didn’t think the harassment was serious enough. For women, the next most common reason was that they didn’t think it would make a difference (36%). For men, the next most common reason was that they believed there would be negative consequences for their own reputation (38%). Further, 29% of men and 18% of women said they did not report their experience of sexual harassment because they believed this would have negative consequences for their career.
Fig 3.5. Reasons why survey respondents did not make a formal sexual harassment complaint, by gender

Challenging inappropriate behaviour
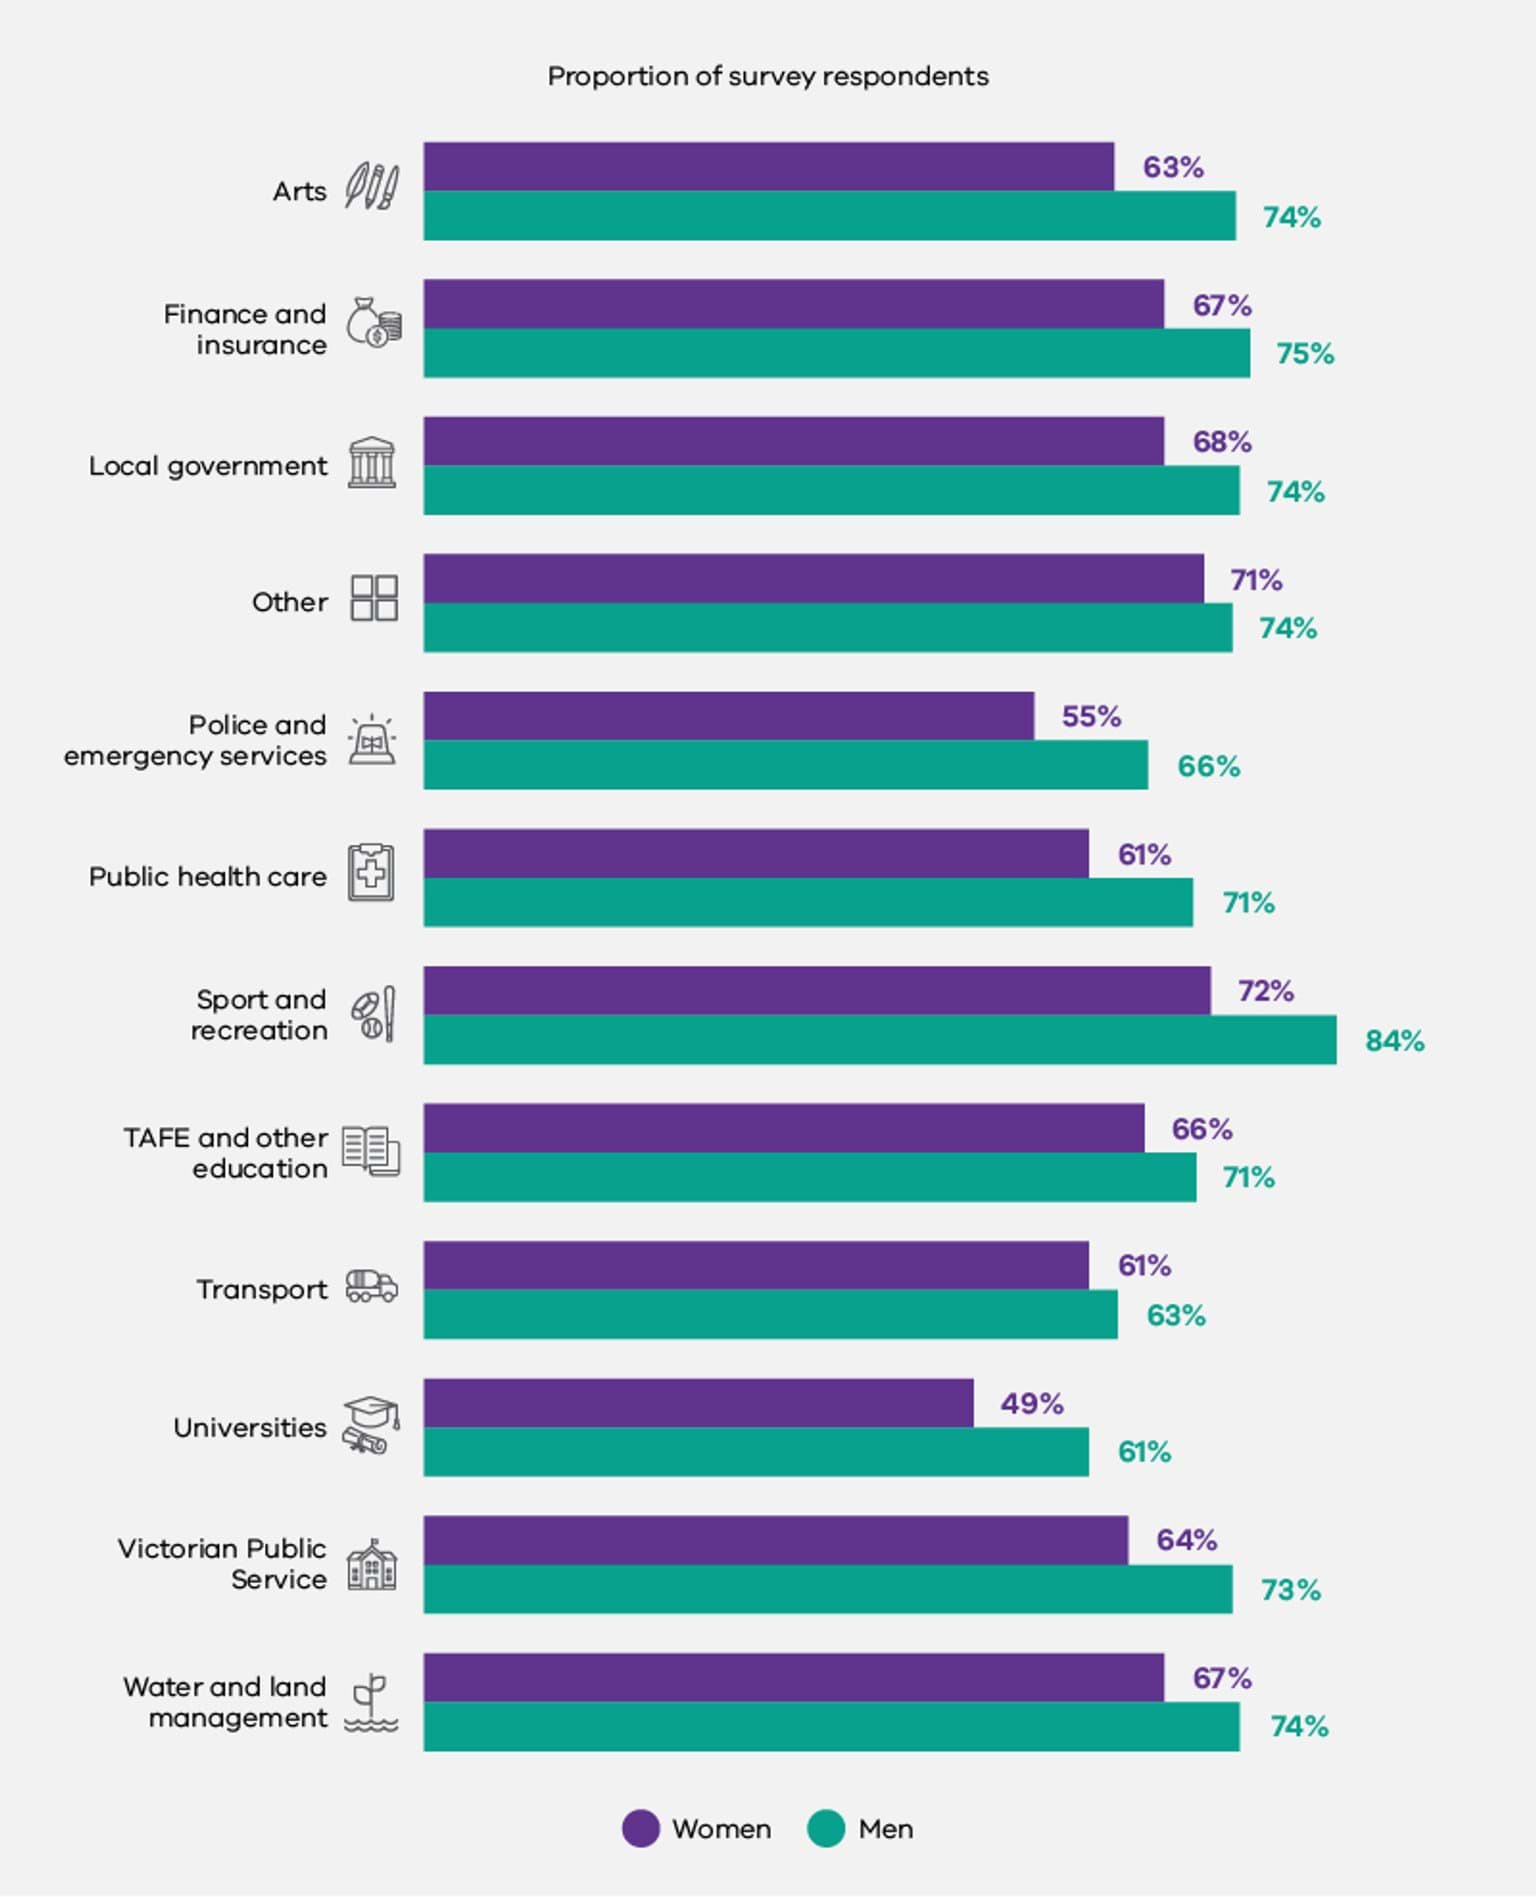
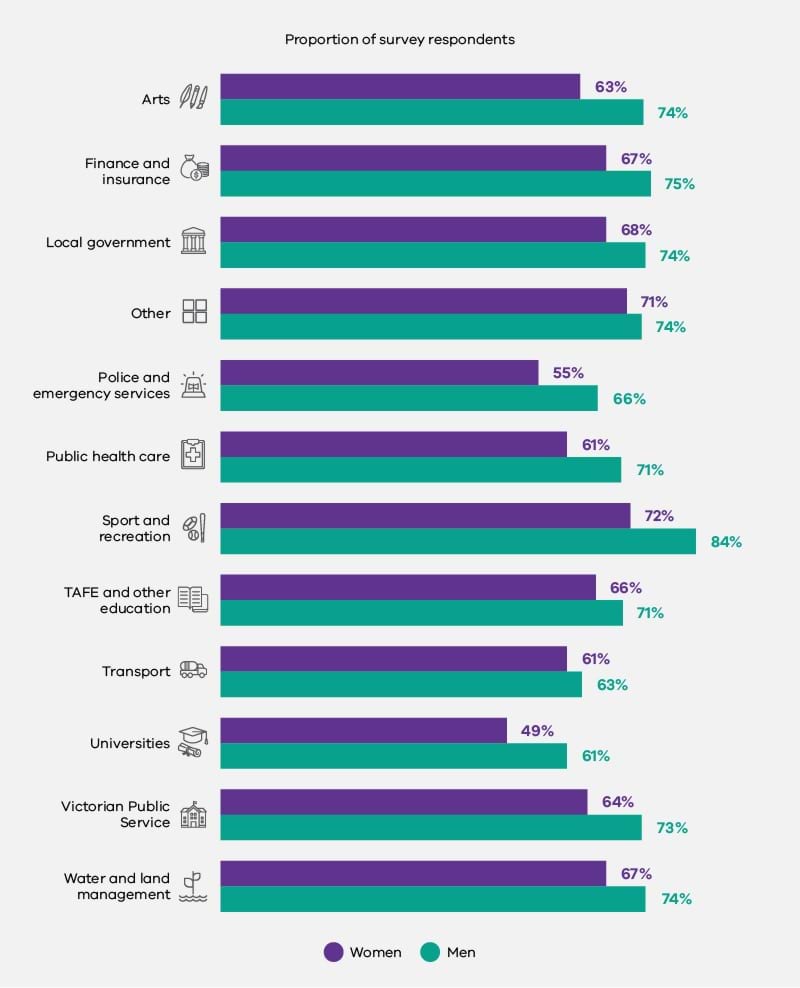
Across all organisations covered by the Act, an estimated 61% of women and 70% of men who responded to the survey, said they felt safe to challenge inappropriate behaviour at work. In all 12 industry groups, men were more likely to say they felt safe to challenge inappropriate behaviour than women (Figure 3.6, below). Those in the Sport and Recreation industry group felt safest to challenge inappropriate behaviour (72% of women and 84% of men). Those employed in the University industry group felt least safe to challenge inappropriate behaviour (49% of women and 61% of men). Only 55% of women in the Police and Emergency Services industry group said they felt safe to do so.
Fig 3.6. Proportion of survey respondents who felt safe to challenge inappropriate behaviour at work, by industry and gender
Formal complaints
The Commission only received formal sexual harassment complaint data from 186 organisations, 95 of which had not received any formal sexual harassment complaints.
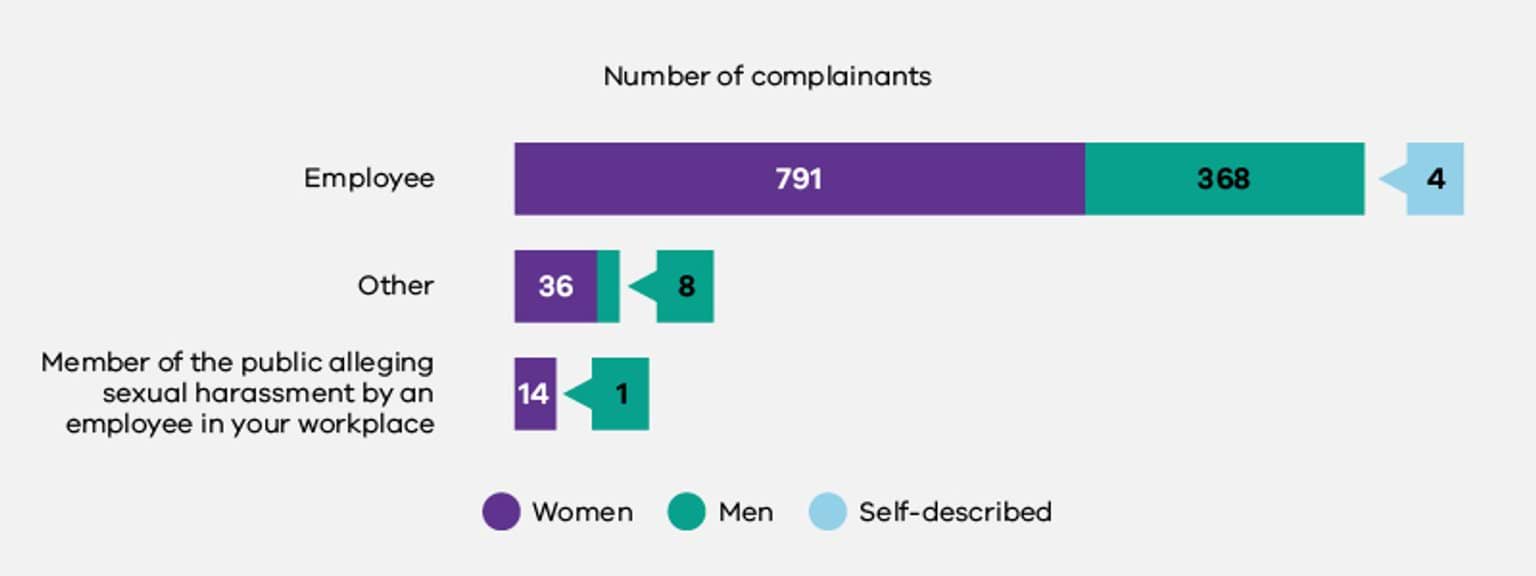
Of the remaining 91 organisations with formal sexual harassment complaints data, 88 provided detail around the complainant’s relationship to the organisation. Within this dataset, the vast majority of formal sexual harassment complaints were lodged by employees – about 70% of whom were women.
Fig 3.7. Formal sexual harassment complaints, by type and gender of complainant
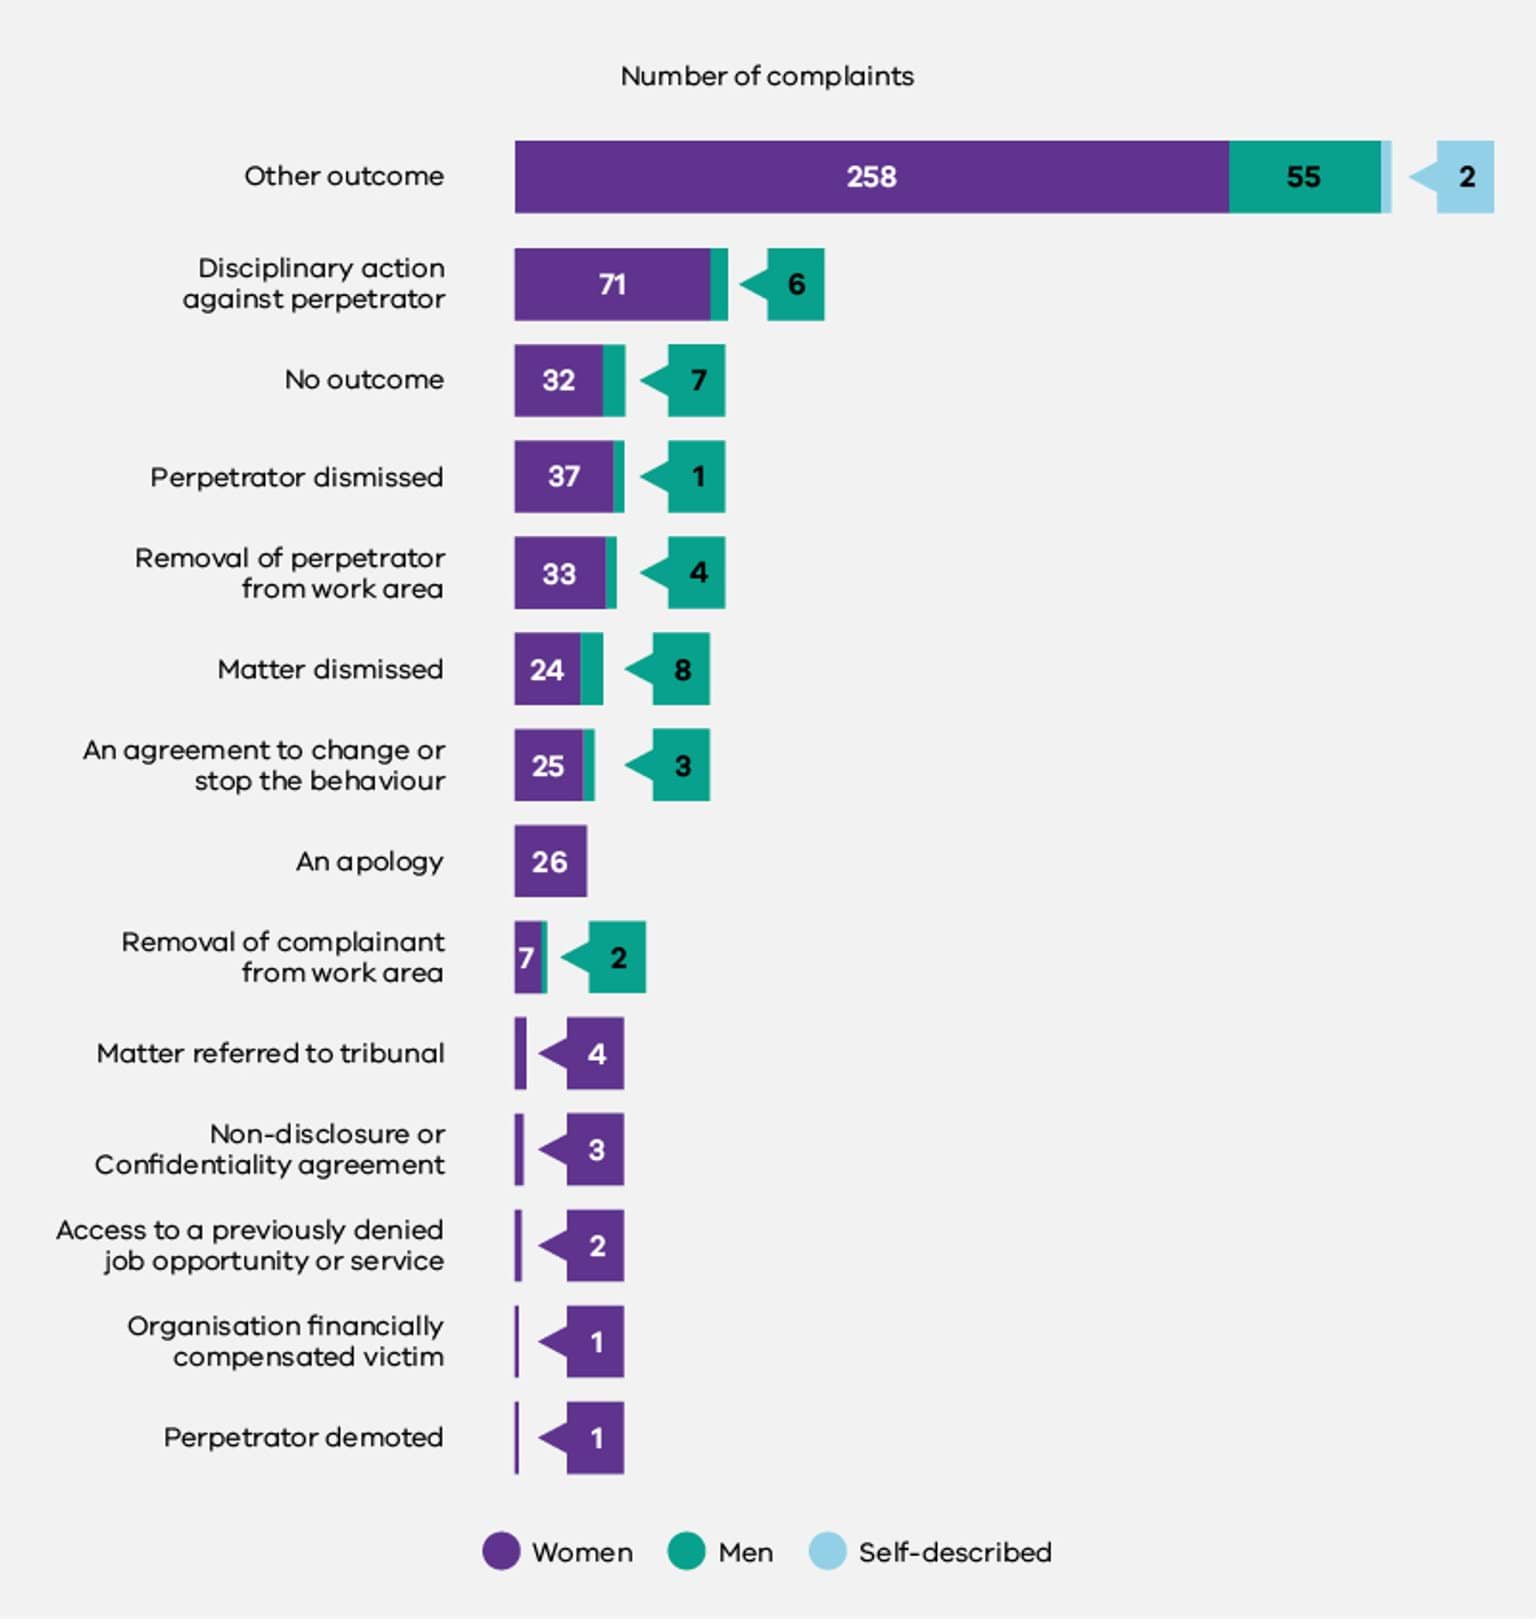
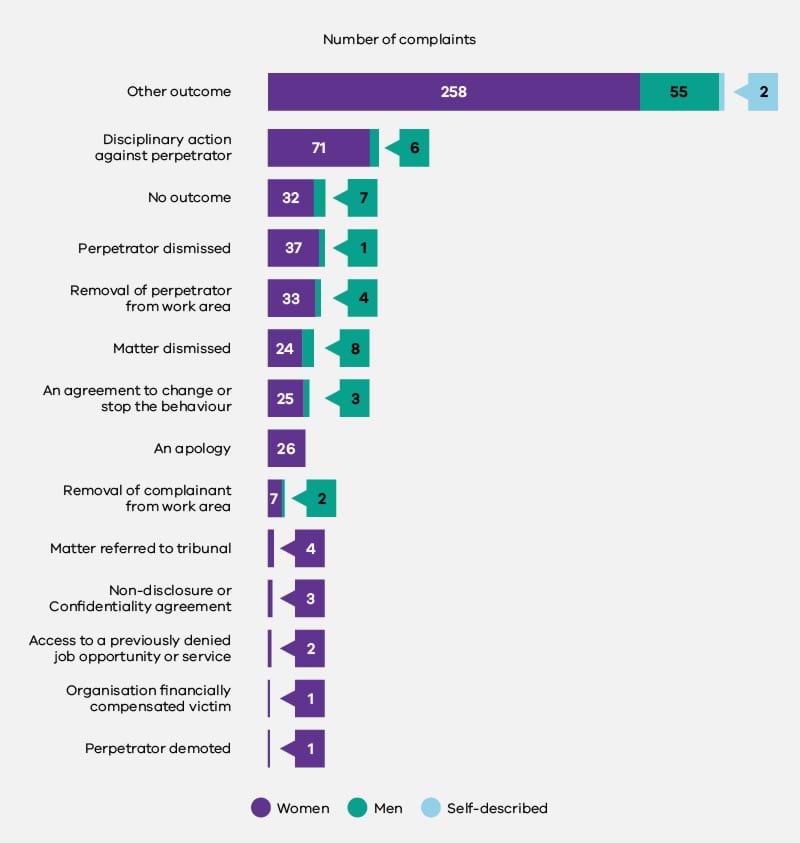
The Commission received formal complaint outcome data from 83 organisations. A significant number of complaints were registered as ‘Other outcome’, which some organisations used to capture industry-specific actions.133 The next most common outcome was disciplinary action against the perpetrator.
Fig 3.8. Formal sexual harassment complaints, by outcome and gender of complainant
Only 50 organisations reported to the Commission regarding complainants’ satisfaction with the outcome of their formal sexual harassment complaint. Even amongst these organisations, many of the datasets were incomplete, with missing satisfaction ratings for nearly 1 in 3 complaints (41 out of 133 complaints). This may suggest irregular complainant follow-up processes but could also be affected by natural lags in data collection, as some complaints may not have been fully resolved at the close of the reporting period.
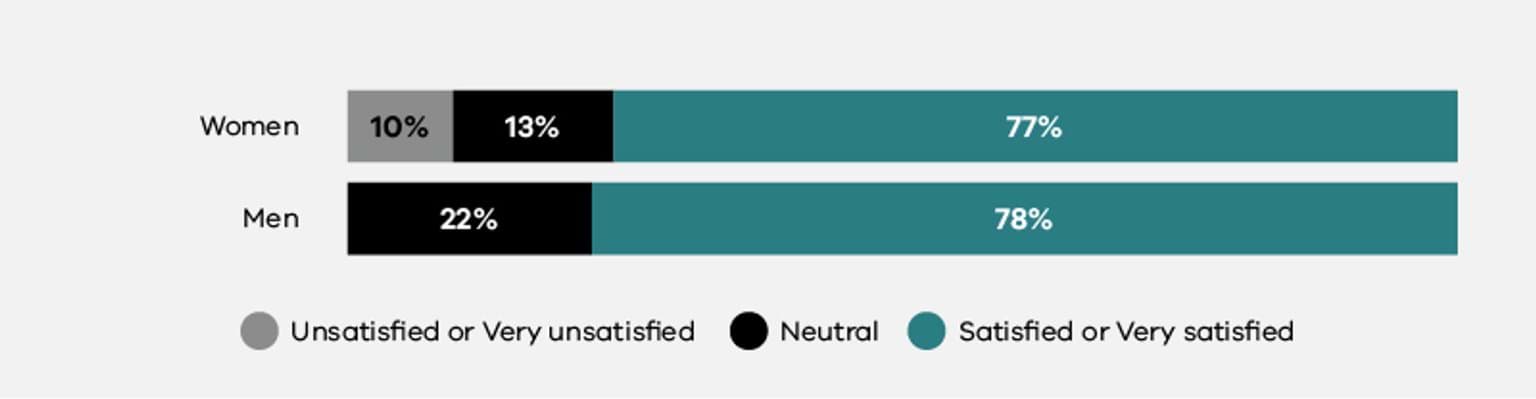
Amongst formal complaints where complainant satisfaction was known, about three-quarters of complainants were satisfied or very satisfied with the outcome of their complaint. One in 10 women who made a formal complaint was unsatisfied or very unsatisfied.
Fig 3.9. Complainant satisfaction with outcomes of formal sexual harassment complaints, by gender of complainant
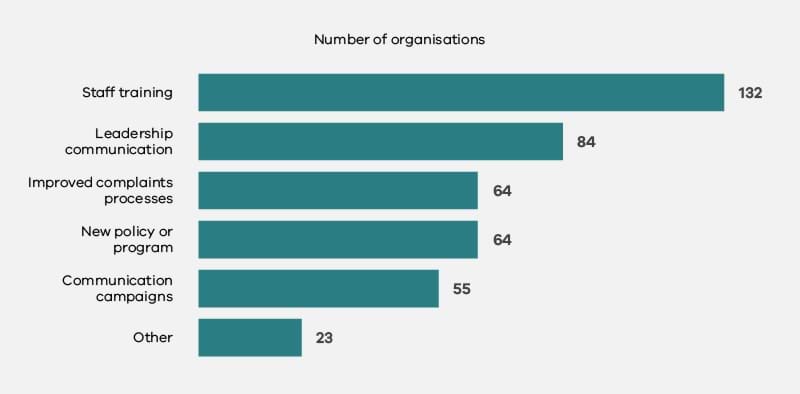
Organisations also had the opportunity to report on the actions they took to prevent future incidents of sexual harassment in the workplace. The Commission received this data from 158 organisations. The most common action was staff training, which was implemented by more than 80% of participating organisations.
Fig 3.10. Actions taken to prevent future incidents of sexual harassment in the workplace

Discussion
The overall prevalence of workplace sexual harassment across defined entities (6% of women and 4% of men) was comparatively low. Australia-wide research conducted by the AHRC in 2018 showed that in the previous 12 months, 23% of women and 16% of men had experienced sexual harassment at work.134 The prevalence of sexual harassment across defined entities was also significantly lower than findings in particular Victorian workforces and industries. For example, in the Legal industry in 2019, 27% of women and 18% of men said they had experienced sexual harassment in the past 12 months.135 Similarly, in the Local Government industry group in 2020, a survey found that 30% of women and 25% of men had experienced workplace sexual harassment in the previous 12 months.136
It should be noted that the Commission’s data relates to a 12-month period in Victoria where large numbers of employees were required to work from home due to the COVID-19 pandemic. While it is possible that the lower rates of sexual harassment across defined entities reflect the decline in face-to-face interactions between co-workers during the pandemic, international research found there was an increase in gender-based harassment and sexual harassment during the pandemic.137 We also know that the pandemic has produced ‘new manifestations of unacceptable behaviours’ and made it more difficult for employers to detect, investigate and address sexual harassment in virtual spaces.138 Further investigation is required to understand these evolving dynamics. The rate of sexual harassment identified by the 2021 workplace gender audit is comparable to that in the NSW public sector. According to the 2021 NSW People Matter Employee Survey, 4% of respondents had experienced sexual harassment in the preceding 12 months – which included 4 months of pandemic-related lockdown.139 It is noted, however, that the NSW dataset does not include local councils or universities, so is not directly comparable to the current data.
Across all defined entities, only 4% of women and 3% of men who said they had experienced sexual harassment went on to file a formal complaint. Many respondents believed that formally reporting the incident would not make a difference (36% of women and 35% of men) or were concerned that reporting would have negative consequences for their career (29% of men and 18% of women). This may indicate a lack of trust in both the reporting and investigation processes in the relevant defined entities, as well as the support offered to victim-survivors to ensure they are not subject to victimisation after making a formal complaint.
Interestingly, however, while survey data showed that very few of those who experienced sexual harassment went on to make a formal complaint, workforce data showed high levels of satisfaction with formal complaint processes. Of those formal complaints where complainant satisfaction was known, about three-quarters of complainants were satisfied or very satisfied with the outcome. The workplace gender audit data shows that some defined entities are working to improve their sexual harassment prevention and response measures, through initiatives such as conducting staff training and improving complaints processes. Organisations’ Gender Equality Action Plans are also expected to detail more specific interventions to prevent and respond to sexual harassment.
The Commission anticipates an increase in reporting complaints of sexual harassment over the next two to three years as defined entities improve their organisational culture, awareness of sexual harassment and accountability mechanisms, as well as their policy and reporting structures.
The Commission’s data revealed that experiences of sexual harassment against women were more common in majority-men industries. In particular, the Transport industry group and Police and Emergency Services had the highest proportions of men in the workforce (75% and 64% respectively), and the greatest number of women who reported experiencing workplace sexual harassment (14% for Transport and 12% for Police and Emergency Services). These industry groups also had low representation of women in CEO positions140 – with women holding 17% of CEO roles in the Police and Emergency Services industry group and no CEO roles in the Transport industry group. In contrast, the Victorian Public Service had the second-highest proportion of women in the workforce (70%) and the lowest number of women who reported experiencing workplace sexual harassment (4%).
Perhaps unsurprisingly, in the industry groups that had the highest rates of sexual harassment against women (the Transport, Police and Emergency Services and University industry groups), there were fewer employees who felt safe to challenge inappropriate behaviour at work. For example, in the Police and Emergency Services industry group, only 55% of women and 66% of men felt safe to call out inappropriate behaviour. In the University industry group – which had the equal highest rate of sexual harassment against men at 7%, and the third highest rate of sexual harassment against women at 10% – only 49% of women and 61% of men felt safe to challenge inappropriate behaviour in the workplace.
Decades of research indicates that these trends are not unique to organisations reporting under the Act. Women working in majority-men industries have been found to be more likely to experience workplace sexual harassment than women in majority-women or gender-balanced environments.141 Breaking down forms of power that may be based on outdated, gendered understandings of hierarchy, as well as addressing any unequal distribution of power across genders, will assist organisations in creating an environment where sexual harassment is less likely to occur.142 It is also imperative that any systemic unequal distribution of power between genders is challenged. Working towards a more balanced representation of genders across all levels of an organisation and in all occupations can support this change.143
The Commission only received data relating to formal sexual harassment complaints from 186 organisations (less than two-thirds of organisations covered under the Act). Among those organisations that submitted information on formal reports of sexual harassment, there remained significant data gaps. These included a lack of data about the complainant’s relationship to the organisation, the outcomes of complaints, and complainants’ satisfaction with those outcomes. These data gaps are concerning, as research shows that comprehensive reporting and data collection systems are central to addressing workplace sexual harassment.144 The Commission will be issuing further guidance to defined entities to support improved practice in data collection and reporting on formal sexual harassment complaints.
Recommendations
It is crucial for organisations to collect, monitor and report on formal sexual harassment complaints data. This includes information regarding the nature of incidents, patterns emerging from those incidents, resolution time frames, outcomes and satisfaction of the parties to formal reports, as well as anonymous data on unreported sexual harassment experiences through employee experience surveys.
Collecting and analysing data regarding sexual harassment will help organisations understand and address the prevalence, nature, reporting, impacts of, and responses to, sexual harassment in the workplace.145 Leaders within organisations reporting under the Act must monitor incident rates closely to ensure their policy and program interventions are effective. Organisations should take steps to amend their GEAP strategies and measures if the rate of reported experience of sexual harassment (e.g. via an anonymous survey) does not decrease, and formal reporting of the experience of sexual harassment (i.e. the number of formal complaints made) does not increase in their organisation at a reasonable and material rate.
Monitoring the satisfaction of those reporting sexual harassment (complainants) can also help organisations understand where their policies and implementation can be improved.146 For defined entities, the regular workplace gender audit required under the Act supports these processes, but organisations should also consider undertaking a review of their data at least annually.147 It is also important to collect data on informal reporting processes – see Recommendation 3.2, below.
Collecting and analysing data on informal sexual harassment complaints, alongside formal complaints data, will assist defined entities to better understand the prevalence of sexual harassment in their workplace.148 This can also assist with a more nuanced analysis of sexual harassment complaints data.149
Defined entities should also collect, where possible, data on the reasons why employees chose to report a workplace sexual harassment incident informally, or chose not to continue with a formal complaint and investigation. This will assist them to assess the barriers to formal reporting within their organisation and the effectiveness of their informal complaint pathways.150
Individuals who may experience multiple, overlapping forms of disadvantage and discrimination can be particularly vulnerable to workplace sexual harassment.151 They may also feel less empowered to report sexual harassment, may experience compounding forms of discrimination and harassment, and their experiences may be less adequately reflected in organisational policy.152
Accurate data collection is therefore important to identify whether there are trends in your organisation with regards to sexual harassment and people with intersectional attributes. Collecting this data can help your organisation understand and respond to any patterns with regards to behaviour or other structural or systemic concerns contributing to the sexual harassment of people who experience multiple forms of discrimination. It can also help you ensure that your prevention and response framework is responsive to diverse needs.
In collecting, analysing and reporting on data about people who may experience compounding forms of inequality, organisations need to be sensitive to employee safety and privacy considerations and allow employees the discretion to self-identify.153
In addition to monitoring the effectiveness of complaints pathways, complaints handling, and support for victim-survivors, organisations should consider monitoring the impact of prevention efforts aimed at changing workplace culture.
To enable a workplace to understand whether they are moving towards a culture that is free from sexual harassment, organisations should consider collecting a holistic range of quantitative, qualitative and evaluation data including:
- evaluation data relating to programmatic efforts focused on:
- preventing sexual harassment in online environments
- supporting managers to develop safe team cultures free from sexual harassment
- generating more gender balance across occupations and in leadership
- feedback from all levels of the organisation about how prevention efforts can be improved.
Workplace gender audits completed under the Act will also support this data collection.
References
- Australian Human Rights Commission (AHRC), Everyone’s Business: Fourth National Survey on Sexual Harassment in Australian Workplaces, AHRC, 2018, accessed 22 June 2022.
- AHRC, Everyone’s Business.
- AHRC, Everyone’s Business.
- AHRC, Everyone’s Business.
- AHRC, Respect@Work: National Inquiry into Sexual Harassment in Australian Workplaces, AHRC, 2020, accessed 22 June 2022.
- AHRC, Respect@Work.
- AHRC, Everyone’s Business.
- AHRC, Everyone’s Business.
- AHRC, Everyone’s Business.
- Deloitte Access Economics, The economic costs of sexual harassment in the workplaceThe economic costs of sexual harassment in the workplace, Deloitte Access Economics, 2020, pp 27–37, 43-45, accessed 9 August 2022; AHRC, Respect@Work, p 273, 380.
- AHRC, Respect@Work, p 287–89.
- Deloitte Access Economics, The economic costs of sexual harassment.
- AHRC, Respect@Work, p 70.
- AHRC, Everyone’s Business, p 81-83.
- As outlined in the Introduction, the Commission will publish insights from intersectional data in a companion report on intersectionality, to be released in 2023.
- An employee experience survey item listed 13 types of sexual harassment and asked the respondent whether they experienced any of these behaviours at work in the prior 12 months. Because the employee experience results were reported as percentages of respondents within each organisation, the survey results have been weighted based on the size and gender composition of each defined entity to produce the estimates cited here.
- AHRC, Everyone’s Business, p 8.
- This category was particularly used in health organisations in regard to patient perpetration of sexual harassment. Outcomes listed included the use of duress alarms, reporting cases to police, heightened observation and supervision of patient/area, increasing staffing levels, reviews of procedures, and changes to patient management strategies.
- AHRC, Everyone’s Business, p 8.
- Victorian Legal Services Board + Commissioner (VLSB+C), Sexual Harassment in the Victorian Legal Sector: 2019 study of legal professionals and legal entities, accessed 9 August 2022 VLSB+C, 2020, p 18.
- Victorian Auditor-General’s Office (VAGO), Sexual Harassment in Local Government: December 2020, VAGO, 2020, p 29.
- Project Include, Remote work since COVID-19 is exacerbating harm: What companies need to know and do [PDF 536 KB] Project Include, March 2021, pp 8 -11, 55, accessed 9 August 2022; Rights of Women, Right of Women survey reveals online sexual harassment has increased, as women continue to suffer sexual harassment whilst working through the COVID-19 pandemic, Rights of Women, 11 January 2021, accessed 9 August 2022; E Tiry et al, The New World of Work: Principles and Practices for Addressing Harassment The Purple Campaign, June 2021, pp 2-3, accessed 9 August 2022.
- A Orifici, ‘Under the cloak of COVID-19: How the pandemic affects workplace investigations’ Impact, Monash Business School, 24 June 2020, accessed 26 July 2022.
- NSW Public Service Commission, People Matter Employee Survey 2021, Sector Report – NSW Public Sector, p 34, accessed 25 July 2022.
- Finance and Insurance were tied with Police and Emergency Services (17% women CEOs).
- M Foley et al., ‘”I’ll never be one of the boys”: Gender harassment of women working as pilots and automotive tradespeople’ Gender, Work, Organization, 2020, pp 1-16, DOI: 10.1111/gwao.12443, p 3. It is also worth noting that in these environments, some forms of harassment may not be overtly sexual, but may be subtle (though no less serious) and targeted at individuals or groups because of their gender. Sometimes labelled ‘everyday sexism’, gender-based harassment of this nature reflects outdated societal attitudes towards women and is both a consequence and cause of power imbalances. Foley et al., ‘”I’ll never be one of the boys”’, p 4. See also, F Wilson and P Thompson, ‘Sexual harassment as an exercise of power’, Gender, Work and Organization, 2001, 8(1): p 61–83, DOI: 10.1111/1468-0432.00122.
- Sojo et al., ‘What works, what’s fair?’.
- South Australian Equal Opportunity Commission, 2016, ‘Sex discrimination, sexual harassment and predatory behaviour in South Australia Police: Independent reviewSouth Australian Equal Opportunity Commission, 2016; Sojo et al., ‘What works, what’s fair?’.
- Sojo et al., ‘What works, what’s fair?’.
- Sojo et al., ‘What works, what’s fair?’; AHRC, Respect@Work.
- South Australian Equal Opportunity Commission, Sex discrimination, sexual harassment and predatory behaviour.
- It is vital that defined entities have appropriate and tailored reporting mechanisms and a culture where people feel safe to report. Reporting mechanisms should be developed in consultation with victim-survivors and relevant experts to enable organisations to respond swiftly and appropriately when a complaint is made, as well as to create an environment of trust and safety. Similarly, it is important that organisations covered by the Act have adequate supports in place for victim-survivors across all aspects of the reporting process, as well as for those who witness or receive disclosures of harassment.
- VAGO, Sexual Harassment in the Victorian Public Service, 2019, pp 12, 22, 25, accessed 9 August 2022; AHRC, Respect@Work, p 716.
- AHRC, Respect@Work, p 716; US Equal Employment Opportunity Commission (EEOC), Select Task Force on the Study of Harassment in the Workplace, EEOC, June 2016, p 36, accessed 9 August 2022..
- VAGO, Sexual Harassment in the Victorian Public Service, p 25.
- PE Villegas (2019) ‘“I made myself small like a cat and ran away”: workplace sexual harassment, precarious immigration status and legal violence’, Journal of Gender Studies, 2019, 28(6): pp. 674-686, doi: 10.1080/09589236.2019.1604326.
- Sojo et al., What works, what’s fair?.
- Commission for Gender Equality in the Public Sector (CGEPS), How do I maintain my employees’ privacy?, CGEPS website, 2021, accessed 26 July 2022.
Updated