

Introduction
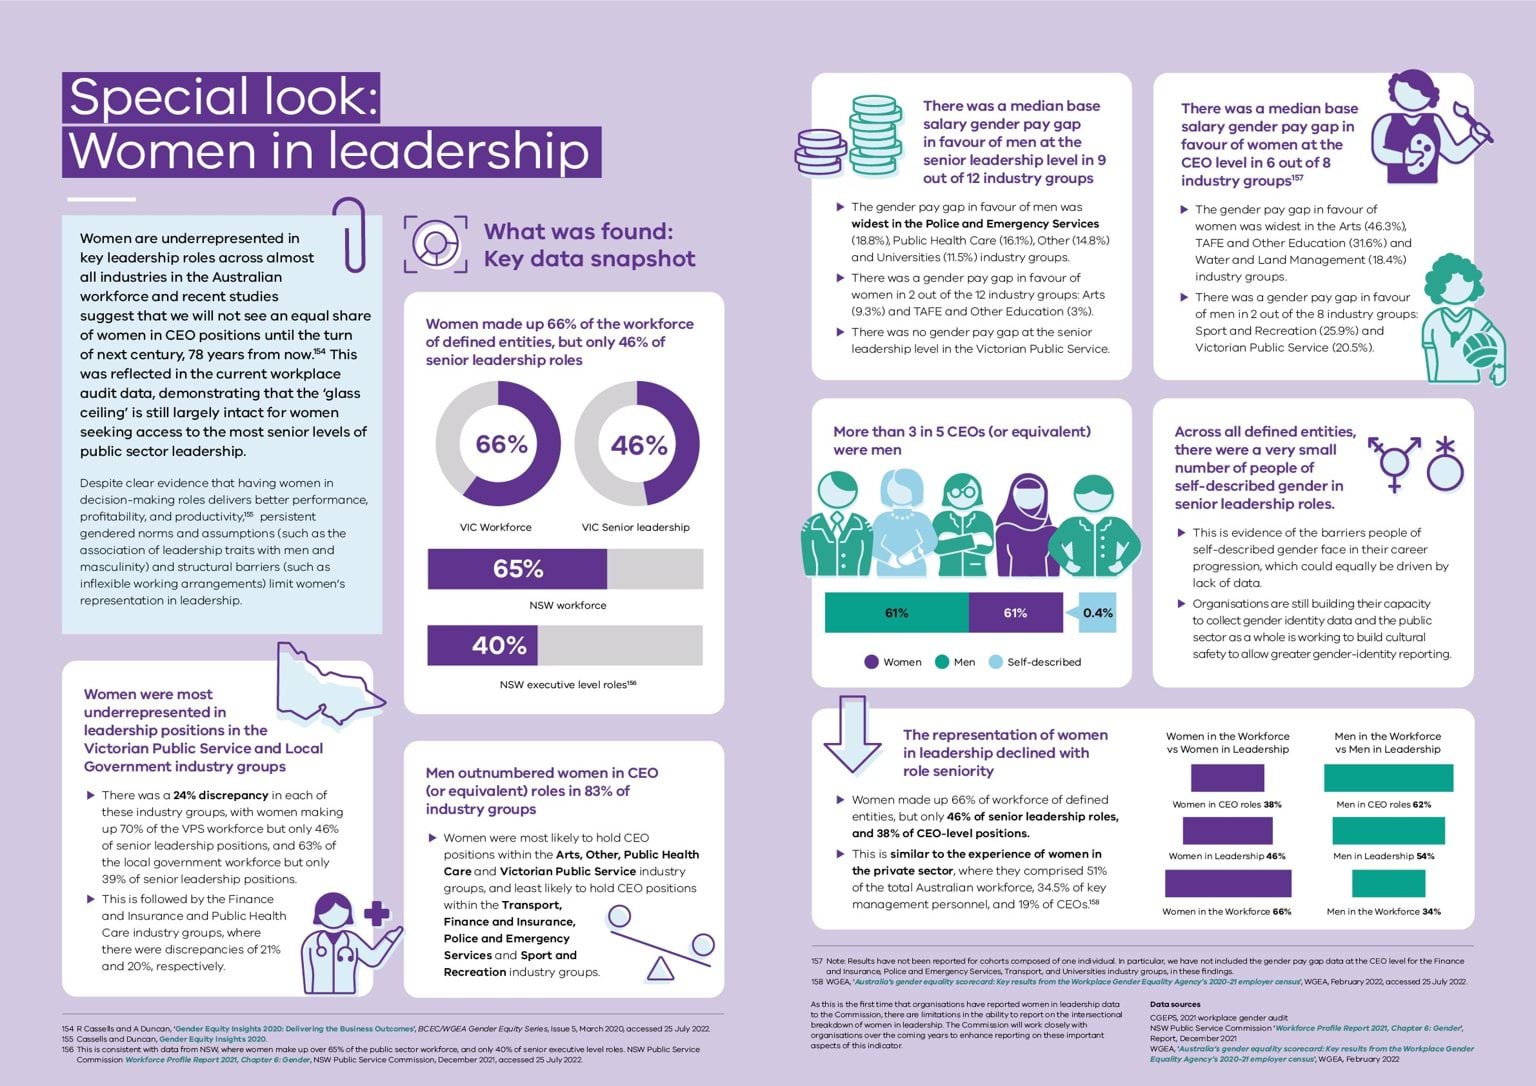
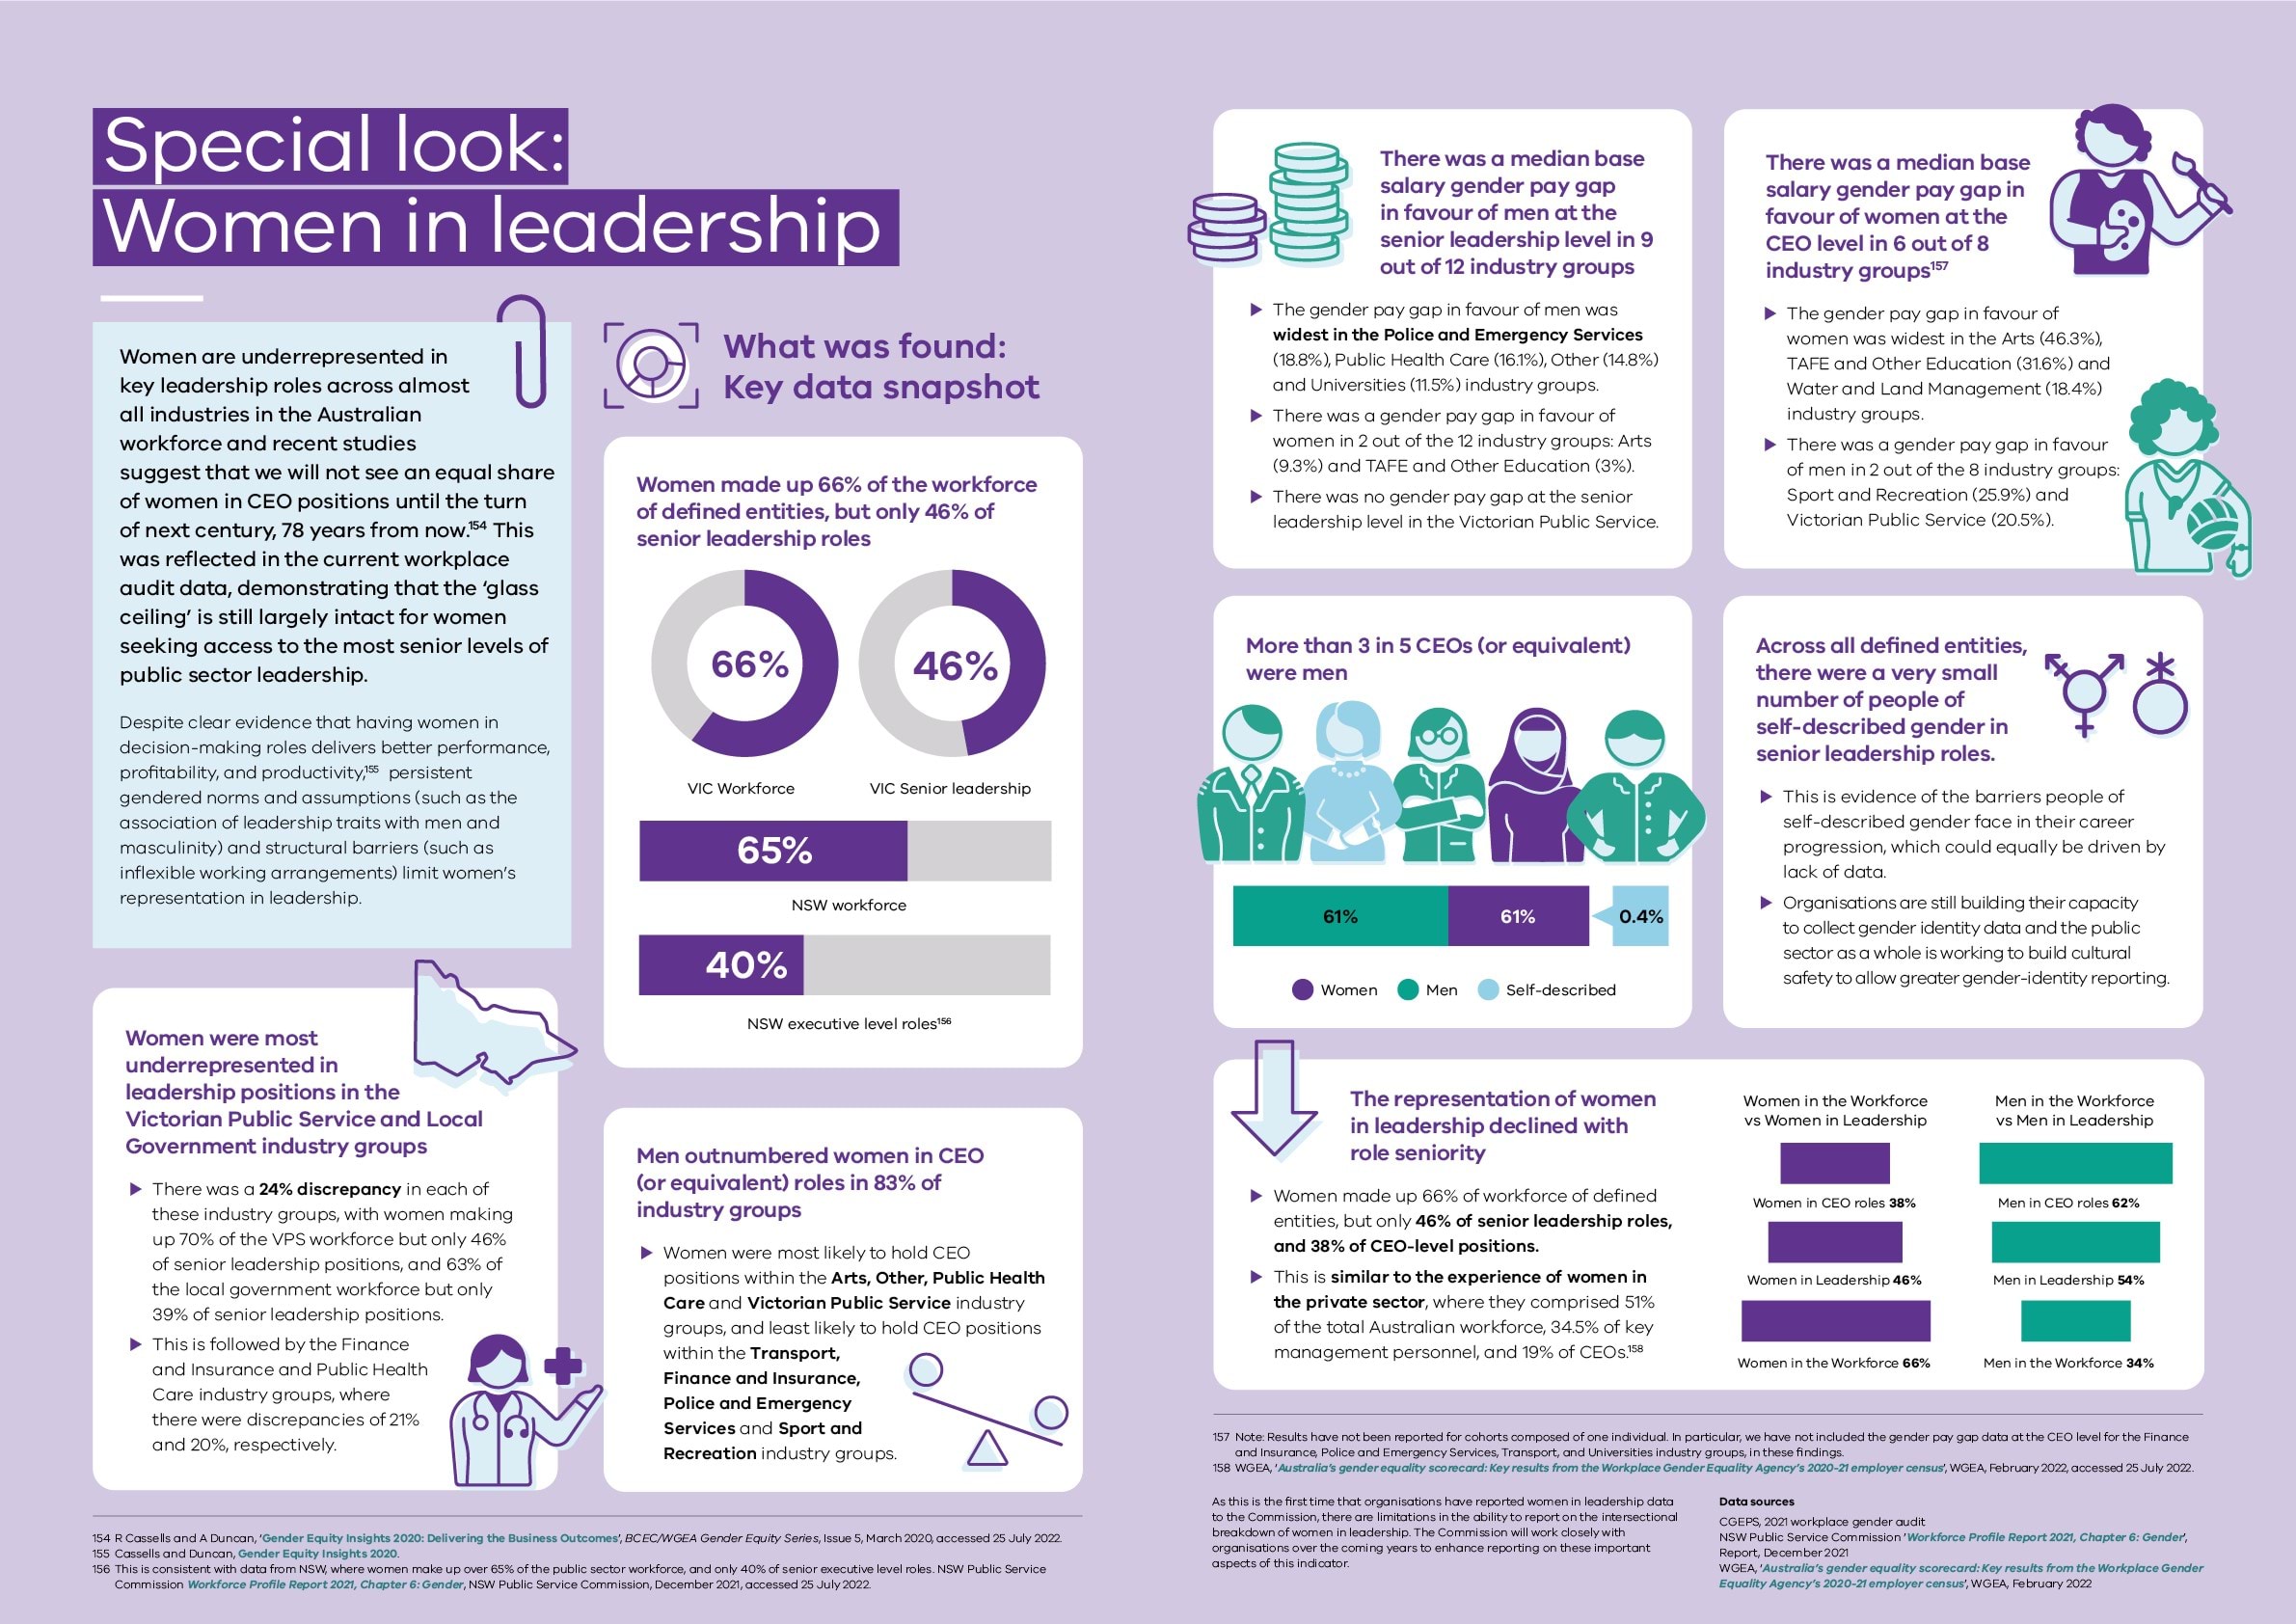
Women are underrepresented in key leadership roles across almost all industries in the Australian workforce and recent studies suggest that we will not see an equal share of women in CEO positions until the turn of next century, 78 years from now.154 This was reflected in the current workplace audit data, demonstrating that the ‘glass ceiling’ is still largely intact for women seeking access to the most senior levels of public sector leadership.
Despite clear evidence that having women in decision-making roles delivers better performance, profitability, and productivity, persistent gendered norms and assumptions (such as the association of leadership traits with men and masculinity) and structural barriers (such as inflexible working arrangements) limit women’s representation in leadership.155
What was found: Key data snapshot
Women made up 66% of the workforce of defined entities, but only 46% of senior leadership roles.
- Women were underrepresented in senior leadership across two-thirds of defined entity industry groups.
- This is consistent with data from NSW, where women make up over 65% of the public sector workforce, and only 40% of senior executive level roles.156
Women were most underrepresented in leadership positions in the Victorian Public Service and Local Government industry groups.
- There was a 24% discrepancy in each of these industry groups, with women making up 70% of the VPS workforce but only 46% of senior leadership positions, and 63% of the local government workforce but only 39% of senior leadership positions.
- This is followed by the Finance and Insurance and Public Health Care industry groups, where there were discrepancies of 21% and 20%, respectively.
Men outnumbered women in CEO (or equivalent) roles in 83% of industry groups.
- Women were most likely to hold CEO positions within the Arts, Other, Public Health Care and Victorian Public Service industry groups, and least likely to hold CEO positions within the Transport, Finance and Insurance, Police and Emergency Services and Sport and Recreation industry groups.
There was a median base salary gender pay gap in favour of men at the senior leadership level in 9 out of 12 industry groups.
- The gender pay gap in favour of men was widest in the Police and Emergency Services (18.8%), Public Health Care (16.1%), Other (14.8%) and Universities (11.5%) industry groups.
- There was a gender pay gap in favour of women in 2 out of the 12 industry groups: Arts (9.3%) and TAFE and Other Education (3%).
- There was no gender pay gap at the senior leadership level in the Victorian Public Service.
More than 3 in 5 CEOs (or equivalent) were men.
- 61% of CEO positions were held by men, 38% by women, and 0.4% by people of self-described gender.
There was a median base salary gender pay gap in favour of women at the CEO level in 6 out of 8 industry groups.157
- The gender pay gap in favour of women was widest in the Arts (46.3%), TAFE and Other Education (31.6%) and Water and Land Management (18.4%) industry groups.
- There was a gender pay gap in favour of men in 2 out of the 8 industry groups: Sport and Recreation (25.9%) and Victorian Public Service (20.5%).
Across all defined entities, there were a very small number of people of self-described gender in senior leadership roles.
- This is evidence of the barriers people of self-described gender face in their career progression, which could equally be driven by lack of data.
- Organisations are still building their capacity to collect gender identity data and the public sector as a whole is working to build cultural safety to allow greater gender-identity reporting.
The representation of women in leadership declined with role seniority.
- Women made up 66% of workforce of defined entities, but only 46% of senior leadership roles, and 38% of CEO-level positions.
- These discrepancies were greater in some industries. For example, women made up 61% of the Finance and Insurance industry workforce, but held only 40% of senior leadership positions, and 17% of CEO (or equivalent) positions.
- This is similar to the experience of women in the private sector, where they comprised 51% of the total Australian workforce, 34.5% of key management personnel, and 19% of CEOs.158
As this is the first time that organisations have reported women in leadership data to the Commission, there are limitations in the ability to report on the intersectional breakdown of women in leadership. The Commission will work closely with organisations over the coming years to enhance reporting on these important aspects of this indicator.
Special look: Women in leadership (infographic)
References
- R Cassells and A Duncan, ‘Gender Equity Insights 2020: Delivering the Business Outcomes’, BCEC/WGEA Gender Equity Series, Issue 5, March 2020, accessed 25 July 2022.
- Cassells and Duncan, Gender Equity Insights 2020.
- NSW Public Service Commission Workforce Profile Report 2021, Chapter 6: Gender, NSW Public Service Commission, December 2021, accessed 25 July 2022.
- Note: Results have not been reported for cohorts composed of one individual. In particular, we have not included the gender pay gap data at the CEO level for the Finance and Insurance, Police and Emergency Services, Transport, and Universities industry groups, in these findings.
- WGEA, Australia’s gender equality scorecard: Key results from the Workplace Gender Equality Agency’s 2020-21 employer census [PDF 1.00 MB], WGEA, February 2022, accessed 25 July 2022.
Updated