

- Date:
- 5 Sep 2022
This Baseline report provides an overview of the current state and nature of gender inequality across the span of organisations reporting for the first time under the Gender Equality Act 2020 (Vic) (Act).
It will assist the Commission, defined entities, and the Victorian community to understand:
- where the challenges and gaps are to progressing gender equality
- where to focus efforts to improve.
It will provide a starting point from which to:
- track change against each indicator
- determine if reasonable and material progress is being made
- identify areas where the development of targets and/or quotas under the Act could drive greater progress.
Acknowledgement of Country
The Commission for Gender Equality in the Public Sector acknowledges and pays respect to the Traditional Owners of the lands on which we are proud to be located. Our office is based on the lands of the Wurundjeri people – the lands on which many of our team members also live and work from home. Other team members live and work on Bunurong land and Dja Dja Wurrung land.
We also acknowledge the Traditional Owners and Custodians of Country throughout Victoria and pay our respects to them, their cultures, and their Elders past and present. We recognise the deep and enduring connection of Aboriginal and/or Torres Strait Islander peoples to Country and their continuing custodianship of the land, waterways and seas.
We proudly recognise the First Nations peoples as having the world’s oldest living cultures, and acknowledge that the heritage, traditions and customs of Aboriginal communities throughout Victoria are vibrant, rich and diverse. We value this knowledge and consider it a source of strength and opportunity.
We respect that Elders and other leaders of Aboriginal communities in Victoria are critical to redressing inequality and disadvantage and improving outcomes for Victorian women. Their leadership includes First Nations women, lesbian, gay, bisexual, trans and gender diverse, non-binary, sistergirls, brotherboys, intersex and queer folk who drive gender equality across Victoria. We thank them and honour their important work.
As we reflect on the continuing impact of government policies and practices, we recognise our responsibility to collaborate and work together with First Nations peoples, families and communities towards improved economic, social and cultural outcomes.
Message from the Commissioner
Message from the Commissioner

As Victoria’s inaugural Public Sector Gender Equality Commissioner, I am pleased to be delivering this report analysing the Commission’s workplace gender equality data. Data was collected for the first time in late 2021 from almost 300 organisations covered by the Gender Equality Act 2020. This Baseline report provides a sector-wide overview of the state and nature of workplace gender inequality and will serve as the starting point against which to measure future progress.
I want to commend the hard work of all the staff who supported their organisations to meet their obligations under the Act, as well as my own small (but mighty) team at the Commission. The collection and analysis of this data represents a significant milestone in gender equality reporting in Australia; one that was achieved while also contending with the challenges and uncertainty brought about by COVID-19. The pandemic disrupted the implementation of the Act in many ways. At the same time, it widened the national gender pay gap and reversed or stalled progress made towards gender equality on several fronts. Therefore, it is more important than ever that we keep driving action to promote gender equality.
As in any new process, there is significant learning to be incorporated into future workplace audit reporting rounds to improve clarity, efficiency, and impact. In particular, there is work to be done to better understand and address how other forms of disadvantage and discrimination intersect with gender inequality. My team and I are committed to building this evidence base and capability. To support this, we will release a separate report in early 2023, which will present intersectional insights from the audit data, along with insights and recommendations from the intersectional research we have commissioned this year.
There are also improvements to be made in terms of resourcing the work required to meet the obligations under the Act. A study we commissioned in 2021 found that many entities had delegated the audit and planning work to women at lower levels of their organisations who were employed on a temporary basis, with little consideration of ongoing resources to support implementation. I acknowledge that many organisations were operating in a challenging environment and that there are always lessons learnt the first time such ambitious work is undertaken. However, the Act requires that organisations ensure adequate resourcing is set aside to implement the obligations, including to demonstrate the ‘reasonable and material’ progress that is required every 2 years.
We’re at a critical juncture for gender equality in Australia. Yet, there is a lot to be optimistic about. This baseline report shows that organisations covered by the Act are performing well in comparison to the private sector across many gender equality outcomes, and while there is still much progress to be made, it is very clear that there is a real appetite for change. In this first cycle of reporting, defined entities have repeatedly demonstrated their commitment to progressing gender equality, with many engaging passionately with me and my team to ensure they achieve the best gender equality outcomes possible.
I want to acknowledge all the work that has been done to get us to the point where we now have this nation-leading baseline data. I am confident that Victoria will continue to lead by example in addressing the systemic drivers of gender inequality within the workforce, and in inspiring other jurisdictions on the road towards gender equality in their organisations and communities.
I look forward to continuing to work with organisations to assist them in driving meaningful progress toward workplace gender equality.
Dr Niki Vincent
Public Sector Gender Equality Commissioner
Executive summary
A summary of the key findings from the analysis of audit data collected under the Gender Equality Act 2020 in 2021.
Driving gender equality through the Gender Equality Act 2020 (Vic)
Under the Gender Equality Act 2020 (Vic) (the Act), organisations covered by the Act – known as defined entities – are subject to a number of obligations that require them to take positive and transparent action towards achieving gender equality in their workplaces and in their public policies, programs and services.
The elements of the Act that embed this transparency and progress towards gender equality are part of what makes this legislation nation-leading.1 While comparable legislative frameworks nationally or around the globe may require the submission of gender equality data, most do not require organisations to publish their data, develop action plans to address any inequalities revealed in the data, or make reasonable and material progress to promote gender equality in every 2-year period.2
The Commission is committed to supporting defined entities to meet their obligations under the Act through improved training, education, and guidance resources. This baseline report of workplace gender audit data and the Commission’s upcoming in-depth analysis of each organisation’s Gender Equality Action Plan (GEAP) and companion baseline report on intersectional analyses, will help the Commission understand how to tailor its support in future years. It will also help defined entities understand what actions they need to take to embed systems and processes that support full and effective compliance with the Act.
The Commission acknowledges the effort and dedication of the people in defined entities across the state who have undertaken this important work, many for the first time. We recognise the powerful contribution this will make towards achieving gender equality in defined entities and the broader Victorian community.
Establishing the baseline for ongoing progress
This Baseline Report covers the key findings from the inaugural workplace gender audit data collected under the Act in 2021.
Establishing how defined entities are tracking towards workplace gender equality is crucial to ensuring we can build on the gains we have already made in the public sector. Synthesising these results is also vital to support the sector to address persistent blockers of, and accelerate progress towards, gender equality.
It is important to recognise that this is the first time that defined entities have been required to conduct a workplace gender audit. As such, the audit has revealed areas of limited data availability and poor data quality (particularly in relation to intersectional data).3 Where existing processes did not allow for the collection of sufficient data, or did not yet exist, organisations were asked to specify how they would rectify this as part of their GEAPs. Similarly, the Commission will work to improve its systems and support entities to improve their systems, in order to improve data quality over time. A process evaluation will be undertaken to identify areas for improvement and ensure greater efficiency and quality in future reporting rounds. Specific recommendations for actions to improve data quality are included throughout this report.
The gender pay gap
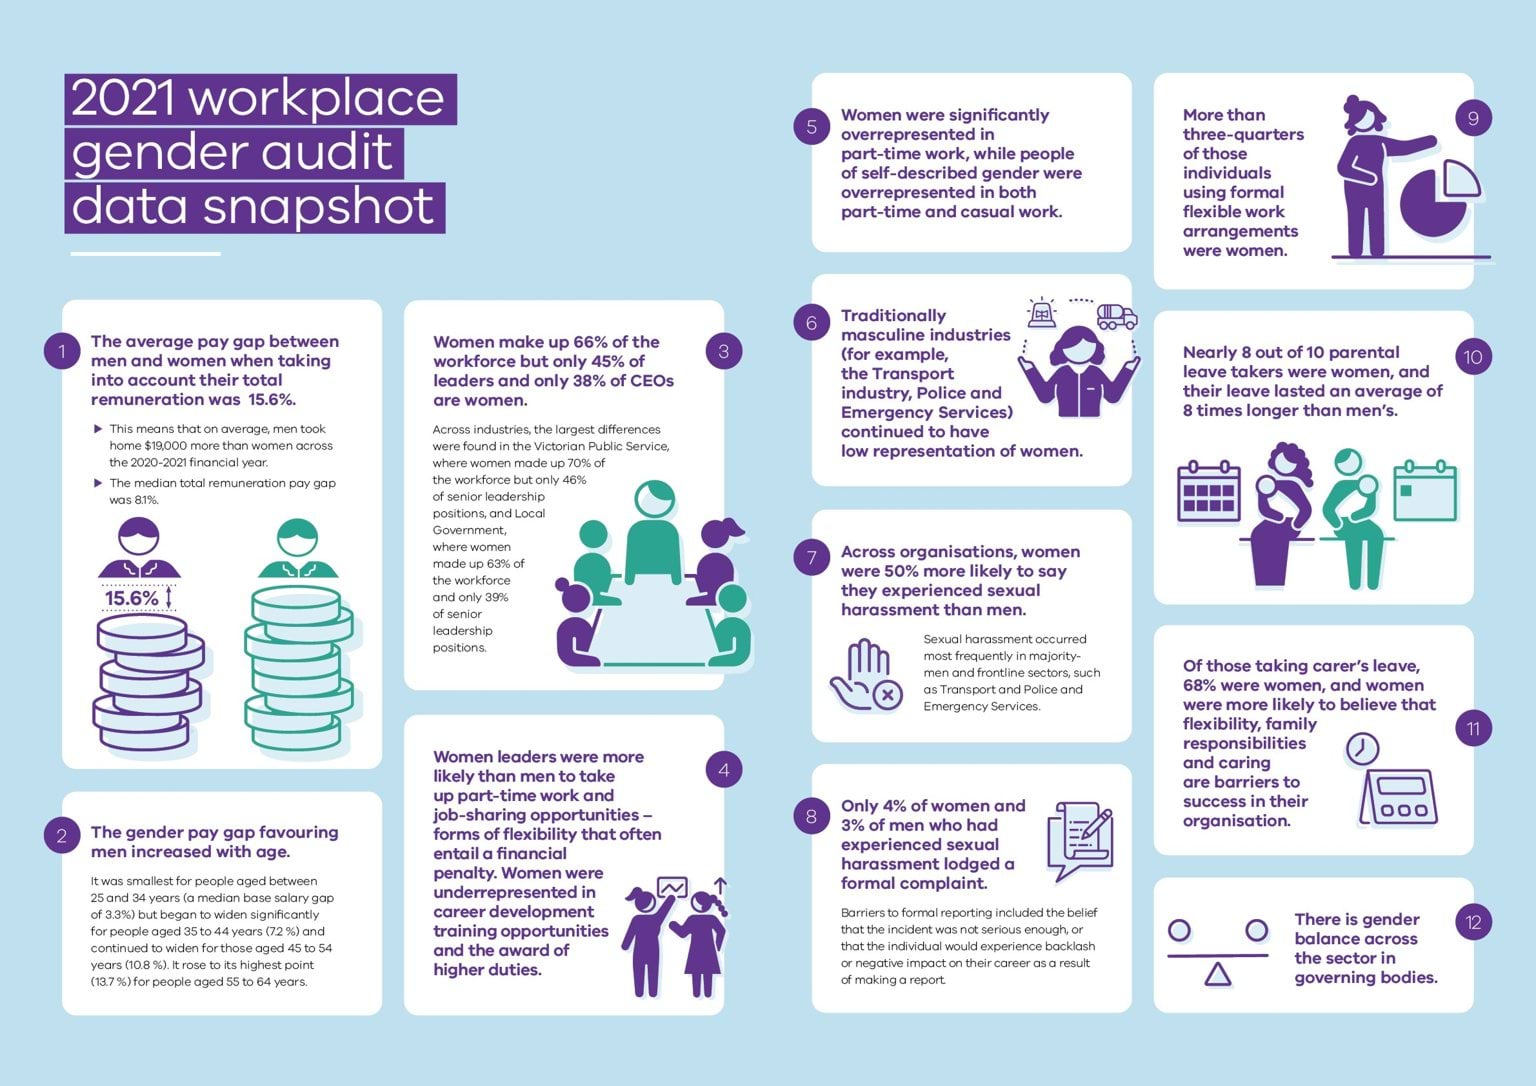
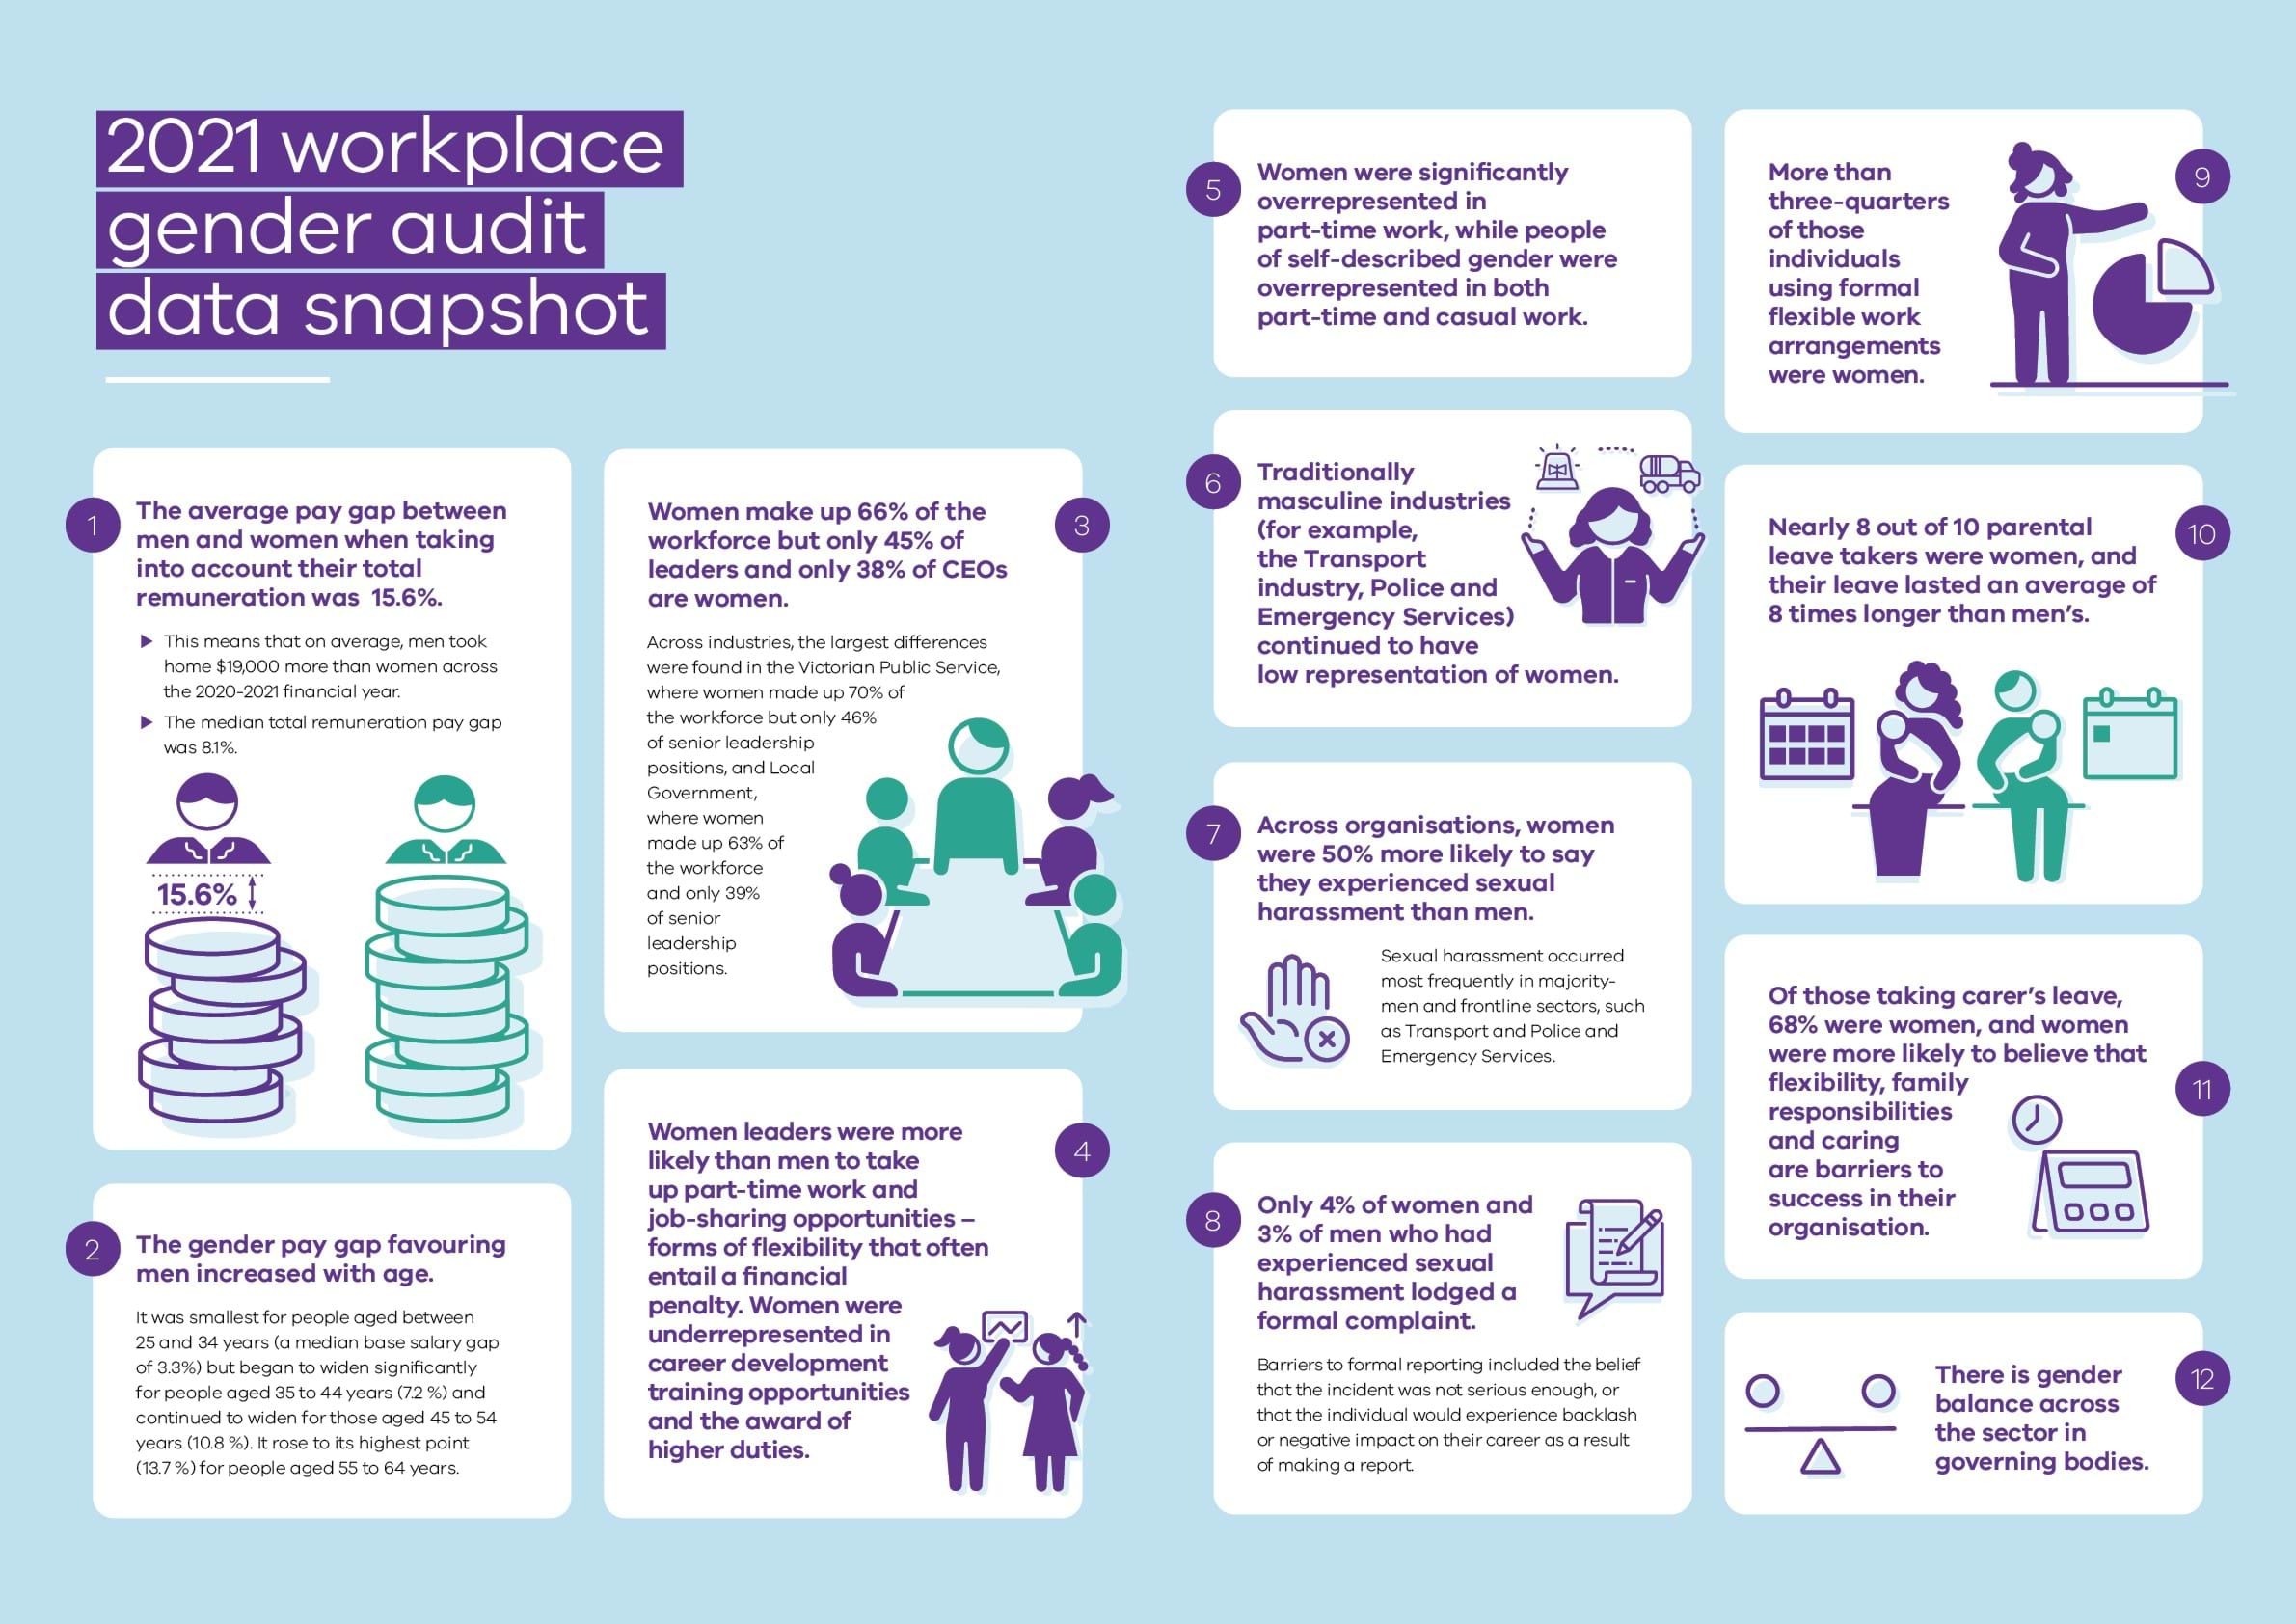
Across all the organisations covered by the Act, the average pay gap between men and women when taking into account their total remuneration was 15.6%. This means that on average, men took home $19,000 more than women across the 2020–2021 financial year. The median total remuneration pay gap was 8.1%.
In comparison, in the private sector, Australia’s national total remuneration gender pay gap was 22.8% or $25,792, as calculated by the Workplace Gender Equality Agency.
While it is encouraging to see organisations reporting under the Act doing better than the private sector when it comes to equal remuneration, there is still a very significant gap to close. Pay gaps existed in favour of men across all occupational groups (except at the CEO level) among defined entities. This supports existing research that the constellation of gender inequalities and biases that combine to create the gender pay gap operate across different jobs and is not a result of stereotypically ‘masculine’ occupations alone.
Part-time work
Women experienced strong representation across organisations covered by the Act, comprising 66% of all employees. However, this representation masks persistent inequalities. Most notably, when we drilled down into employment type, significant imbalances emerged. Women were significantly overrepresented in part-time work, while people of self-described gender were overrepresented in both part-time and casual work. Traditionally masculine industries (for example, the Transport industry, Police and Emergency Services) continued to have low representation of women.
Leadership
While women comprised 66% of the total workforce, only 45% of those in senior leadership roles were women and more than 3 in 5 CEOs were men. Women were also underrepresented in career development opportunities, training, and the award of higher duties.
Encouragingly, there was a gender balance between men and women on the boards of defined entities, which has been supported through Victorian Government targets introduced in 2015.
Sexual harassment
Across defined entities, women were 50% more likely to say they experienced sexual harassment than men. Sexual harassment occurred most frequently in majority-men and frontline sectors, such as Transport and Police and Emergency Services. Lack of formal reporting is a significant issue, with only 4% of women and 3% of men who had experienced sexual harassment lodging a formal complaint.
The Commission received data relating to formal sexual harassment complaints from less than two-thirds of organisations covered under the Act. Among those organisations that submitted information on formal reports of sexual harassment, there remained significant data gaps. These included a lack of data about the complainant’s relationship to the organisation, the outcomes of complaints, and complainants’ satisfaction with those outcomes. This is concerning, as comprehensive reporting and data collection systems are central to addressing workplace sexual harassment.
Flexible work and caring arrangements
More than three-quarters of those individuals using formal flexible work arrangements were women. Women leaders were also more likely than men to take up part-time work and job-sharing opportunities – forms of flexibility that often entail a financial penalty.
Nearly 8 out of 10 parental leave takers were women, and their leave lasted an average of 8 times longer than men’s.
Of those taking carer’s leave, 68% were women, and women were more likely to believe that flexibility, family responsibilities and caring are barriers to success in their organisation.
Taken together, these findings suggest that increasing men’s uptake of flexible working options and leave to care for children or others will have a significant positive impact on gender equality at work and in the home, and on women’s ability to participate equally in paid employment.
2021 workplace gender audit data snapshot
Summary of recommendations
|
Chapter |
Recommendation |
|
Chapter 1: Workforce gender composition and segregation |
Recommendation 1.1: Regular collection, analysis and reporting of accurate gender-disaggregated trend data on workforce composition is essential to improve workplace gender equality |
|
Recommendation 1.2: Build capability to effectively and safely collect intersectional workforce composition data |
|
|
Recommendation 1.3: Collect further data to help your organisation understand how forms of workplace discrimination might impact on workforce composition, occupational segregation and leadership opportunities |
|
|
Chapter 2: Equal pay |
Recommendation 2.1: Undertake organisation-wide, by-level and like-for-like pay gap analyses at least annually |
|
Recommendation 2.2: Assess all the factors identified as legitimate causes of pay variation for potential bias |
|
|
Recommendation 2.3: Invest in the development of workforce and system capability to create links between pay auditing and pay-related practices and decisions |
|
|
Recommendation 2.4: Invest in data collection systems that allow for more granular intersectional gender pay gaps to be measured and addressed |
|
|
Chapter 3: Workplace sexual harassment |
Recommendation 3.1: Collect and monitor both data that provides insight into the number of formal sexual harassment allegations and their characteristics, as well as anonymous survey data in relation to unreported experiences of sexual harassment |
|
Recommendation 3.2: Collect data on informal, as well as formal, workplace sexual harassment complaints |
|
|
Recommendation 3.3: Collect data about the experiences of people with intersectional attributes who report sexual harassment in the workplace |
|
|
Recommendation 3.4: Collect data on efforts to prevent sexual harassment in the workplace |
|
|
Chapter 4: Recruitment and promotion practices |
Recommendation 4.1: Embed gender equality data collection across recruitment, selection and onboarding processes |
|
Recommendation 4.2: Improve data collection about formal and informal career development and training opportunities, particularly for intersectional cohorts |
|
|
Chapter 5: Leave and flexible work |
Recommendation 5.1: Monitor both formal and informal flexible work arrangements, as well as feedback about how to improve uptake from employees, managers and executives |
References
- L Ryan et al., Laying the Foundation for Gender Equality in the Public Sector in Victoria: Final Project Report, University of Melbourne, 2022.
- M Cowper-Coles et al., Bridging the Gap? An analysis of gender pay gap reporting in six countries, Global Institute for Women’s Leadership, 2021, accessed 22 July 2022.
- For the first time under Australian gender equality reporting legislation, organisations covered by the Act were required to provide data disaggregated not only by gender, but across a range of attributes. As outlined in the Introduction, the Commission will publish insights from this intersectional data in a companion report on intersectionality, to be released in 2023.
Introduction
An introduction to the Gender Equality Act 2020 and this baseline report, including methodology and structure of the report.
The Gender Equality Act 2020
History of the Act
In 2016, Victoria’s Royal Commission into Family Violence found that Victoria must address gender inequality in order to reduce family violence and all forms of violence against women. In response, Victoria’s first gender equality strategy, Safe and Strong, was released in December 2016, which committed to legislative change to promote gender equality.
In 2018, an exposure draft of the Gender Equality Bill was released for extensive community engagement and public consultation, including a Citizen’s Jury of Victorians. The feedback from consultation was overwhelmingly positive, with stakeholders recognising the Bill as a once-in-a-generation opportunity to influence gender equality policy, culture and attitudes across Victoria.
The Gender Equality Act 2020 (Act) passed the Victorian Parliament in February 2020 and came into force on 31 March 2021. The Commission for Gender Equality in the Public Sector (Commission) was established to support the implementation of the Act.
Dr Niki Vincent commenced her appointment as Victoria’s inaugural Public Sector Gender Equality Commissioner (Commissioner) in October 2020. Dr Vincent is supported in her role by the Commission. As Commissioner, Dr Vincent is responsible for overseeing the implementation of the Act and plays a key leadership role in promoting gender equality in Victorian workplaces and communities.
Scope of the Act
The Act is the first of its kind in Australia and is recognised globally as leading gender equality legislation. The Act applies to over 300 Victorian public sector organisations (known as defined entities) that have 50 or more employees, including universities and local councils (a total of approximately 450,000 workers or 12% of Victoria’s workforce). A list of defined entities and their industry groupings is provided at Annexure 1 of this report.
The Act requires defined entities to:
- develop, publish and implement a Gender Equality Action Plan (GEAP) every 4 years based on the results of a workplace gender audit
- make reasonable and material progress in relation to the Act’s workplace gender equality indicators, and publicly report on this progress every 2 years
- undertake gender impact assessments on all new policies, programs and services that impact the public and publicly report this activity every 2 years
- take into account that gender inequality may be compounded by other forms of disadvantage or discrimination, and have regard to this when developing strategies for improvement
The Act is unique and innovative in equality legislation. World-leading features include a positive duty on defined entities to consider and promote gender equality, the integration of consultation as a core feature of its procedural requirements, and a range of increasingly rigorous compliance and enforcement powers for the Commissioner.
The Act is the first formal integration of the concept of compounded discrimination (intersectionality) into Australian equality law. This means that defined entities must consider the disadvantage or discrimination that a person may experience on the basis of Aboriginality, age, disability, ethnicity, gender identity, race, religion and/or sexual orientation in addition to gender inequality across the majority of their obligations. This includes as part of their duty to conduct workplace gender audits, promote gender equality, develop their GEAPs, and undertake gender impact assessments.
The Act also includes powers for the Commissioner to conduct dispute resolution for systemic gender equality issues that adversely affect a group or class of employees within a defined entity, where an enterprise agreement or workplace determination has a relevant gender equality clause allowing for the Commissioner’s involvement.
Over time, the Act will:
- increase women's economic security – by addressing the gender pay gap and gendered segregation in the workforce, ensuring gender equitable recruitment and promotion practices to strengthen retention, and addressing structural inequalities preventing women from accessing leadership positions.
- increase workforce participation rates – by reducing discrimination experienced by carers and parents, increasing men’s access to and uptake of flexible work arrangements and non-traditional caring roles, and increasing flexible work arrangements for all.
- improve health and wellbeing outcomes – by reducing rates of sexual harassment in the workplace, increasing/providing access to and uptake of flexible working arrangements, appropriate return to work arrangements and family violence leave, reduced impact of poverty and stress through increased economic security.
In 2025, a review will be conducted of the first 4 years of the Act’s operation to understand if it is on track to achieving these long-term goals. This review is a requirement under the Act and will be tabled in the Victorian Parliament by the Minister for Women.
The Commission for Gender Equality in the Public Sector
The Commission supports the Commissioner to oversee implementation of the Act. It provides support to defined entities by helping to build their capacity to understand and meet their obligations under the Act and make meaningful progress towards gender equality in their organisations. The Commission is responsible for functions under the Act including data reporting and tracking of progress, research and evaluation, education and training, and dispute resolution.
The Commission sits within the Fairer Victoria division of the Department of Families, Fairness and Housing and comprised 16 FTE (including the Commissioner) on 30 June 2022.
First year of the Act’s implementation
The Commission was allocated $13.4 million over four years as part of the 2020/2021 Victorian State Budget to support implementation of the Act. Initial funding supported the provision of assistance to defined entities to meet their obligations and development of a reporting platform and public data interface.
Educating and supporting defined entities about the Act
The early stages of the Act’s implementation were largely focused on educating and supporting defined entities to understand the Act and meet their new obligations. This included:
- developing a range of comprehensive guidance materials, including for undertaking workplace gender audits and analysing audit data, developing GEAPs, conducting gender impact assessments, and dispute resolution
- sector-specific advice and leading practice resources, published on the Commission’s website
- conducting a series of educational roadshows for defined entities, heads of organisations, peak bodies and relevant unions, led by the Commissioner
- establishing an expert Panel of Providers to provide specialist and technical advice to the Commission and defined entities
- delivering tailored sector-wide workshops and training sessions for workplace gender audits, GEAPs and gender impact assessments.
In the 2021 calendar year, Dr Vincent undertook 254 stakeholder engagements, including speeches, panel events and meetings, and engaged in 25 media interviews and op ed articles.
Reporting platform
In 2021, the Commission developed the Act’s reporting platform, which defined entities use to submit and view their obligations including workplace gender audits, GEAPs and progress reports.
Through the reporting platform and data interface, the Commission has collected 67 million data points (up to 230,000 data points per organisation) – the most comprehensive gender-disaggregated dataset on public sector organisations in Australia. This data will help us understand how defined entities are individually tracking against the set of gender equality indicators contained in the Act as well as the broader state and nature of gender inequalities across the sector.
Submission extensions
The COVID-19 pandemic created many challenges for most organisations covered by the Act. With these exceptional circumstances and uncertainty about ongoing impacts, the Commissioner granted 2-stage extensions for organisations to submit their workplace gender audit data in late 2021 and their GEAPs in early 2022. At the time of writing, 100% of workplace gender audits and 99% of GEAPs had been submitted and most had been assessed as compliant under the Act.
Regulation and Act amendment
The Commission has also developed 2 stages of regulations to streamline processes to reduce the overall burden on defined entities, expand the dispute resolution function to enable universities and local councils to refer systemic gender equality issues to the Commissioner, and incorporate a set of gender pay equity principles, which defined entities must have regard to when developing their GEAP.
A third stage of regulations is currently in development. These regulations propose that defined entities undertake progress audits every 2 years as part of their progress reports, to allow the Commissioner to set the format in which audits must be submitted, to prescribe library corporations as defined entities under the Act, and to enable library corporations to access the dispute resolution function. The Commission will undertake a comprehensive regulatory impact statement and consultation process over 2022. It is intended that the regulations will come into effect in early 2023, ensuring sufficient time for defined entities to prepare for undertaking progress audits, which will be due for submission in October 2023.
Amendments to the Act were made in June 2022 through the Justice Legislation Amendment Act 2022 to improve information-sharing provisions relating to the Commissioner’s dispute resolution function. These changes improve accountability and transparency in relation to systemic gender equality issues and assist the Commissioner to educate public sector organisations and the wider community about gender inequalities.
A focus on intersectionality
To understand and address workplace gender inequality effectively, we need to understand and address how gender intersects with other forms of disadvantage and discrimination. We know that people who experience multiple, interacting forms of discrimination face higher levels of workplace inequality than those who only experience one form of discrimination, or none at all.4 We also know that there are major gaps in intersectional data collection.5
The Act contributes to addressing this data deficit by requiring defined entities to collect, analyse and submit gender-disaggregated and intersectional workforce data to the Commission.
In the first workplace gender audit cycle, the Commission requested a broad range of intersectional data. This request was ambitious, but the Commission knew that aiming high would encourage organisations to submit the most complete and highest quality data they could. It would also help organisations to plan for future reporting.
For many defined entities, it was the first time they had been asked to collect and report on data of this nature, and often their systems were not configured to provide what the Commission asked for. As a result, there are significant data gaps and other issues with the way this data has been provided, making it more complicated to collate and to analyse accurately and meaningfully.
To do this in a comprehensive way will involve a suite of research (see below) and analysis work that the Commission will undertake throughout the remainder of 2022 and into early 2023. The Commission will publish the results in a companion report to this Baseline report, focusing on intersectionality in the first half of 2023.
Research
Research into how to achieve gender equality in workplaces and the community is vital to driving strong progress in Victoria and beyond. Undertaking research related to the Act and its objectives is an important function of the Commissioner. Targeted research will maximise and expand the impact of the Act, and build the evidence base about what works in promoting gender equality for everyone. To support this important work, the Commission undertakes several activities including developing targeted research funding, engaging in knowledge-sharing and running a student research internship program.
In 2021, the Commission funded its inaugural research grants round. The funded research projects spanned from investigating the social and political circumstances that led to the establishment of the Act, international best practice in organisational gender equality, and how organisations can effectively remove barriers to equality for culturally and linguistically diverse women in the public sector.
The second annual research grants round, announced in August 2022, will have a strong focus on intersectionality, building the evidence base on how gender intersects with other experiences of disadvantage in Victoria’s public sector workplaces. Key areas of focus include the experiences of Aboriginal women, women with disability and women from non-English speaking backgrounds, gendered experiences in rural locations, and how pregnancy, parenting and/or caring can impact organisational gender equality. These projects will involve consultation with people with lived experience from different communities to ensure their experiences are represented accurately and respectfully.
As part of their final report, research teams will provide recommendations for defined entities to increase their capacity to sensitively collect and analyse more comprehensive intersectional data over time, as well as how to better address intersecting forms of inequality. The findings will also form part of the Commission’s companion report to this Baseline report, focusing on intersectionality, to be published in the first half of 2023.
This Baseline report
In a national first, this Baseline report provides an overview of the current state and nature of gender inequality across the span of organisations reporting under the Act. It will assist the Commission, defined entities, and the Victorian community to understand where the challenges and gaps are to progressing gender equality, and where efforts on improvement should be focused. It will provide a starting point from which to track change against each indicator, determine if reasonable and material progress is being made, and identify areas where the development of targets and/or quotas under the Act could drive greater progress.
While the Act creates a strong framework to assess and improve gender inequities in the public sector workforce, society-wide cultural change will require the majority of Victorian workplaces outside of the current scope of the Act to also make progress on gender equality. The work of the Commission and defined entities demonstrates leadership in workplace gender equality and provides an opportunity to inspire change beyond the public sector.
While not a ‘silver bullet’ for addressing gender inequality across our whole society, by measuring and understanding gender inequalities in workplaces, developing deliberate, evidence-based strategies and action to address these, and transparently monitoring and reporting progress, we can achieve more powerful progress towards gender equality in Victoria and beyond.
Gender-disaggregated data in this report
Due to the data challenges mentioned above, this first Baseline report focuses on the high-level findings of the inaugural workplace gender audit, disaggregated by gender.
For the purposes of the 2021 workplace gender audit, the Commission asked defined entities to collect gender-disaggregated data within three categories – women, men and self-described gender, recognising that some people identify their gender as being ‘woman’ or ‘man’ and some people understand their gender as a combination of these or neither. Some defined entities already collect gender data in this way, but many do not yet offer a self-described gender option.
Where there was sufficient data to report on the experiences of people of self-described gender in a meaningful way, the Commission has included this data in this report.
Intersectionality and this report
Alongside gender-disaggregated data, one area where the Commission has a more complete dataset is for experiences across different age brackets. This is because most organisations already have systems in place to collect and maintain accurate data about the age of their employees. Where possible, some of these age-related insights are included in this Baseline report.
In presenting this information, the Baseline report indicates where existing research and data tell us that intersecting forms of inequality have an impact on workplace gender equality. However, the Commission is not yet able to use its data to produce accompanying analyses for Aboriginal and Torres Strait Islander people, people with disability, people from diverse cultural backgrounds or religions, or LGBTQI+ individuals.
Intersectional data is sensitive. It is data about individuals who may belong to marginalised communities and who may experience discrimination and harassment.6 The Commission is dedicated to ensuring that its analysis of this data is robust and that it does not misrepresent the experiences of groups who already experience inequality.
Doing this work properly will take time, so in 2023 the Commission will produce a companion report to this Baseline report, focusing on the analysis of its intersectional data and incorporating key findings and recommendations from the research it has commissioned (and mentioned above).
Methodology
Background
This Baseline report is based on the 2021 workplace gender audit reports submitted to the Commissioner for Gender Equality in the Public Sector, Dr Niki Vincent by 298 organisations covered by the Act.
Under the Act, every defined entity was required to undertake a workplace gender audit in order to assess the state and nature of gender inequality in its workplace as at 30 June in the Gender Equality Action Plan reporting year. The first reporting year was 2021.
The Commission for Gender Equality in the Public Sector published workplace gender audit guidance in 2020 to advise defined entities of how to undertake a workplace gender audit.
The workplace gender audit required the collection of gender-disaggregated data – which is data that is broken down separately for women, men and gender diverse people – against the 7 workplace gender equality indicators set out in the Act. The indicators are:
- Gender composition of all levels of the workforce
- Gender composition of governing bodies
- Equal remuneration for work of equal or comparable value across all levels of the workforce, irrespective of gender
- Sexual harassment in the workplace
- Recruitment and promotion practices in the workplace
- Availability and utilisation of terms, conditions and practices relating to family violence leave, flexible working arrangements and working arrangements supporting workers with family or caring responsibilities
- Gendered segregation within the workplace
If available, defined entities were also required to report data about Aboriginality, age, disability, ethnicity, gender identity, race, religion and sexual orientation and were required to have regard to the disadvantage or discrimination that a person may experience on the basis of these attributes in addition to gender inequality (i.e. compounded or intersectional gender inequality).
Data measures and types
The 2021 measures were selected based on an extensive evidence review of local and international literature, consultation with key stakeholders including the Commission’s practice leaders group composed of 10 organisations representing different industries covered under the Act, the Commission’s Implementation Support Advisory Committee made up of leaders from across key stakeholder organisations including relevant unions and peak bodies, as well as commissioned expert research advice from the Social Research Centre.
As part of the 2021 workplace gender audit, organisations covered by the Act collected two categories of data – workforce data and employee experience data. The workforce data was extracted from defined entities’ internal data collection systems and provided to the Commission through an Excel template that was uploaded through the Commission’s reporting platform. The employee experience data was collected through surveys. The Victorian Public Sector Commission administered the questions required by the Commission for Gender Equality in the Public Sector via the People Matter Survey to about 90% of organisations covered by the Act. The remaining defined entities used another survey provider or administered the survey in-house and then uploaded the results to the Commission’s reporting platform. Each organisation covered by the Act was surveyed separately, and the results were reported as percentages of respondents. Items with fewer than 10 responses were suppressed by the survey provider to protect respondents’ privacy.
Information provided to the Commission for Gender Equality in the Public Sector was managed in line with relevant privacy laws. Defined entities were responsible for their own compliance with relevant privacy laws, including the Privacy and Data Protection Act 2014 (Vic) (PDP Act).
Evaluating workplace gender audit compliance
The Commission conducted a series of automated and manual tests measuring the quality, consistency and completeness of each workplace gender audit submission. The main objective of these tests was to determine whether each organisation met its obligations under the Act. For example, the Act requires that audits have regard to the equal remuneration workplace gender equality indicator – so if an organisation did not include pay data in its audit, it was evaluated as non-compliant. About 90% of organisations submitted compliant audits on the first attempt.
The secondary objective was to determine how closely each submission aligned to the guidance and data specifications we published. For example, the workplace gender audit guidance instructed organisations to report their employees’ pay as annualised figures. If an organisation instead reported its employees’ hourly pay rates, it was evaluated as compliant but not meeting our specifications. In cases like this, the Commission notified the organisation that their audit submission had been accepted, but that some of their data would be excluded from analysis and reporting.
Every organisation received feedback on their audit submission and was given an opportunity to revise their data. More than 90 organisations revised their audit data, including more than 50 voluntary resubmissions where organisations elected to improve the quality of their submission.
Workplace gender audit data quality
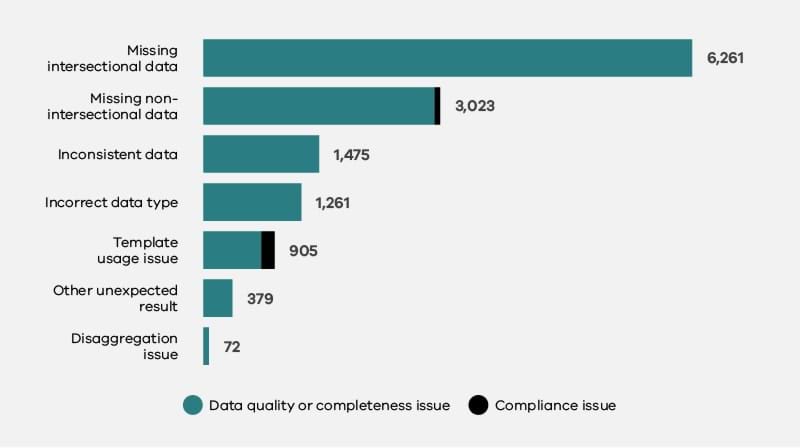
The most common issue observed with audit submissions was missing data. This audit was the most comprehensive workforce data collection exercise many organisations had ever undertaken, so some gaps in datasets were anticipated by the Commission.
The Commission also learnt that most organisations do not yet collect the demographic data required for intersectional analysis. This means organisations are missing out on the opportunity to identify areas where gender inequality may be compounded by other forms of disadvantage or discrimination.
Within the data organisations supplied, the most common issue observed was inconsistency between different parts of an audit. For example, if one data table indicated that an organisation employed 20 women on a part-time basis, but another table included only 19 women employed on a part-time basis, both tables were flagged for the organisation’s attention.
Fig 0.1. Workplace gender audit issues detected, by type and severity

Baseline analysis datasets
To calculate baseline results at the sector and industry levels, the Commission compiled audit submissions into 3 analysis datasets. Each was comprised of audit submissions received by the Commission as at 30 June 2022.7
Fig 0.2. Summary of workforce gender audit analysis datasets
|
Dataset |
Description |
Used for: |
|
Aggregated workforce data (296 organisations) |
Pre-aggregated data drawn from organisations’ payroll and HR systems, presented mainly as headcounts |
|
|
Aggregated employee experience data (293 organisations) |
Pre-aggregated data drawn from employee experience survey results, presented as percentages of respondents |
|
|
Unit level workforce data (273 organisations) |
De-identified employee-level data drawn from organisations’ payroll and HR systems |
|
Because the employee experience results were reported as percentages of respondents within each organisation, the survey results have been weighted based on the size and gender composition of each defined entity to produce the estimates included in this report.
The Commission received assistance in data analysis assistance from EY and GenderWorks in the preparation of this report.
Structure of the report
This report is structured in accordance with the key workplace gender equality indicators set out in the Act. Each chapter begins by explaining the importance of measuring progress against that indicator, followed by an overview of what data was collected for each indicator. This is followed by an examination of key findings, at industry and whole-of-sector levels. Each chapter concludes with a short discussion and includes recommendations relating to improving data collection and analysis processes to drive workplace gender equality progress.
References
- P Nangia and T Arora, ‘Discrimination in the workplace in Canada: An intersectional approach’, Canadian Journal of Sociology, 2021, 46(2):147–177.
- M Glennie et al., Gender pay gap reporting in Australia -Time for an upgrade, Global Institute for Women’s Leadership, 2021, accessed 25 July 2022.
- K Crenshaw, ‘Demarginalizing the intersection of race and sex: A black feminist critique of antidiscrimination doctrine, feminist theory and antiracist politics’, University of Chicago Legal Forum, 1989, 1(8): 139–167.
- Note that organisations may supersede prior audit submissions to correct errors or omissions. This may result in discrepancies between the results presented in this report and those presented through the Commission’s insights portal.
Workforce gender composition and segregation
This chapter looks at data for the indicators ‘gender composition of all levels of the workforce’, ‘gender composition of governing bodies’ and ‘gendered segregation within the workplace’.
Introduction
Women’s participation in the paid Victorian workforce has increased substantially over the past five decades, rising from 43.8% in February 1978 to 62.3% in June 2022.8 In contrast, men’s participation has fallen slightly from 80% to 72.1%.9 More recently, the Victorian Public Sector Commission has begun to measure the labour force participation of gender diverse Victorians, with an estimated 0.7% of Victorian public sector employees identifying as trans, non-binary or gender diverse, and 0.3% identifying as intersex in 2021.10
Despite these important shifts, the Victorian labour market remains highly segregated by gender, a persistent but repairable feature of labour markets around the world.11 This is because women’s increased workforce participation has not been consistent across industries and occupations.12
Unequal gender representation occurs vertically within organisations, with women often being overrepresented in lower-level occupations, classifications and pay grades. It also occurs horizontally across industries, as women constitute the majority of workers in lower-paid industries, such as community care and social assistance. This causes women to be disproportionately featured in the lower quartile of the earnings spectrum across the Victorian workforce.
Key issues: Why was this measured?
Women are underrepresented in management roles
Women are often concentrated in lower-paid administrative roles and have slower rates of career progression due to a number of cultural and structural factors, such as stereotypes about the types of work different genders may be interested in or can perform, unconscious and conscious biases in hiring, promotion and performance development, expectations around overtime, travel or time spent in the physical office, as well as attitudes towards flexible work.13
Women are overrepresented in lower-paid areas
Traditionally ‘masculinised’ sectors and industries (both those that are disproportionately majority-men industries, but also those industries and roles that are traditionally regarded as ‘men’s work’) tend to be better remunerated and respected within society. Conversely, traditionally feminised sectors and industries (which are majority-women industries and associated with feminine stereotypes related to caring) are less respected and lower paid.14
Collectively, women employed in the Health Care and Social Assistance industry and the Education and Training industry represent over one-third of all employed women in Victoria.15 These industries have lower salaries than majority-men industries,16 pay the lowest proportion of superannuation and discretionary payments,17 and have higher than average part-time and casual role rates.
Data on intersectional inequality is sparse
Research has shown that migrant and refugee women are more likely to be engaged in low-income, low-skill and insecure work,18 facing intersecting barriers to employment and promotion, such as lower English proficiency, insufficient work rights, lack of recognition of international qualifications and social exclusion.19
Similarly, we know that Aboriginal and Torres Strait Islander women are less likely to hold executive and management positions compared to Aboriginal and Torres Strait Islander men,20 and that women with disability are often given marginal jobs far below their capacity and are more concentrated in precarious and informal employment.21
Those who fall outside of the gender binary – including those who are non-binary, trans, gender diverse, agender, genderfluid or use any other term, as well as individuals who may identify as women or men but who do not conform to societal norms ascribed to these groups – may experience complex forms of discrimination or disadvantage (such as microaggressions and transphobia) in sectors seen as ‘masculine’ or ‘feminine’ because they do not conform to these narrow gender stereotypes.22
Insufficient data collection and research has been undertaken on the specific experiences of these groups in workplace settings across different industries.
How was this indicator measured?
Workforce composition
Defined entities were asked to provide data in relation to the composition of their workforce (by classification level to CEO), disaggregated by gender, employment basis and (where possible) intersectional data.23
As the gender composition of a workforce changes substantially depending on who is working full-time, part-time and casually, the Commission has measured this indicator:
- based on total headcount rather than FTE, meaning full-time, part-time, and casual workers were all counted the same way, and
- within each of the organisation’s full-time, part-time and casual workforces separately, relative to the organisation’s total workforce.
Given we know that unequal workforce composition is driven by a range of organisational, cultural and structural factors, such as leadership views on flexible working arrangements, the Commission also considered employee experience responses in relation to discrimination and flexible working arrangements.
Governing body composition
Defined entities were asked to provide data in relation to the composition of their governing body (such as a board of directors, or elected councillors in the case of local government) disaggregated by employment basis, gender, and intersectionality attributes.
Gender segregation
This indicator was measured by considering the gender composition of employees by occupation according to the ANZSCO classification codes, as assigned by defined entities, both across industries (for example, by calculating the gender composition of workers employed in a ‘Manager’ classification across organisations within a particular sector) and within defined entities (for example, by calculating the gender composition of workers employed in ‘Clerical and Administrative’ classifications within a particular defined entity).
Further detail about how each aspect of the measures was defined can be found in the glossary at the end of this report.
What was found: Key data insights
Total workforce and industry composition
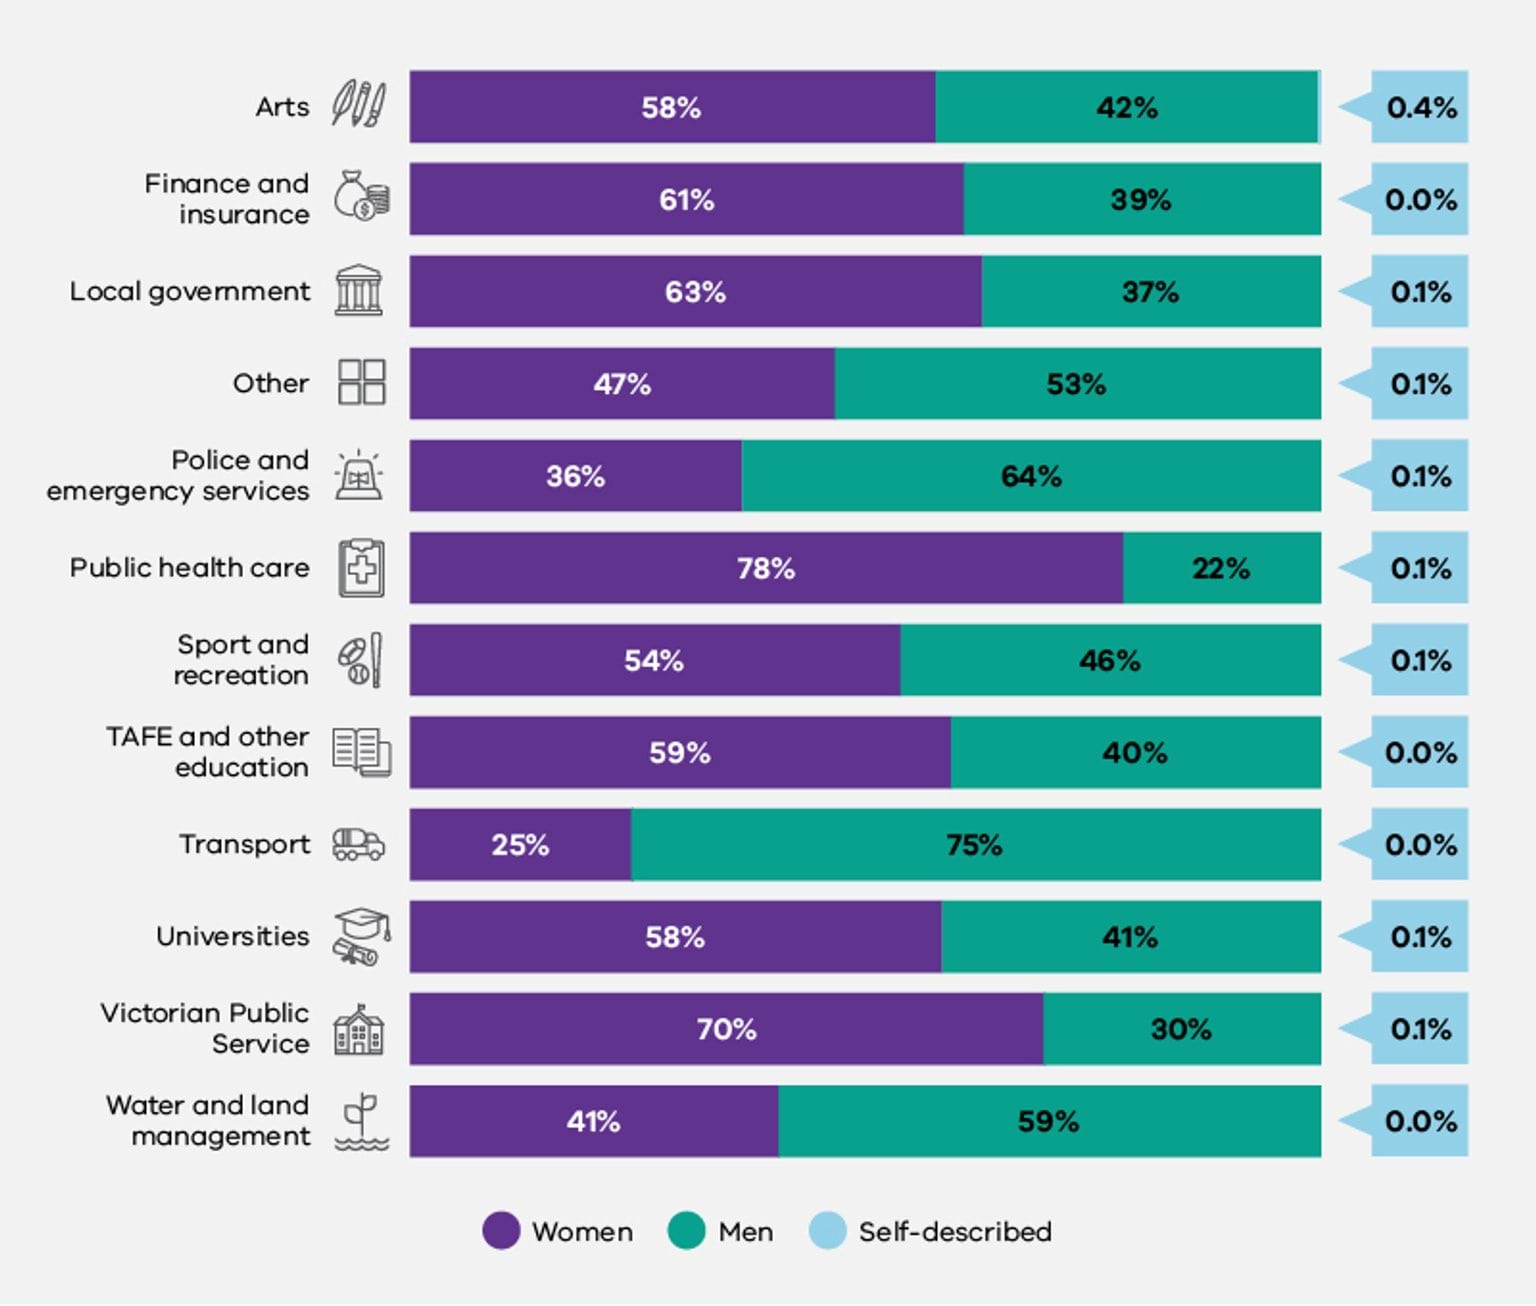
The total workforce of defined entities comprised 66% women, 34% men, and at least 0.1% people of self-described gender.24
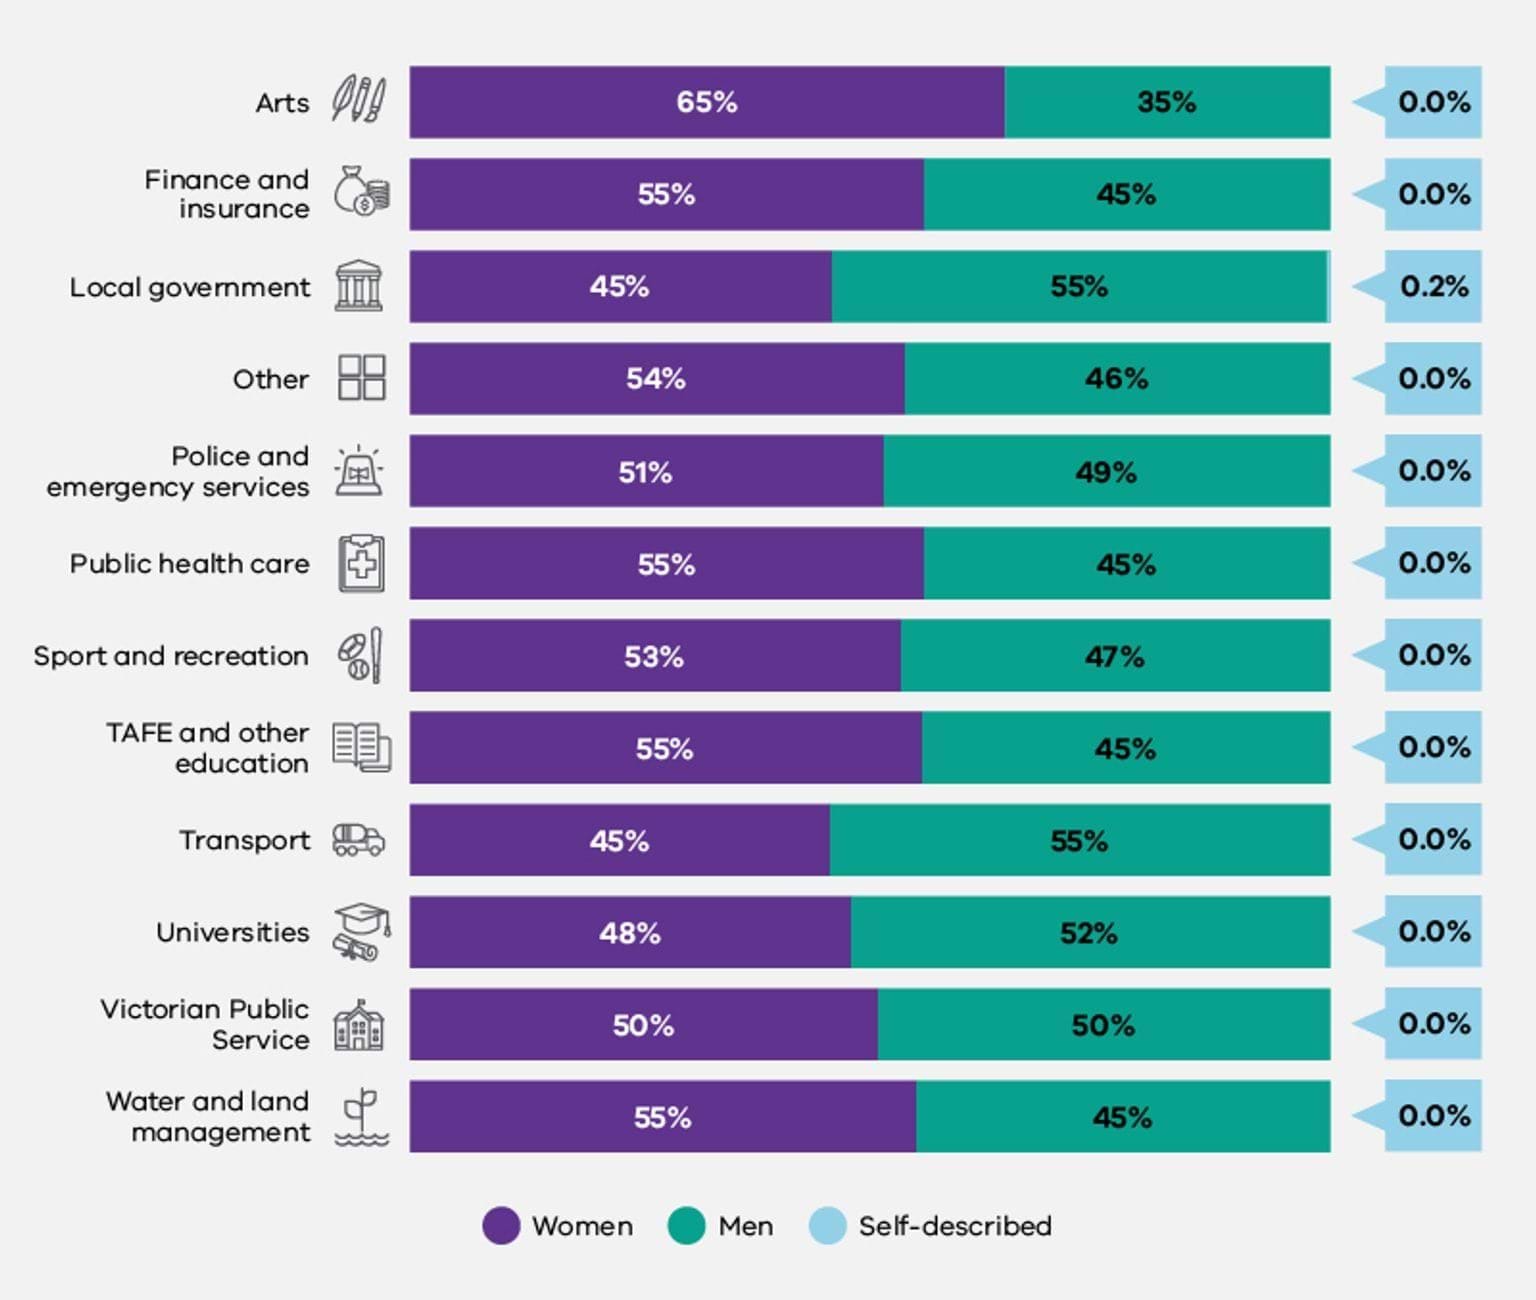
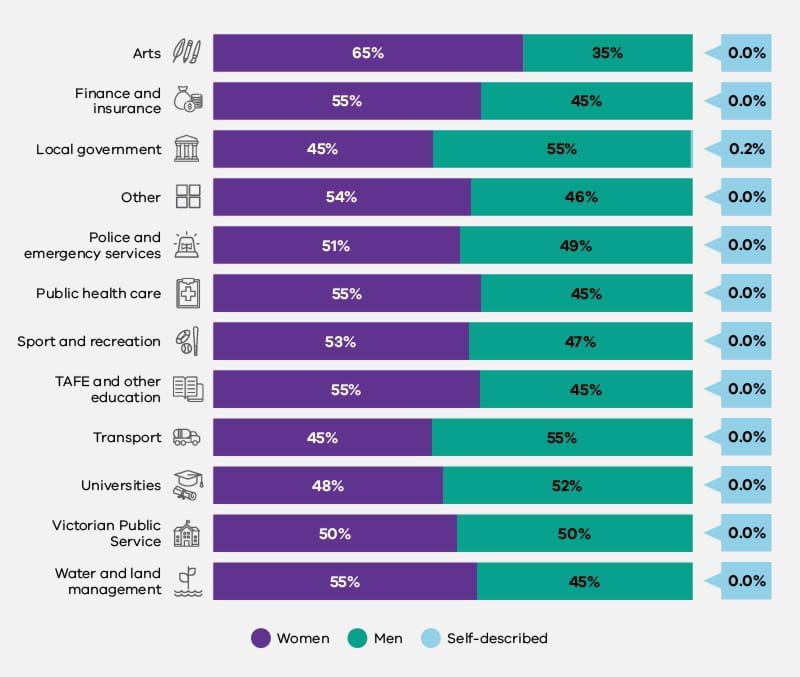
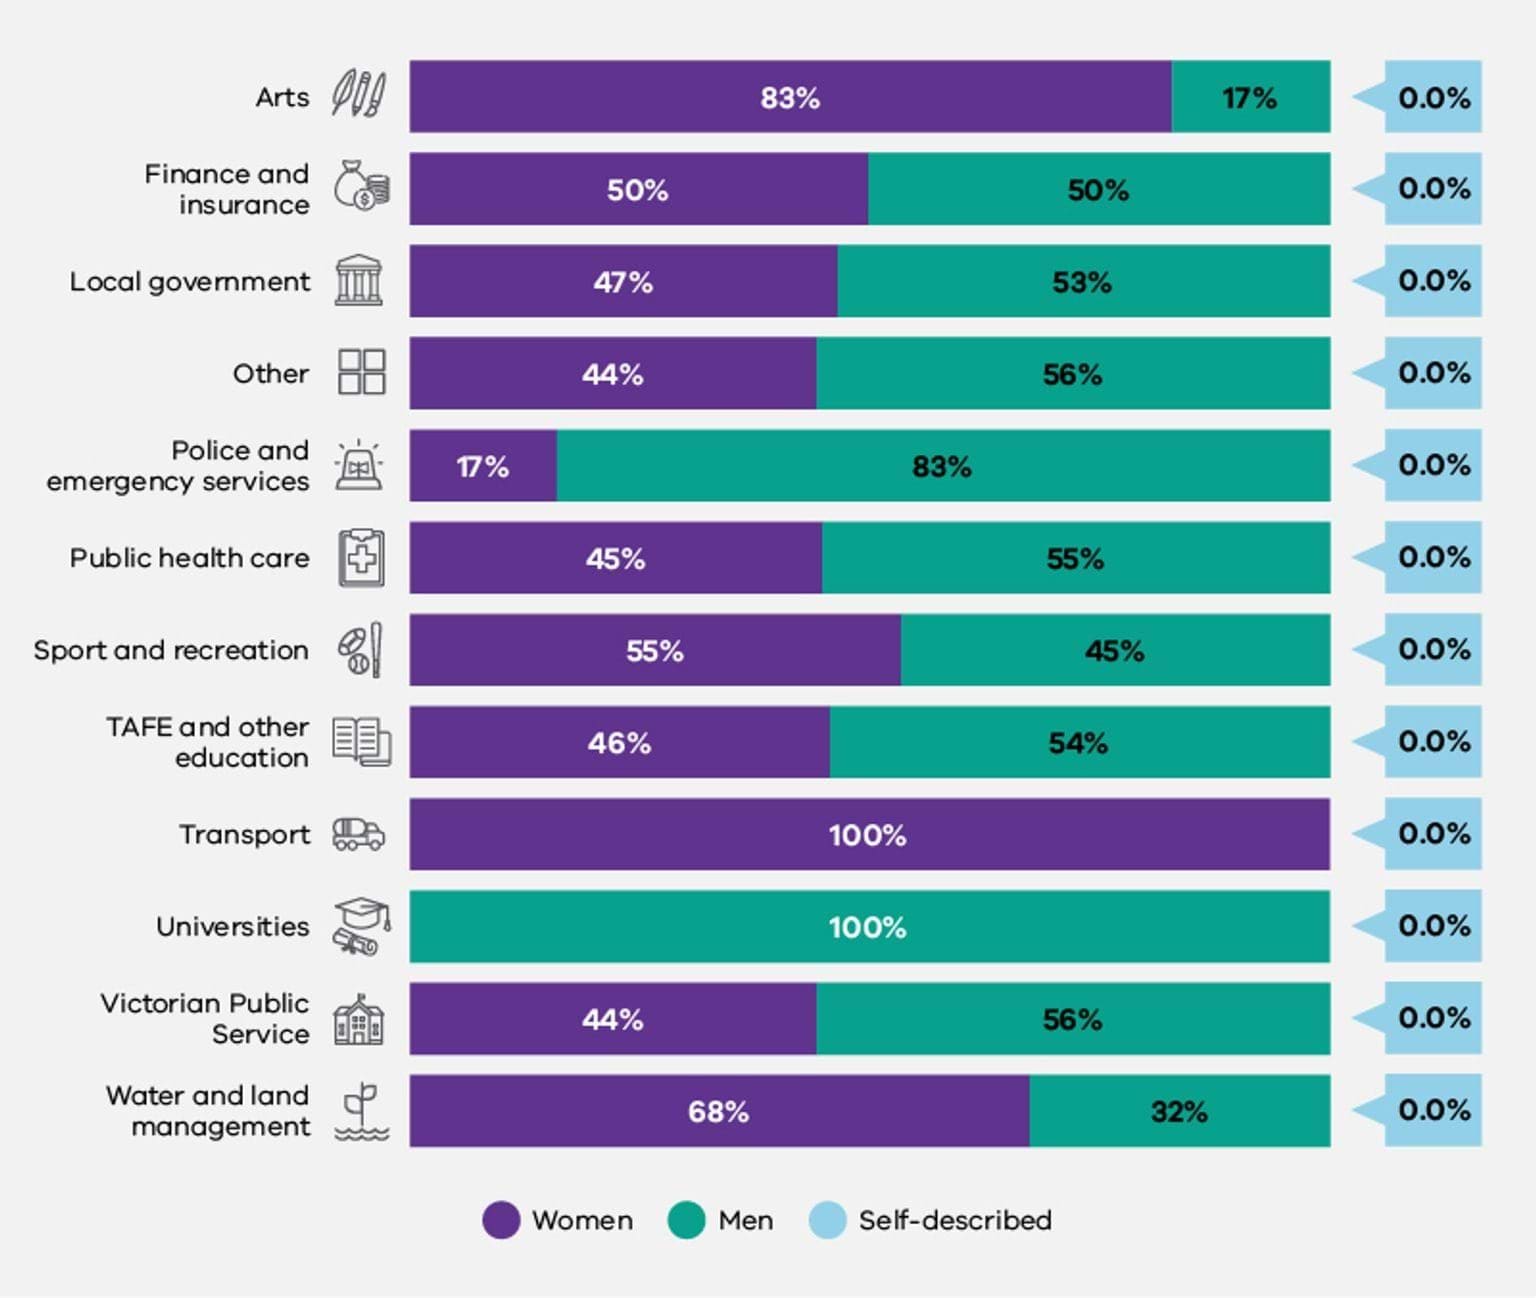
As can be seen in Figure 1.1, women outnumbered men in 8 of the 12 industry groups, including the Arts, Universities, TAFE and Other Education, Local Government and Finance and Insurance industry groups. The Public Health Care industry group had the highest proportion of women (78%), followed by the Victorian Public Service (70%). In contrast, the Transport industry group had the highest proportion of men (75%), followed by Police and Emergency Services (64%). Note that there are slight differences in how the Commission for Gender Equality in the Public Sector and the Victorian Public Sector Commission define industries within the public sector. As the workplace gender audit required defined entities to submit their data at an organisational level, different types of workforces within a single organisation are included within the same industry grouping. For example, in this Baseline report, all schools and school staff (including cleaners, teachers, administrative clerks and others) are classified as belonging to the Victorian Public Service industry, as they are employed by the Department of Education and Training. However, the VPSC splits these workforces into different industry groups as relevant.
These findings are consistent with others across the world25 where women are estimated to make up 70% of the global health sector workforce26 and over 75% of workers in the health and social care sector in most OECD countries27 but represent only 18.6% of the transport sector across the European Union,28 18% in Sweden,29 and 23% in Canada.30
Fig 1.1. Public sector workforce, by industry and gender
Gender composition by employment type
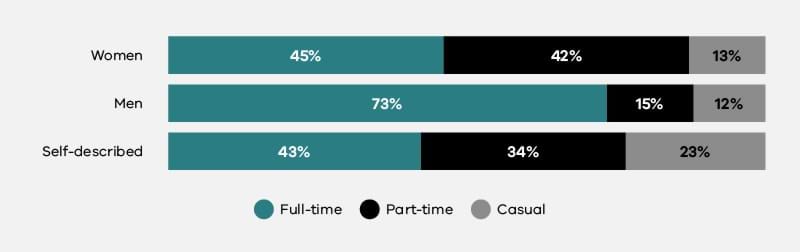
Women and individuals of self-described gender were more than twice as likely to work in part-time roles than men – with only 15% of men working in part-time roles, compared to 42% of women and 34% of individuals of self-described gender.
In comparison, 45% of women worked in full-time roles, compared to 73% of men and 43% of people of self-described gender. The imbalance in the proportion of women and men working in full-time roles is similar to that in the private sector in Australia (where 41% of women work on a full-time basis, compared to 67% of men).31 However, the imbalance is significantly greater than in the New South Wales public sector (where 58.1% of women work on a full-time basis, compared to 41.9% of men),32 and in countries such as Canada (where 75.6% of women and 81.8% of men were in full-time roles in 2021)33 and the UK (where 62% of women and 87% of men were working full time as at May 2022).34
Fig 1.2. Employment type by gender

As can be seen in Figure 1.2, while the gender composition of casual employment in defined entities was relatively balanced between women and men (13% and 12% respectively), people of self-described gender were almost twice as likely (23%) to be in casual employment (see boxed section for further information).
Gender composition in leadership roles
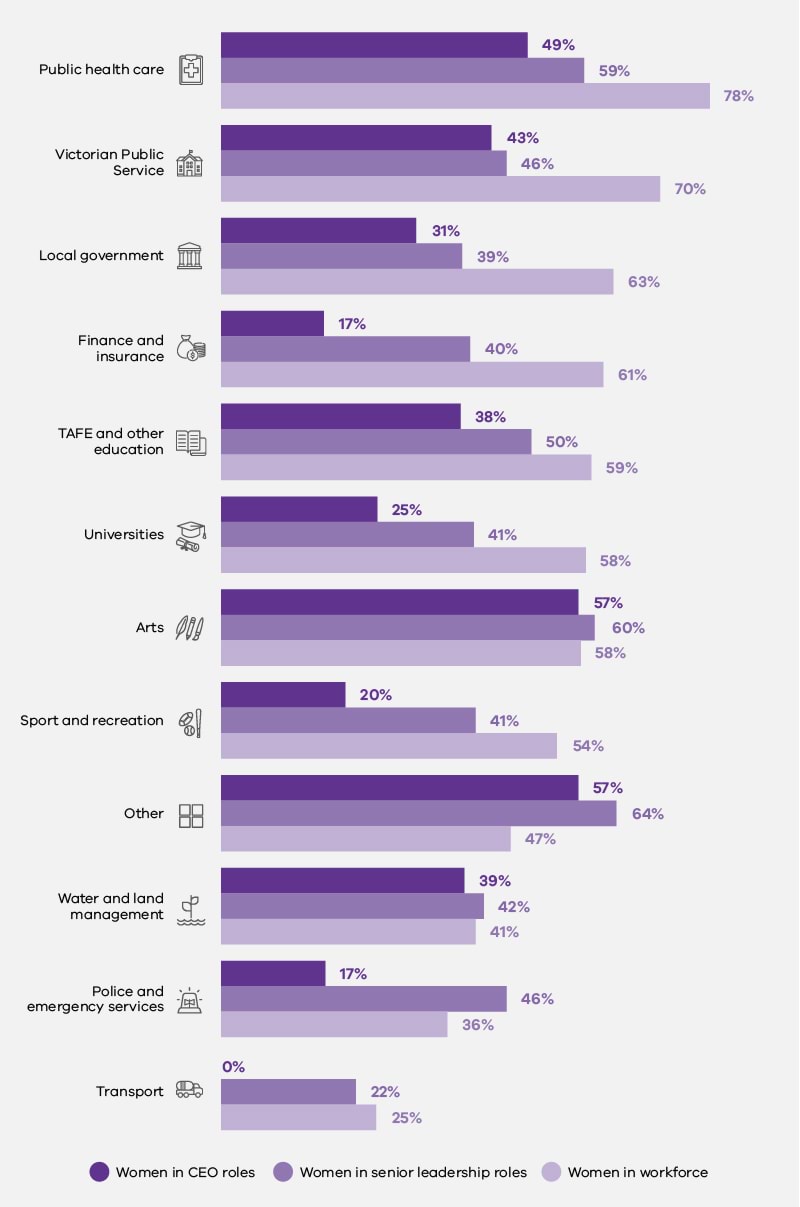
Women were underrepresented in senior leadership positions across defined entities reporting under the Act, with women comprising 66% of the workforce, but only 46% of senior leadership roles.
In 8 of the 12 industry groups identified in Figure 1.3, women were less represented in senior leadership roles than in the underlying workforce.
Across the industry groups, the largest differences in proportions were found in the Victorian Public Service, where women made up 70% of the workforce but only 46% of senior leadership positions, and the Local Government industry group, where women made up 63% of the workforce and only 39% of senior leadership positions (amounting to a 24% difference in each industry group). This is followed by the Finance and Insurance industry group where women made up 61% of the workforce but held only 40% of senior leadership positions and 17% of CEO positions.
This underrepresentation is consistent with imbalances found in the NSW public sector, where women make up over 65% of the public sector workforce, but only 40% of senior executive level roles.37 However, it is more pronounced than in the public service in the UK, where women make up 54.2% of the civil service and 46.7% of the senior civil service.38 Similarly, in New Zealand, women made up 61.8% of the public service workforce as of 30 June 2021 but only 53.5% of the top 3 tiers of senior management.39
Organisations covered by the Act fared only marginally better than the private sector. According to the Workplace Gender Equality Agency, in 2021 women made up over 50% of private sector employees, however they comprised only 32.5% of key management positions and only 19.4% of CEOs.40
This situation is also reflected internationally. For example, a survey of 69 organisations (470,000 employees) in Canada found that while, on average, 45% of all entry-level employees were women, only 39% of Managers, 25% of C-suite employees and 15% of CEOs were women.41
Across defined entities, 61% of CEO-level roles were filled by men, despite men comprising only 34% of the workforce. In contrast, while women comprised 66% of the workforce, they held only 38% of CEO-level roles. As noted above, this is just under double the percentage of female CEOs in the Australian private sector, which is 19.4%.42
When we consider how this operates across particular industry groups in the Commission’s data, men were disproportionately represented in CEO roles in 10 of the 12 (83%) industry groups. Women were most likely to hold CEO positions within the Arts, Other, Public Health Care and Victorian Public Service industry groups, and least likely to hold CEO positions within the Transport, Finance and Insurance, Police and Emergency Services and Sport and Recreation industry groups.
Fig 1.3. Proportion of women in CEO roles, in senior leadership roles and in the workforce, by industry

Gender composition of governing bodies
Boards, councils, committees of management and other governing bodies have a powerful role in strategic, financial and risk oversight and decision-making. Equal governing body representation is therefore critical to ensure decisions made at this level reflect the diversity of the workforce and the community more broadly.
The gender composition of governing bodies across defined entities overall was largely balanced between women and men (with 1,226 women and 1,128 men serving on governing bodies). Only one person of self-described gender was reported to serve on a public sector governing body.
Fig 1.4. Governing body members, by industry and gender
National and international reports suggest that defined entity boards therefore have better representation of women than federal Australian Government boards (where, as of 30 June 2021, women held 49.6% of positions across all Australian Government board appointments and 39.1% of chair and deputy chair positions).43 Similarly, the board of organisations covered under the Act also fared better than the boards of private sector organisations across Australia more broadly (where women hold only 29.9% of board seats and 11.7% of board chair positions) as well as in Canada (where the average percentage of women on boards is 30% and in chair positions is 9%) and the European Union (where 30.7% of board seats are held by women and only 10% of board chairs are women).44
Victorian Government targets in place since 2015 requiring 50% of new government board appointments to be women have clearly been successful in generating greater gender balance in public boards in Victoria.45
Fig 1.5. Governing body chairs, by industry and gender
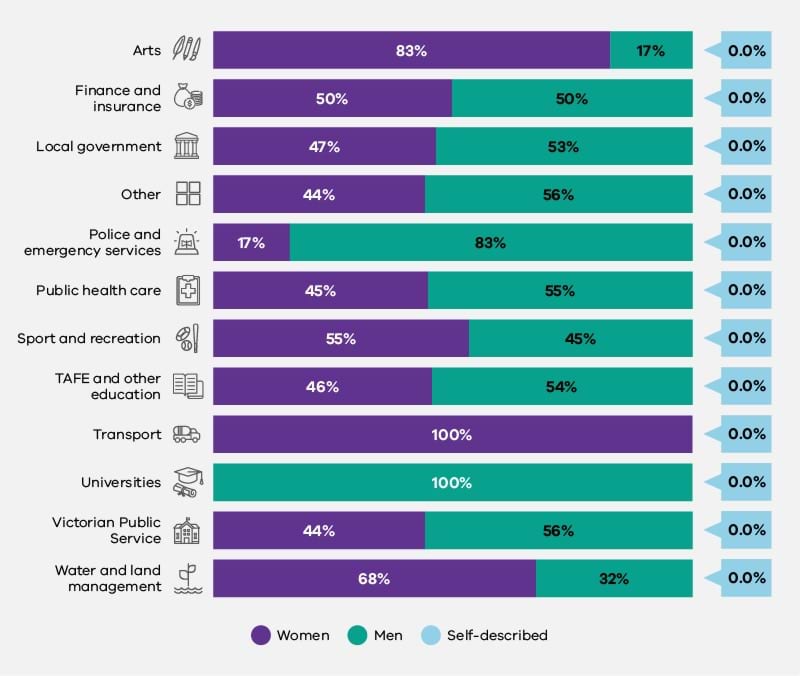
While there was a reasonable balance between the total number of women (128) and men (140) serving as governing body chairs across the data as a whole, this balance was not maintained at the industry group level (Figure 1.5). All University governing body chair positions were occupied by men, while all Transport industry governing body chair positions were held by women. The data also shows a significant gender imbalance in the Arts industry group, in which women occupied 83% of chair positions, and in the Police and Emergency Services industry group, in which they held only 17% of chair positions.
Occupational gender imbalances
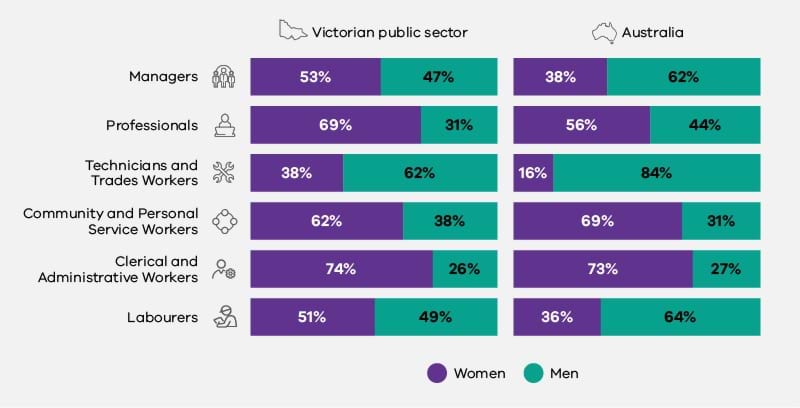
The 2021 workplace gender audit data shows the occupational gender imbalances present in defined entities compared to those in the broader Australian workforce. Defined entities were closer to gender balance than the broader Australian workforce in 4 of 6 occupation groups, and further away from gender balance in 2 of the occupation groups.
Fig 1.6. Victorian public sector and Australian workforces, by occupation and gender

Across both 2021 workplace gender audit data and national data, women held almost three-quarters of Clerical and Administrative roles and over half of Professional roles. Men held the majority of Technician and Trade positions in both datasets (62% within defined entities and 84% within the Australian workforce). These findings are also reflected internationally. For example, in Canada women are most concentrated in occupations in health (79.6%), education, law, and social, community and government services (68.9%), whereas men occupy 93% of trades and transport and equipment operation occupations and 73.5% of occupations in manufacturing and utilities.46 Similarly, men in the UK have the highest employment share in skilled trade occupations (92%), while women are most concentrated in ‘caring, leisure and other service’ occupations (75.6%), and administrative and secretarial occupations (67.7%).47
Reports of workplace discrimination
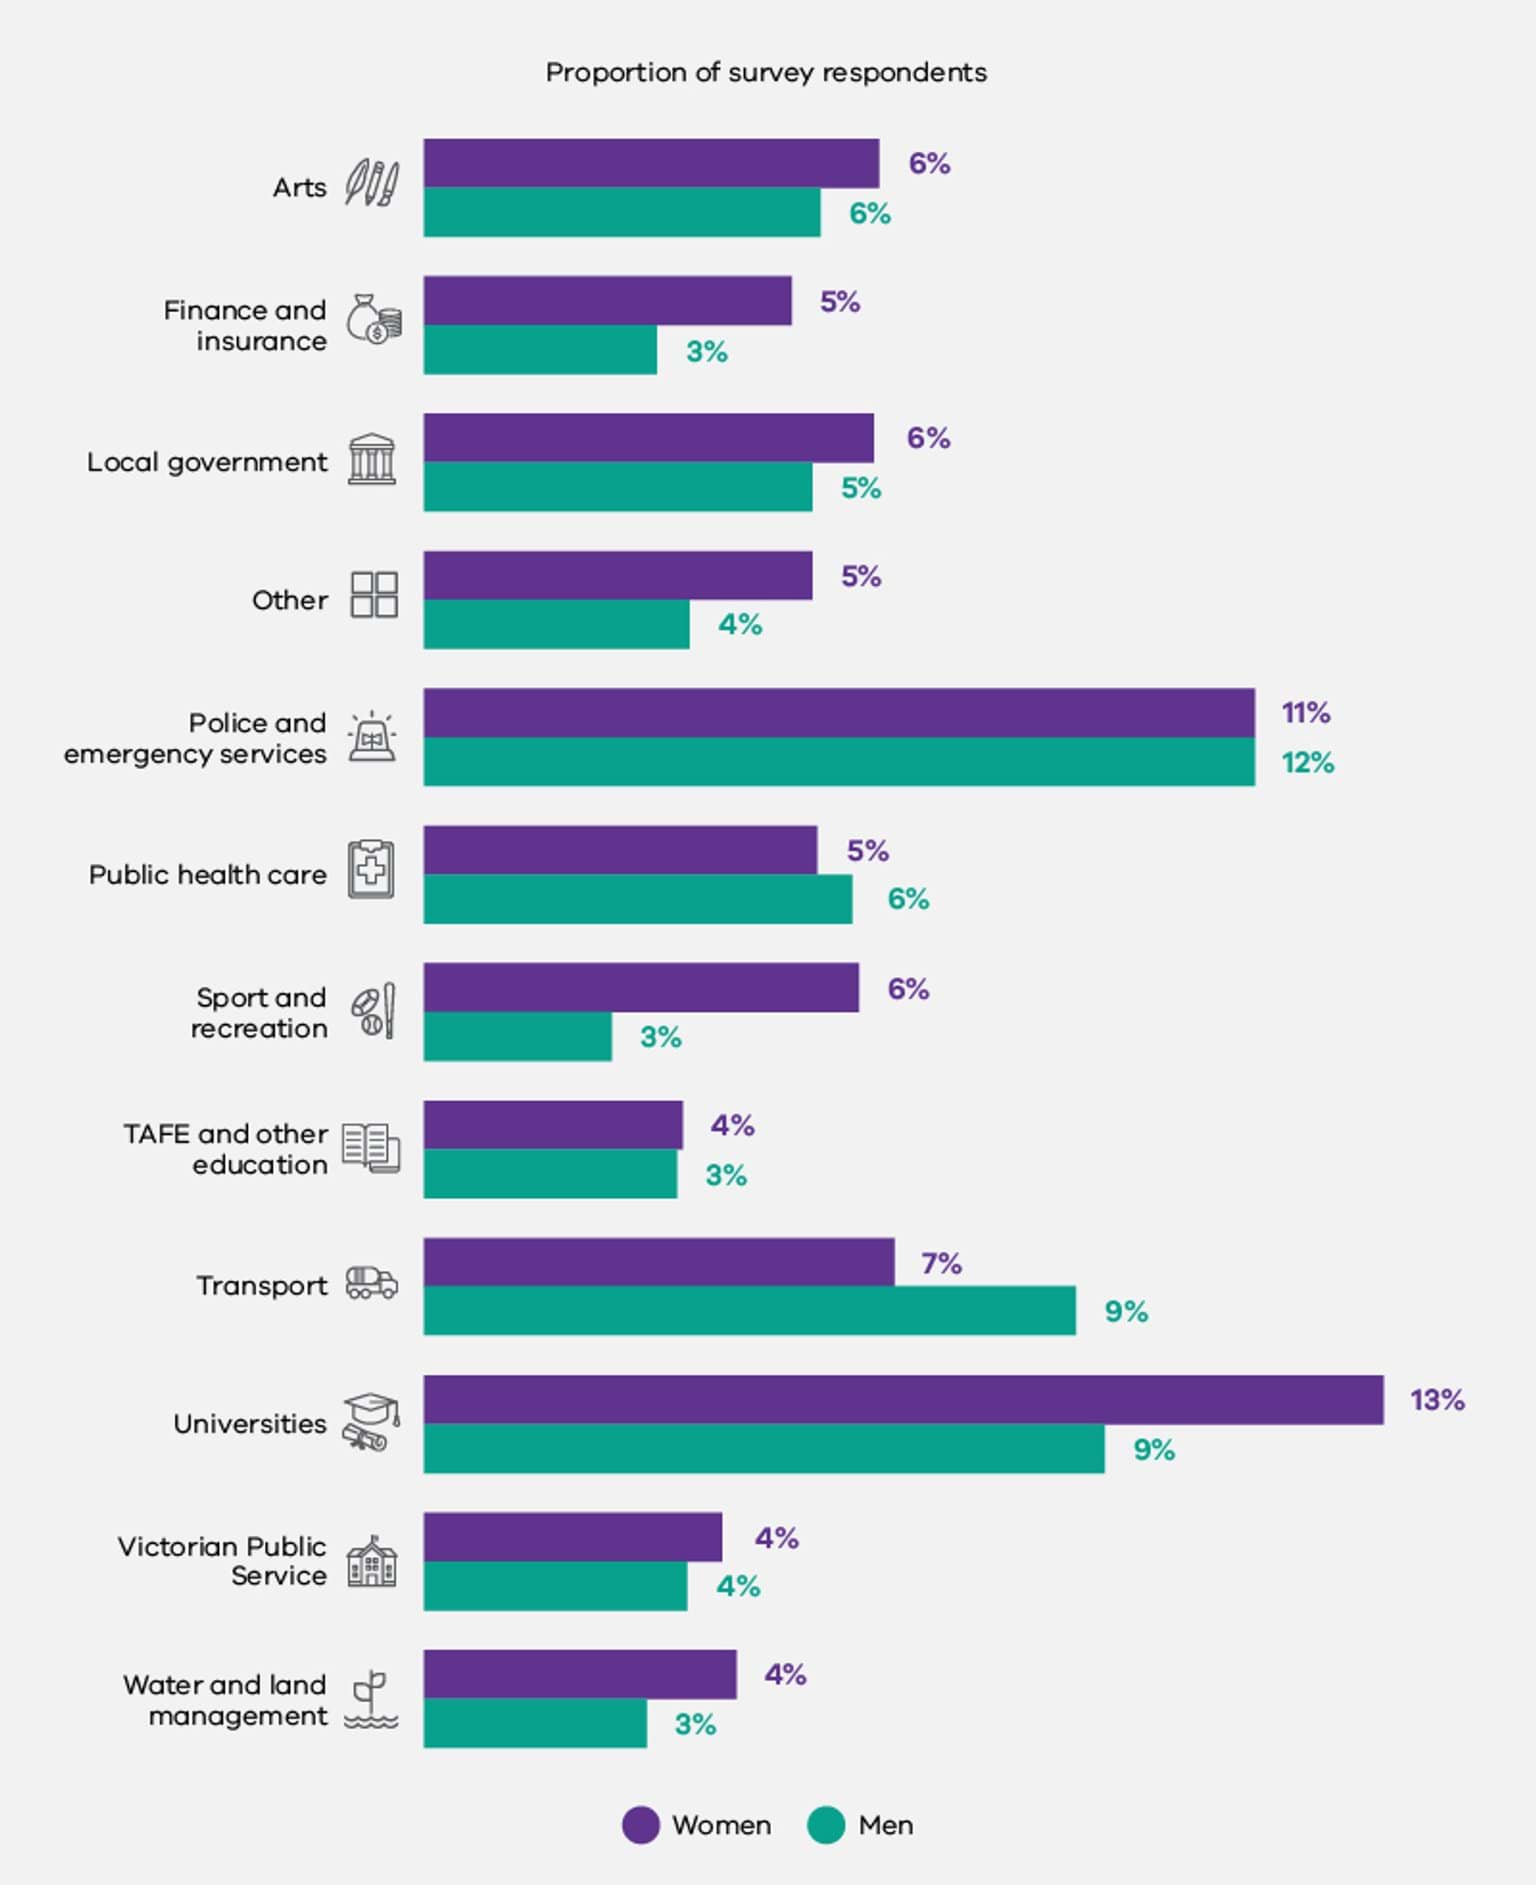
Among survey respondents, women and men reported experiencing workplace discrimination48 at similar rates (Figure 1.7, below). About 6% of men and women said they had experienced discrimination at work in the previous 12 months.
Reports of discrimination were most common for women working in the University industry group (13%) and for men working in the Police and Emergency Services industry group (12%).
Fig 1.7. Proportion of survey respondents who reported experiencing discrimination, by industry and gender
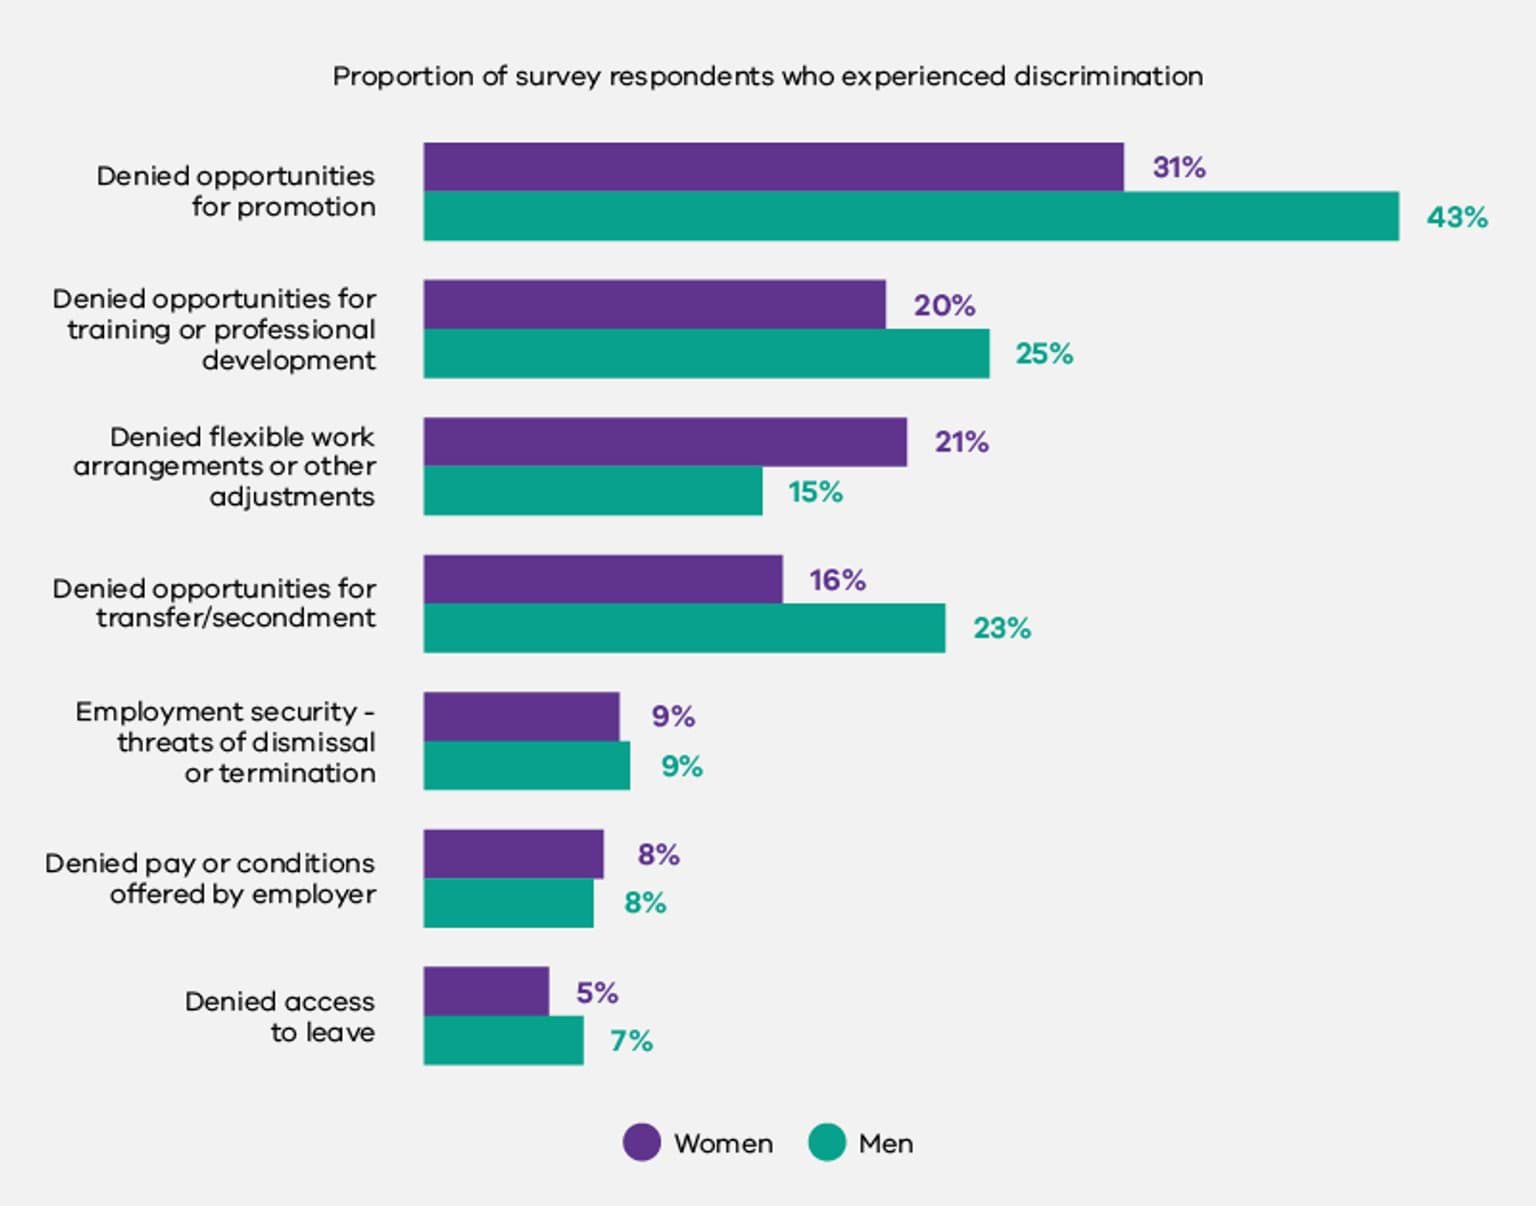
As can be seen in Figure 1.8 below, for both women and men, the most common type of discrimination reported was being denied opportunities for promotion.49 This was reported by nearly half of those men who said they had experienced discrimination compared to less than one-third of women.
The only form of reported discrimination that was more common for women than for men was being denied flexible work arrangements or other adjustments. This affected 21% of women who said they had experienced discrimination and 15% of men.
Fig 1.8. Types of discrimination reported by survey participants, by gender
Discussion
Increasing the representation of women and gender diverse people in traditionally majority-men industries and occupations – including leadership roles, as well as increasing the representation of men in traditionally majority-women occupations and industries, can lead to a range of positive outcomes. This may include a decrease in organisational and industry-specific pay gaps, improved organisational performance and workplace productivity, as well as increased safety.50
The Commission’s data revealed an imbalance in the proportion of women and men working in full-time roles (with 42% of women working part time, compared to 15% of men). This imbalance is greater than in countries such as Canada and the UK.
It is important to acknowledge the possible connection between the availability and accessibility of flexible working arrangements (or lack thereof) in Australian workplaces and the higher proportion of women working on a part-time basis.51 It has been hypothesised that an overrepresentation of women in part-time work may ‘reflect the fact that a lack of flexibility often drives women out of the full-time workforce, either into part-time or casual roles, or away from the workforce altogether’.52 This explanation is reinforced by the significant amount of support offered to workers in Canada and the UK to work flexibly, and the comparatively high proportion of women working on a full-time basis in these countries. It is also supported by a study of leading practice organisations in gender equality strategy, policy, and implementation in Australia.53
While the Commission’s data identified several industry groups with strong women’s workforce representation, these industries did not demonstrate a proportionate number of women in management positions. For example, women comprised 61% of the workforce in the Finance and Insurance industry group, yet only 40% of senior management positions and 17% of CEO positions. Similar findings in the private sector have been linked to a ‘Glass Elevator’ effect experienced by some men in majority-women industries – which propels them into leadership positions at a quicker pace than their colleagues who are women.54
Interestingly, the data shows that while women comprised only 36% of the Police and Emergency Services industry group, they held 46% of senior leadership positions. Similarly, while women comprised only 25% of the Transport industry group, they held 22% of senior leadership positions. Given women’s overall underrepresentation in these industry groups, this may suggest that some majority-men industry groups are successfully engaging in deliberate strategies to increase women in leadership (although this has not yet flowed through to CEO positions in these industries).
Research has found that having women in CEO positions can create a ‘trickle-down effect’ (whereby increasing the number of women at the top of an organisation increases women’s representation in the level immediately below).55 Certainly, in this dataset, the industry groups with the highest proportion of women CEOs also have the highest proportion of women in senior leadership positions. For example, the Arts and ‘Other’ industry groupings have the highest proportion of women CEOs (with 57% of CEO positions held by women) and the two highest proportions of women in senior leadership positions (60% and 64% respectively). Trend analyses within the Commission’s dataset over coming years will allow investigation into whether this ‘trickle-down’ effect of increasing women in leadership can be identified.
Data from the first workplace gender audit under the Act shows that defined entities achieved greater gender balance on their governing bodies than both private boards and government-appointed boards Australia-wide. This success can, at least in part, be attributed to Victorian Government targets for government board appointments. In place since 2015, these targets require 50% of new government board appointments to be women.56 The success of this gender target framework in Victoria reflects existing research demonstrating that targets and quotas for women in leadership are effective in accelerating women’s representation at the top of organisations.57
Forms of workplace discrimination can contribute to gender inequality in workforce composition, occupational distribution, and organisational leadership.58 For example, denial of career development opportunities as a result of discrimination on the basis of gender or other attributes can contribute to a lack of diverse leaders in an organisation.
Discrimination may be a contributing factor to imbalances in workforce gender distribution across different levels among defined entities. Notably, industry groups with majority-women workforces do not demonstrate commensurate numbers of women in leadership roles. Discriminatory views or practices within organisations may be implicated in this failure to translate strong women’s representation into strong women’s leadership.
Forms of discrimination can be both direct and indirect, and may relate to gendered expectations, such as rewarding presenteeism and overwork.59 However, it must be noted that a lack of women’s leadership in these industries is likely due to a constellation of factors, including issues related to career development practices, caring responsibilities, leave and flexible work, which are covered in subsequent chapters of this report.
Reports of discrimination within employee survey data can also be shaped by resistance to gender equality, or perceptions of ‘reverse discrimination’. It is notable that the majority of men who reported experiencing discrimination in the survey data from defined entities indicated that they had been denied opportunities for promotion. This may reflect existing data and research on resistance to proactive strategies to increase the representation of women, particularly in majority-men organisations and industries, where men interpret these strategies as a form of gender-based discrimination against them.
The recent review undertaken by the Victorian Equal Opportunity and Human Rights Commission (VEOHRC) into sex discrimination and sexual harassment in Victoria Police showed evidence of this. VEOHRC’s report noted the existence of ‘widespread perceptions among some male employees and a small number of female employees of “reverse discrimination”’, while finding no evidence of actual systemic discrimination against men.60 That survey respondents who were men identified promotion as a key arena where they experienced discrimination could potentially reflect resistance to moves towards greater gender equality in promotion practices.
Recommendations
Regular collection, analysis and reporting of accurate trend data on workforce composition across all levels of an organisational hierarchy (including on boards and decision-making committees), in all occupations and across employment types (full time, part time and casual), and across all business units, divisions and geographical locations, is essential to addressing inequalities in workforce composition and gendered segregation in organisations. Collecting analysing and reporting this data will allow defined entities to understand whether strategies to improve gender equality included in their Gender Equality Action Plans (GEAPs) are working, and if not, where attention may need to be focussed.
The Act requires that defined entities have regard to the disadvantage or discrimination that a person may experience on the basis of Aboriginality, age, disability, ethnicity, gender identity, race, religion and sexual orientation, in addition to gender inequality. In order to do this, organisations need to break down or ’disaggregate’ their workforce data in an intersectional way.
In collecting, analysing and reporting on this data, organisations need to be sensitive to employee safety and privacy considerations and allow employees the discretion to self-identify.61
If an organisation does not currently have access to intersectional data, it is important to plan for how to collect this in future, including how to ensure employees with different attributes feel safe to disclose personal information. Engaging with your workforce – and ensuring diverse participation in this engagement – can help build a culture of safety.62
A review of existing data gaps will help your organisation to plan next steps. You can access further advice on the Commission’s website.63 Further information and recommendations will also be provided in the companion baseline report on intersectional data when this is published in the first trimester of 2023.
Inequalities in the composition of your workforce, the distribution of occupations, or the composition of your organisational leaders can be influenced by various forms of workplace discrimination. This can include bullying and other negative behaviours, the denial of career development opportunities, a lack of support for flexibility or a denial of professional development due to part-time work, a lack of support for carers and parents, or a lack of employment stability. Where people with certain attributes are more likely to experience workplace discrimination, this can contribute to skewed distributions across levels, occupations, or leadership groups in your organisation.
It is therefore important to collect and analyse data regarding workplace discrimination, in order to identify concerning trends and address inequalities.64 For defined entities, the employee experience survey data component of your workplace gender audit can assist in identifying which cohorts within your organisation are likely to report the experience of discrimination, and in what form.
In addition, centralising the reporting of discrimination incidents, as well as ensuring multiple safe channels for reporting (including one to leadership) can assist in identifying and tracking discrimination. You may also consider other avenues to collect qualitative data about employees’ experiences of discrimination, particularly for those from marginalised communities.65 Engaging with your staff, as well as relevant staff networks and experts from different communities can also assist you to approach this sensitively.
References
- Australian Bureau of Statistics (ABS) (July 2022), ’Table 5: Labour force status by Sex, Victoria - Trend, Seasonally adjusted and Original’, Labour Force, Australia, accessed 22 July 2022.
- ABS, ‘Labour force status by Sex’.
- Victorian Public Sector Commission (VPSC), Employee demographics and diversity, VPSC, accessed 21 July 2022.
- World Economic Forum (WE Forum), Global Gender Gap Report 2021, WE Forum, 2021.
- WE Forum, Global Gender Gap Report 2021, accessed 22 July 2022.
- J Cermak et al., Women in Leadership: Lessons from Australian companies leading the way, McKinsey & Company, 2017, accessed 22 July 2022; KPMG, She’s Price(d)less: The economics of the gender pay gap, KPMG, 2022, accessed 22 July 2022. J Cermak et al., Women in Leadership: Lessons from Australian companies leading the way, McKinsey & Company, 2017, accessed 22 July 2022; KPMG, She’s Price(d)less: The economics of the gender pay gap, KPMG, 2022, accessed 22 July 2022.
- Workplace Gender Equality Agency (WGEA), Men twice as likely to be highly paid than women, WGEA, accessed 21 July 2022; WGEA, The Gender Pay Gap, accessed 21 July 2022; R Cooper and E Hill, Research-informed principles for a gender equitable recovery from the Covid-19 pandemic, University of Sydney, 2022, doi:10.25910/x3wh-pf20; N Cortis and G Meagher, ‘Recognition at Last: Care Work and the Equal Remuneration Case’, Journal of Industrial Relations, 2012, 54(3): 377-385, doi:10.1177/0022185612442278.
- ABS (June 2022), Labour Force, Australia, accessed 22 July 2022.
- WGEA, Gender segregation in Australia’s workforce, WGEA, accessed 21 July 2022. In fact, industrial segregation as a driver of the gender wage gap has grown by 11% since 2017 to contribute to 20 per cent of the gender wage gap in 2020 (KPMG, She’s Price(d)less, p 58.).
- Parliament of Australia, Gender segregation in the workplace and its impact on women’s economic equality, Australian Government, Finance and Public Administration References Committee, 2017, accessed 22 July 2022.
- Harmony Alliance, A Strategic Approach to Improving Employment Outcomes of Women from Migrant and Refugee Backgrounds in Australia [PDF 211KB], Harmony Alliance, 2019, accessed 22 July 2022.
- Harmony Alliance, Improving Employment Outcomes.
- Evans, Gari Yala (Speak the Truth): gendered insights, Jumbunna Institute of Education and Research and Diversity Council Australia, 2021, accessed 22 July 2022.
- C Frohmader, WWDA Response to Employment Issues Paper, Women with Disabilities Australia, 2020, pp 27-28, accessed 22 July 2022.
- S Waite, ‘Should I Stay or Should I Go? Employment Discrimination and Workplace Harassment against Transgender and other Minority Employees in Canada’s Federal Public Service’, Journal of Homosexuality, 2021, 68(11):1833-1859, doi:10.1080/00918369.2020.1712140; KK Dray et al., ‘Moving beyond the gender binary: Examining workplace perceptions of nonbinary and transgender employees’, Gender, Work & Organisation, November 2020, 27(6):1181-1191, doi:10.1111/gwao.12455; S Davidson, ‘Gender inequality: Nonbinary transgender people in the workplace’, Cogent Social Sciences, 2016, 2(1), doi:10.1080/23311886.2016.1236511.
- For the first time under Australian gender equality reporting legislation, organisations covered by the Act were required to provide data disaggregated not only by gender, but across a range of attributes. As outlined in the Introduction, the Commission will publish insights from this intersectional data in a companion report on intersectionality, to be released in 2023.
- This includes employees identifying as non-binary, agender and bigender. As many organisations are yet to collect meaningful data on gender diversity, we do not know the true gender composition of the public sector workforce, however we expect the real proportion of gender-diverse individuals to be higher than 0.1 per cent. This is based on recent international research that has found that over 50% of transgender and non-binary people hide their identity at work (D Baboolall and S Greenberg, ‘Being transgender at work’, McKinsey Quarterly, 10 November 2021, McKinsey & Company, accessed 22 July 2022; Kantar, DIVA, and Stonewall, The Diva Survey - LGBT+ Women and Non-Binary People’s Insight 2021, 2021, accessed 22 July 2022.
- S Sansonetti and E Davern, Women and Transport (European Parliament: Policy Department for Citizens’ Rights and Constitutional Affairs, 2021), 38-40, accessed 22 July 2022; Transport Canada, Minister Garneau highlights the roles women play in Canada’s transportation system: Transcript, accessed 22 July 2022.
- Partnership for Maternal, Newborn & Child Health (PMNCH), Women in Global Health, PMNCH, accessed 22 July 2022.
- OECD, Health at a Glance 2021: OECD Indicators OECD, p 8, accessed 22 July 2022.
- Sansonetti and Davern, Women and Transport, pp 38-40.
- Sansonetti and Davern, Women and Transport, pp 38-40.
- Transport Canada, Minister Garneau highlights the roles women play.
- WGEA, Australia’s gender equality scorecard: Key results from the Workplace Gender Equality Agency’s 2020-21 employer census, February 2022, p 5, accessed 22 July 2022.
- NSW Public Service Commission, Workforce Profile Report 2020, Chapter 6: Gender, accessed 25 July 2022.
- Statistics Canada, Sex, Gender and Sexual Orientation, accessed 22 July 2022.
- Office for National Statistics, EMP01: Full-time, part-time and temporary workers (seasonally adjusted [dataset, 19 July 2022], United Kingdom, accessed 25 July 2022.
- T Jones, ‘Female-to-Male (FtM) transgender employees in Australia’ in T Köllen (ed) Sexual orientation and transgender issues in organizations: global perspectives on LGBT workforce diversity, Springer, Switzerland, 2016, pp 101-116, doi:10.1007/978-3-319-29623-4_6.
- G Hunt and M Pelz, ‘Transgender Rights in Canada: Legal, Medical and Labour Union Activities’ in T Köllen (ed), Sexual orientation and transgender issues in organizations: global perspectives on LGBT workforce diversity, Springer, Switzerland, 2016, pp 133-147, doi:10.1007/978-3-319-29623-4_8.
- NSW Public Service Commission, Workforce Profile Report 2021, Chapter 6: Gender, pp 36-44.
- UK Cabinet Office, Statistical Bulletin: Civil Services Statistics: 2021, accessed 22 July 2022.
- Te Kawa Mataaho Public Service Commission, Gender representation in the Public Service, New Zealand, accessed 22 July 2022.
- WGEA, Women in Leadership, accessed 22 July 2022.
- S Devillard et al., The Power of Parity: Advancing Women’s Equality in Canada, McKinsey Global Institute, McKinsey & Company Canada, 2017, p 54, accessed 22 July 2022.
- WGEA, Women in Leadership.
- Department of the Prime Minister and Cabinet, Gender Balance on Australian Government Boards: Report 2020-21, Australian Government, 2021, accessed 22 July 2022.
- Deloitte, Progress at a snail’s pace: Women in the Boardroom, Seventh Edition, accessed 22 July 2022.
- Note that the Women on Boards commitment applies to Victorian courts and all boards, except for statutory offices or officers, small Crown land committees of management, unpaid cemetery trusts, and school councils. It also does not apply to universities. The Victorian Government also has a target of having at least 50 per cent women councillors and mayors in local government by 2025 (Victorian Government, Women on Boards Commitment, accessed 25 July 2022; Local Government Victoria, Women Leading Locally, Victorian Government, accessed 25 July 2022..
- Statistics Canada, Proportion of women and men employed in occupations, annual [dataset, 7 January 2022], accessed 22 July 2022.
- Office for National Statistics, Understanding the gender pay gap in the UK, United Kingdom, 2018, accessed 22 July 2022.
- This includes discrimination on the basis of any of the following attributes: Age, disability, employment activity, gender identity, industrial and/or political activity, marital status, parent or carer status (including pregnancy and breastfeeding), physical features, race, religious belief or activity, sex, sexual orientation (including expunged homosexual conviction), or lawful sexual activity, personal association with someone who has any of the above attributes (whether as a relative or otherwise).
- This includes discrimination on the basis of any of the following attributes: Age, disability, employment activity, gender identity, industrial and/or political activity, marital status, parent or carer status (including pregnancy and breastfeeding), physical features, race, religious belief or activity, sex, sexual orientation (including expunged homosexual conviction), or lawful sexual activity, personal association with someone who has any of the above attributes (whether as a relative or otherwise).
- Cermak et al., Women in Leadership; R Cassells and A Duncan, Gender Equity Insights 2021: Making it a priority, Bankwest Curtin Economic Centre and WGEA Gender Equity Insights Issue 6 , 2021, accessed 22 July 2022; Australian Human Rights Commission (AHRC), Respect@Work: National Inquiry into Sexual Harassment in Australian Workplaces, AHRC, 2020, p 20, accessed 22 July 2022.
- For further discussion of flexible working arrangements and gender equality, see Chapter 5 of this report, ‘Leave and flexible work’.
- T Fitzsimmons et al., Employer of Choice for Gender Equality: Leading practices in strategy, policy and implementation, AIBE Centre for Gender Equality in the Workplace, 2020, p 18, accessed 22 July 2022.
- Fitzsimmons et al., Employer of Choice for Gender Equality.
- D Jones, ‘Gender and power: Male and female teachers’ interactions in early years contexts’, Perspectives in Education, 2006, 24(1): 27-37, as later applied in Fitzsimmons et al., Employer of Choice, p 17.
- JA Gould et al., ‘Gender diversity from the top: the trickle-down effect in the Australian public sector’, Asia Pacific Journal of Human Resources, January 2018, 56(1):6-30, doi: 10.1111/1744-7941.12158.
- Victorian Government, Women on Boards Commitment, accessed 25 July 2022; Local Government Victoria, Women Leading Locally, Victorian Government, accessed 25 July 2022.
- V Sojo et al., ‘Reporting requirements, targets, and quotas for women in leadership’, The Leadership Quarterly, 2016, 27(3): 519-536. doi:10.1016/j.leaqua.2015.12.003.
- C Ammerman and B Groysberg, ‘How to close the gender gap: You have to be systemic’, Harvard Business Review, May-June 2021; DR Eikhof, ‘A double‐edged sword: twenty‐first century workplace trends and gender equality, Gender in Management: An International Journal, 27(1):7-22, doi:10.1108/17542411211199246; L Jones, Women’s progression in the workplace, Global Institute for Women’s Leadership & Government Equalities Office, UK, October 2019, accessed 25 July 2022.
- Jones, Women’s progression in the workplace.
- Victorian Equal Opportunity and Human Rights Commission (VEOHRC), Independent Review into sex discrimination and sexual harassment, including predatory behaviour, in Victoria Police: Phase 3 audit and review – Aug 2019, VEOHRC, accessed 27 July 2022.
- Commission for Gender Equality in the Public Sector (CGEPS), How do I maintain my employees’ privacy?, CGEPS, 2021, accessed 26 July 2022.
- Fitzsimmons et al., Employer of Choice for Gender Equality: Leading practices in strategy, policy and implementation
- CGEPS, Applying intersectionality: Workplace gender auditing and analysis, CGEPS, 2022, accessed 26 July 2022.
- Fitzsimmons et al., Employer of Choice for Gender Equality.
- Fitzsimmons et al., Employer of Choice for Gender Equality.
Equal pay
This chapter looks at data for the gender equality indicator ‘equal remuneration for work of equal or comparable value across all levels of the workforce, irrespective of gender’.
Introduction
Established internationally as a measure of women’s position within the paid economy compared to men’s, a gender pay gap is the difference between the average earnings of women and men who are in the paid workforce.66 Historically, gender pay gap data has only been collected and reported in a binary way, recognising only men and women and excluding gender diverse individuals.
Pay gaps are measured for a country’s workforce as a whole and for particular jurisdictions. They are also measured at an industry, occupational and organisational level, as well as at various levels and employment types within an organisation.
While ‘like-for-like’ gender pay gaps can reflect unlawful unequal pay – that is, when people of different genders are paid differently when performing the same or comparable work – most jurisdiction-wide and organisation-wide gender pay gaps reflect a complex mix of economic and social factors that disadvantage women. These factors include conscious and unconscious discrimination in recruitment and pay decisions, interruptions to women’s careers, higher rates of part-time work for women, the unequal distribution of unpaid caring and domestic work, and gendered industrial and occupational segregation.67
Key issues: Why was this measured?
The gender pay gap in Victoria has risen
In 1972, the principle of ‘equal pay for equal work’ was established in Australia and in 1986 it was first enshrined in federal legislation. Despite this and other efforts to address the drivers of gender pay gaps, persistent gaps remain.
Victoria’s state-wide pay gap has generally been one of the lowest among Australian jurisdictions in recent years. For example, in November 2017, November 2018 and August 2019, Victoria’s gender pay gap was at 12.4%, 9.3% and 9.6% respectively, less than in Queensland (17.9% in 2017, 17.3% in 2018 and 16.6% in 2019), Western Australia (22.5% in 2017, 23.1% in 2018, and 21.8% in 2019) and the Northern Territory (20.6% in 2017, 15.5% in 2018 and 13.4% in 2019).69 However Victoria’s pay gap rose from 11.2% in November 2020 to 14.3% in 2021.70 This means that Victorian men earn $265.80 more per week on average than Victorian women, who earn on average $1,596.60 per week.71 As discussed in more detail below, this gap narrows across organisations covered under the Act.
Gender pay gaps have many contributing factors
As noted above, gender pay gaps contribute to, and are also driven by, many other forms of inequality. In Australia, conscious and unconscious gender discrimination remains the leading driver of gender pay gaps, accounting for 36% of the gap (down from 39% in 2017). This includes the undervaluation of women’s work, and bias in recruitment, promotion, and salary decisions. Career breaks (such as taking time out to have children or for other caring responsibilities) are an important contributor to the pay gap at 20%, as is part-time employment at 11%. Importantly, gender discrimination and stereotyped gender norms also influence other significant factors that drive the gender pay gap, such as industrial and occupational segregation, which together contribute 24%.72
Pay inequity impacts retirement savings
Pay inequity results in reduced earning capacity and economic insecurity for women over their lifetime, as well as reduced employee retention and productivity in the workplace. At the national level, women at the start of their careers experience a pay gap of 6% but as they progress through their careers to top management levels, the pay gap increases to a high of 18%.73
Despite women’s increasing participation in the workforce over generations, there is now a well-documented superannuation gender gap in Australia. Women approaching their retirement years, aged 60-64, have 28% less super than men, depending on how much time a woman has spent out of the workforce to care for children or other dependents.74 This gap is greatest in a woman’s peak earning years of 45-49 (when it reaches 35%) and in the pre-retirement years of 55-59 (when it is at 33%).75 While these gaps are expected to narrow substantially as the superannuation system matures, despite women making higher voluntary contributions,76 they are not likely to close while women continue to have lower workforce participation and earnings than men.77
More information on intersectionality is needed
It is important to acknowledge that, while a growing body of research has explored the relationship between age and pay inequality,78 there is a persistent lack of data on the impact of other intersectional attributes, such as Aboriginality, disability, ethnicity, gender identity, race, religion, and sexual orientation, on gender pay gaps in Australia. Greater understanding of how the intersections between diverse identities impact experiences of employment, economic security and leadership is crucial to a more sophisticated understanding of how to resolve gender pay gaps.79
What we do know is that in Australia, women with disability are less likely to be in paid employment and are paid less than men with disability and women without disability.80 We also know that women from culturally and linguistically diverse backgrounds are over-represented in low paid and insecure work, and that migrant women are 7% less likely to be employed than those born in Australia.81 It is also well established that older women and Aboriginal women are at greater risk of homelessness than older men, due to income inequality.82
How was this indicator measured?
The Act requires defined entities to report on their progress towards achieving equal remuneration for work of equal or comparable value across all levels of the workforce, irrespective of gender. 83 To meet this obligation, the Commission asked organisations to compile a dataset containing each employee's gender, their pay, and their level within the organisation. The level assignment process was left as open-ended as possible, in recognition that a strictly hierarchical approach is a poor fit for many organisations. The Commission asked that organisations assign the same classification to employees with similar seniority, levels of responsibility and reporting lines. From this, the workforce reporting template calculated the gender pay gap for the entire organisation, as well as by-level pay gaps for up to 30 levels defined by each organisation.
As defined entities share more about what makes a by-level classification scheme meaningful, the Commission plans to test new ways to harmonise these classifications across industry groups and, ultimately, the sector as a whole. While challenging to implement well, harmonised reporting is a win-win – organisations gain the ability to benchmark their performance against their peers, and the Commission gains a more robust dataset for future research and analysis.
Achieving gender pay equity within an organisation requires pay data analysis to uncover, understand and address the drivers of pay gaps. There are several ways to measure a pay gap. To improve consistency and comparability across defined entities, the Commission published audit guidance and data specifications in which organisations covered under the Act were asked to provide:
- base salary data on an annualised84 full-time equivalent basis.85 Base salary data includes salary payments, any packaged or salary sacrificed component, annual leave, leave loading, long service leave, workers compensation payments and penalty rates that are part of an employee’s ordinary working hours.
- total remuneration data, which combines base salary plus any additional benefits, such as fixed bonus payments (including performance pay), superannuation, fixed discretionary pay, overtime and penalty rates that are not part of an employee’s ordinary working hours, other allowances (such as first aid, clothing, meal, and study allowances) and other benefits (such as share allocations).
Collecting both sets of data allows for analysis of the impact of the unequal distribution of employment benefits beyond base salary.86
The mean is the ‘average’ value, found by adding all the amounts in a dataset and dividing the total by the number of values in the set.
The median is the ‘middle’ value when a dataset is ordered from least to greatest.
The Commission also calculated both mean and median pay gaps for each gender group. The mean (average) is more sensitive to outliers/extremes in the dataset (a few extremely high or low salaries). The median is the middle value when a dataset is ordered from lowest to highest. It is less sensitive to outliers or extremes in the dataset. The Commission used both the mean and the median so that it could compare workplace gender audit data with the data from other jurisdictions and sectors.
Fig. 2.1 Comparison of key oversight organisations’ gender pay gap calculation methods
| CGEPS data | VPSC data |
WGEA data |
|
|---|---|---|---|
| Which employers are included | Victorian public sector organisations, universities, and local councils – with 50 or more employees | Victorian public sector organisations (no size threshold) | Australian non-public sector organisations (including universities) with 100 or more employees |
| Type of pay data used to calculate published GPG | Full-time equivalent base salary and total remuneration for all employees |
Full-time equivalent base salary for non-executive employees, total remuneration for executive employees |
Full-time equivalent base salary and total remuneration for all employees |
| Type of average used to calculate published GPG | Mean and median | Median | Mean |
| Employees excluded from calculation of published GPG | None |
Casual employees (data is collected but not used in published GPG calculation) |
Remuneration data for CEOs and Heads of Business not required to be included |
It is also important to note that the pay gap results reported below are influenced by gender composition imbalances within an industry. For example, the overall gender pay gap will be higher in industries with a higher proportion of women at lower levels. Further, while pay gaps are calculated on the basis of annualised full-time equivalent remuneration, if fewer part-time roles are available at senior levels, and women are more likely to work on a part-time basis (due to their higher unpaid caring load 87 and because of a lack of workplace flexibility)88 this may contribute to a higher gender pay gap.
What was found: Key data insights
Sector-wide gender pay gaps
As at 30 June 2021, the median gender pay gap across all Victorian organisations covered by the Act was 6.1% (women’s median base salary was $87,200, compared to men’s median base salary of $92,900 - a difference of $5,700). This means that the typical woman working in the organisations covered by the Act would need to work an extra 22 days per year to earn the same base salary as a typical man working in the same organisations.
The overall median gender pay gap in defined entities was lower than that of most Organisation for Economic Co-operation and Development (OECD) nations with gender equality legislation, with a median gender pay gap of 16.1% for Canada, 14.3% for the United Kingdom, 12.9% for Iceland and 7.4% for Sweden. New Zealand however, has a 4.6% pay gap.89 It was also lower than the 9.3% median pay gap for 2021 calculated by the Victorian Public Sector Commission (VPSC).90 Public sector organisations covered by the VPSC differ slightly from defined entities under the Act, most notably because universities and local councils are not included, and because the VPSC includes public sector organisations with fewer than 50 employees. However, the overall pay gap in defined entities was almost triple that of the NSW public sector, where the gap between the median annual base remuneration of men and women was 2.2% ($2,053). It is noted however, that the NSW dataset does not include local councils or universities, so is not directly comparable.91
The gender pay gap widens when we consider total remuneration (which includes additional benefits such as superannuation and bonuses). As at 30 June 2021, the total remuneration gender pay gap across organisations covered by the Act was 8.1%, with women receiving $8,500 less per year in remuneration compared to men.
While there was a 14.3% average gender pay gap in terms of base salary, the average (mean) annualised pay gap in total remuneration was greater – being 15.6% or $19,000. In comparison, the total remuneration gender pay gap for non‑public sector organisations that report to Australia's Workplace Gender Equality Agency was 22.8%, or $25,792 per year.92
As set out in Figure 2.2, of the 243 defined entities that submitted remuneration data that met the Commission’s specifications, 69% had a median base salary pay gap in favour of men and 28% of organisations had a median base salary gender pay gap favouring men by 10% or more.
Only 7% of organisations had a median base salary gap wider than 10% in favour of women. The vast majority of pay gaps in favour of women (20% of all organisations) were between 0 and 10%.
Fig 2.2. Distribution of organisations' median base salary pay gaps

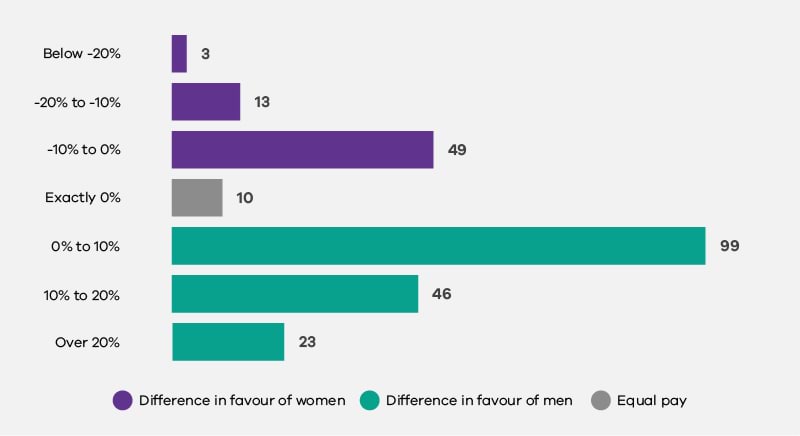
Pay gaps by occupation
As shown in Figures 2.3 and 2.4, below, men were paid more than women within every occupation group, including Professionals and Managers, with median base salary gaps ranging from $5,100 to $16,700. This was the case even in those traditionally majority-women occupations such as Community and Personal Service Workers. The median base salary for women working in the latter occupation was 13.3% lower than for men – a difference of $10,200.
Fig 2.3. Median annualised base salary, by occupation group and gender
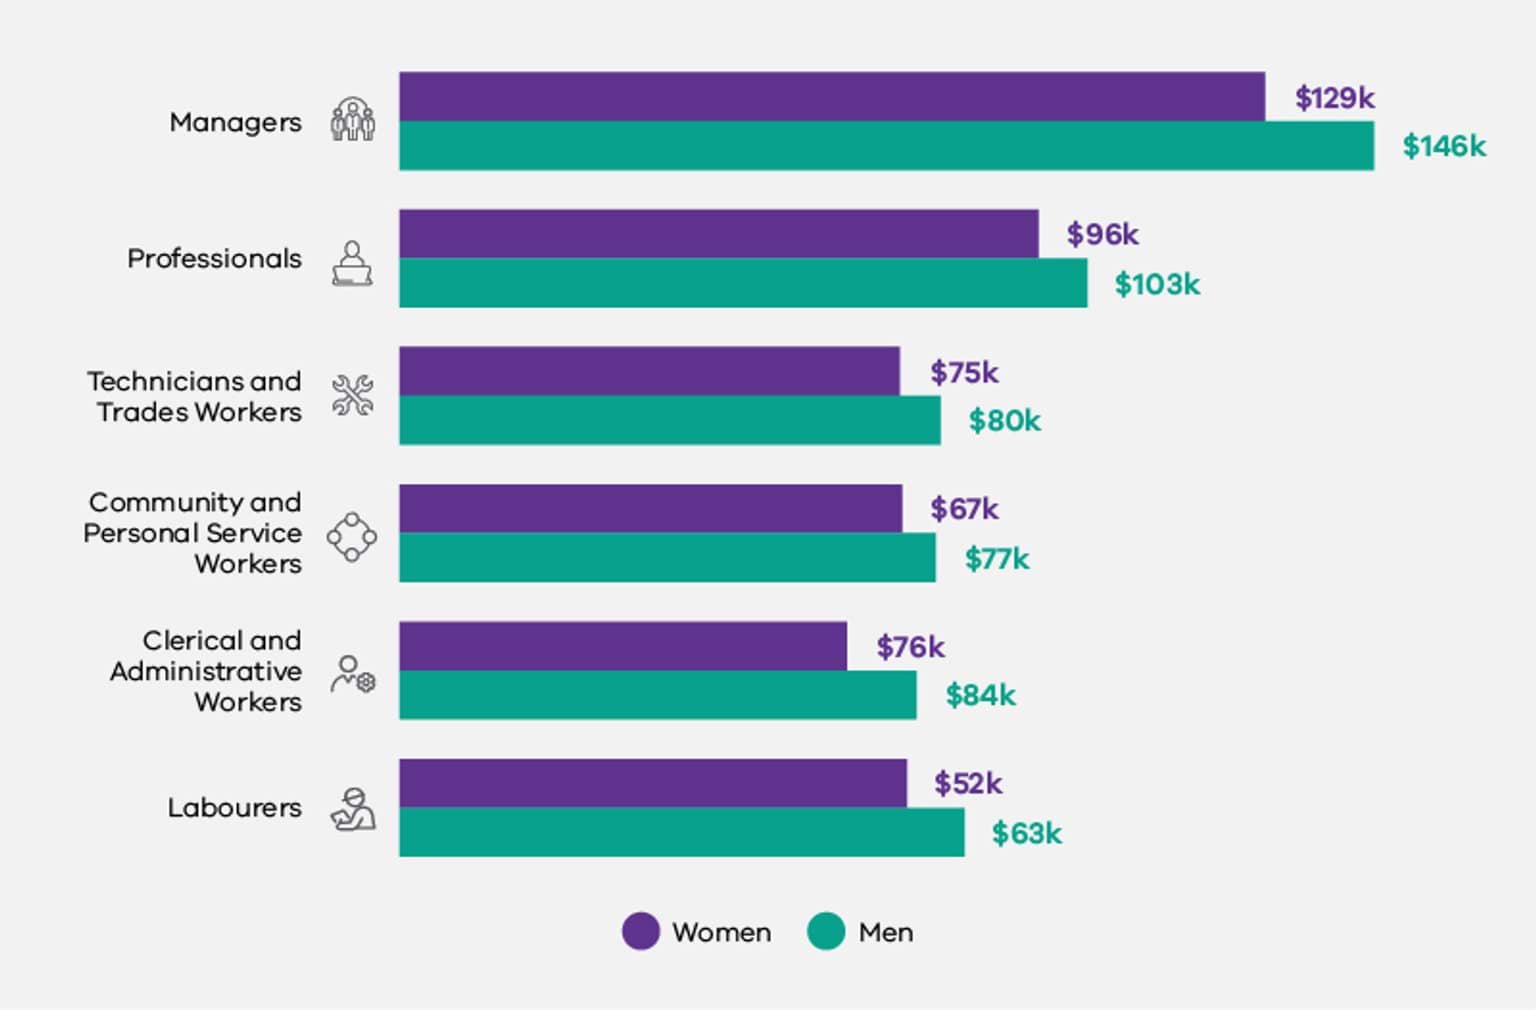
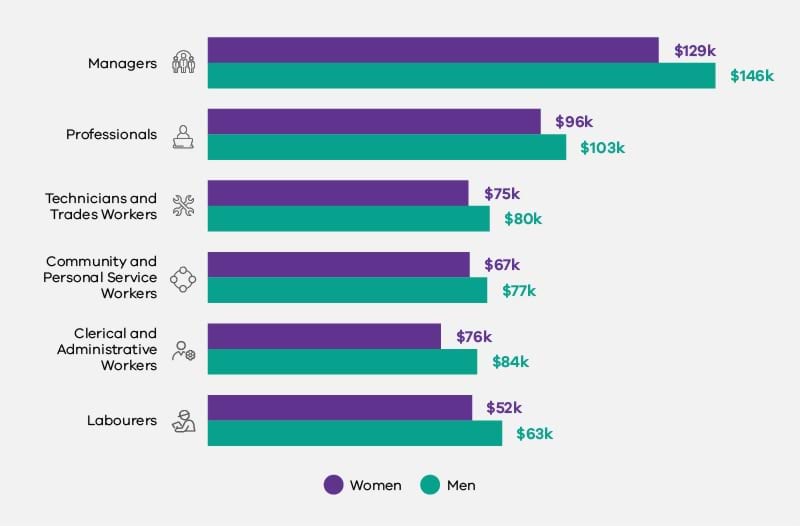
Fig. 2.4. Median base salary pay gap by occupation group
|
Occupation group* |
Median base salary pay gap |
|
|
Labourers |
17.7% |
$11,200 |
|
Community and Personal Service Workers |
13.3% |
$10,200 |
|
Managers |
11.6% |
$16,900 |
|
Clerical and Administrative Workers |
10.0% |
$8,500 |
|
Professionals |
6.9% |
$7,100 |
|
Technicians and Trades Workers |
6.4% |
$5,100 |
Notes: 1. Bolded figures represent the highest figures. 2. Occupation groups with small headcounts were not reported here (i.e., ‘Sales Workers’ and ‘Machine Operators and Drivers’) nor were individuals who were not assigned an occupation code by their employer.
As can be seen in Figure 2.4 above, the largest percentage pay gap was observed within the Labourers occupation. The median base salary for women working as labourers was 17.7% lower than for men – a difference of $11,200.
The largest pay gap in dollars was observed within the Managers occupation. The median base salary for women working as managers was 11.6% lower than for men – a difference of $16,900.
Interestingly, these findings do not align with occupational pay gaps in the private sector, where the largest percentage pay gaps were reflected in the Technicians and Trades Workers (27.7%) and Professional (18.2%) occupations.93 Notably, occupational full-time gender pay gaps are calculated across the WGEA dataset by management and non-management categories, with the widest pay gap in dollar amounts across both categories observed within the top three tiers of Manager categories.94
Pay gaps by industry
As shown in Figure 2.5 below, 11 out of 12 industry groups in the dataset had a pay gap in favour of men.
Fig 2.5. Median annualised base salary, by industry and gender
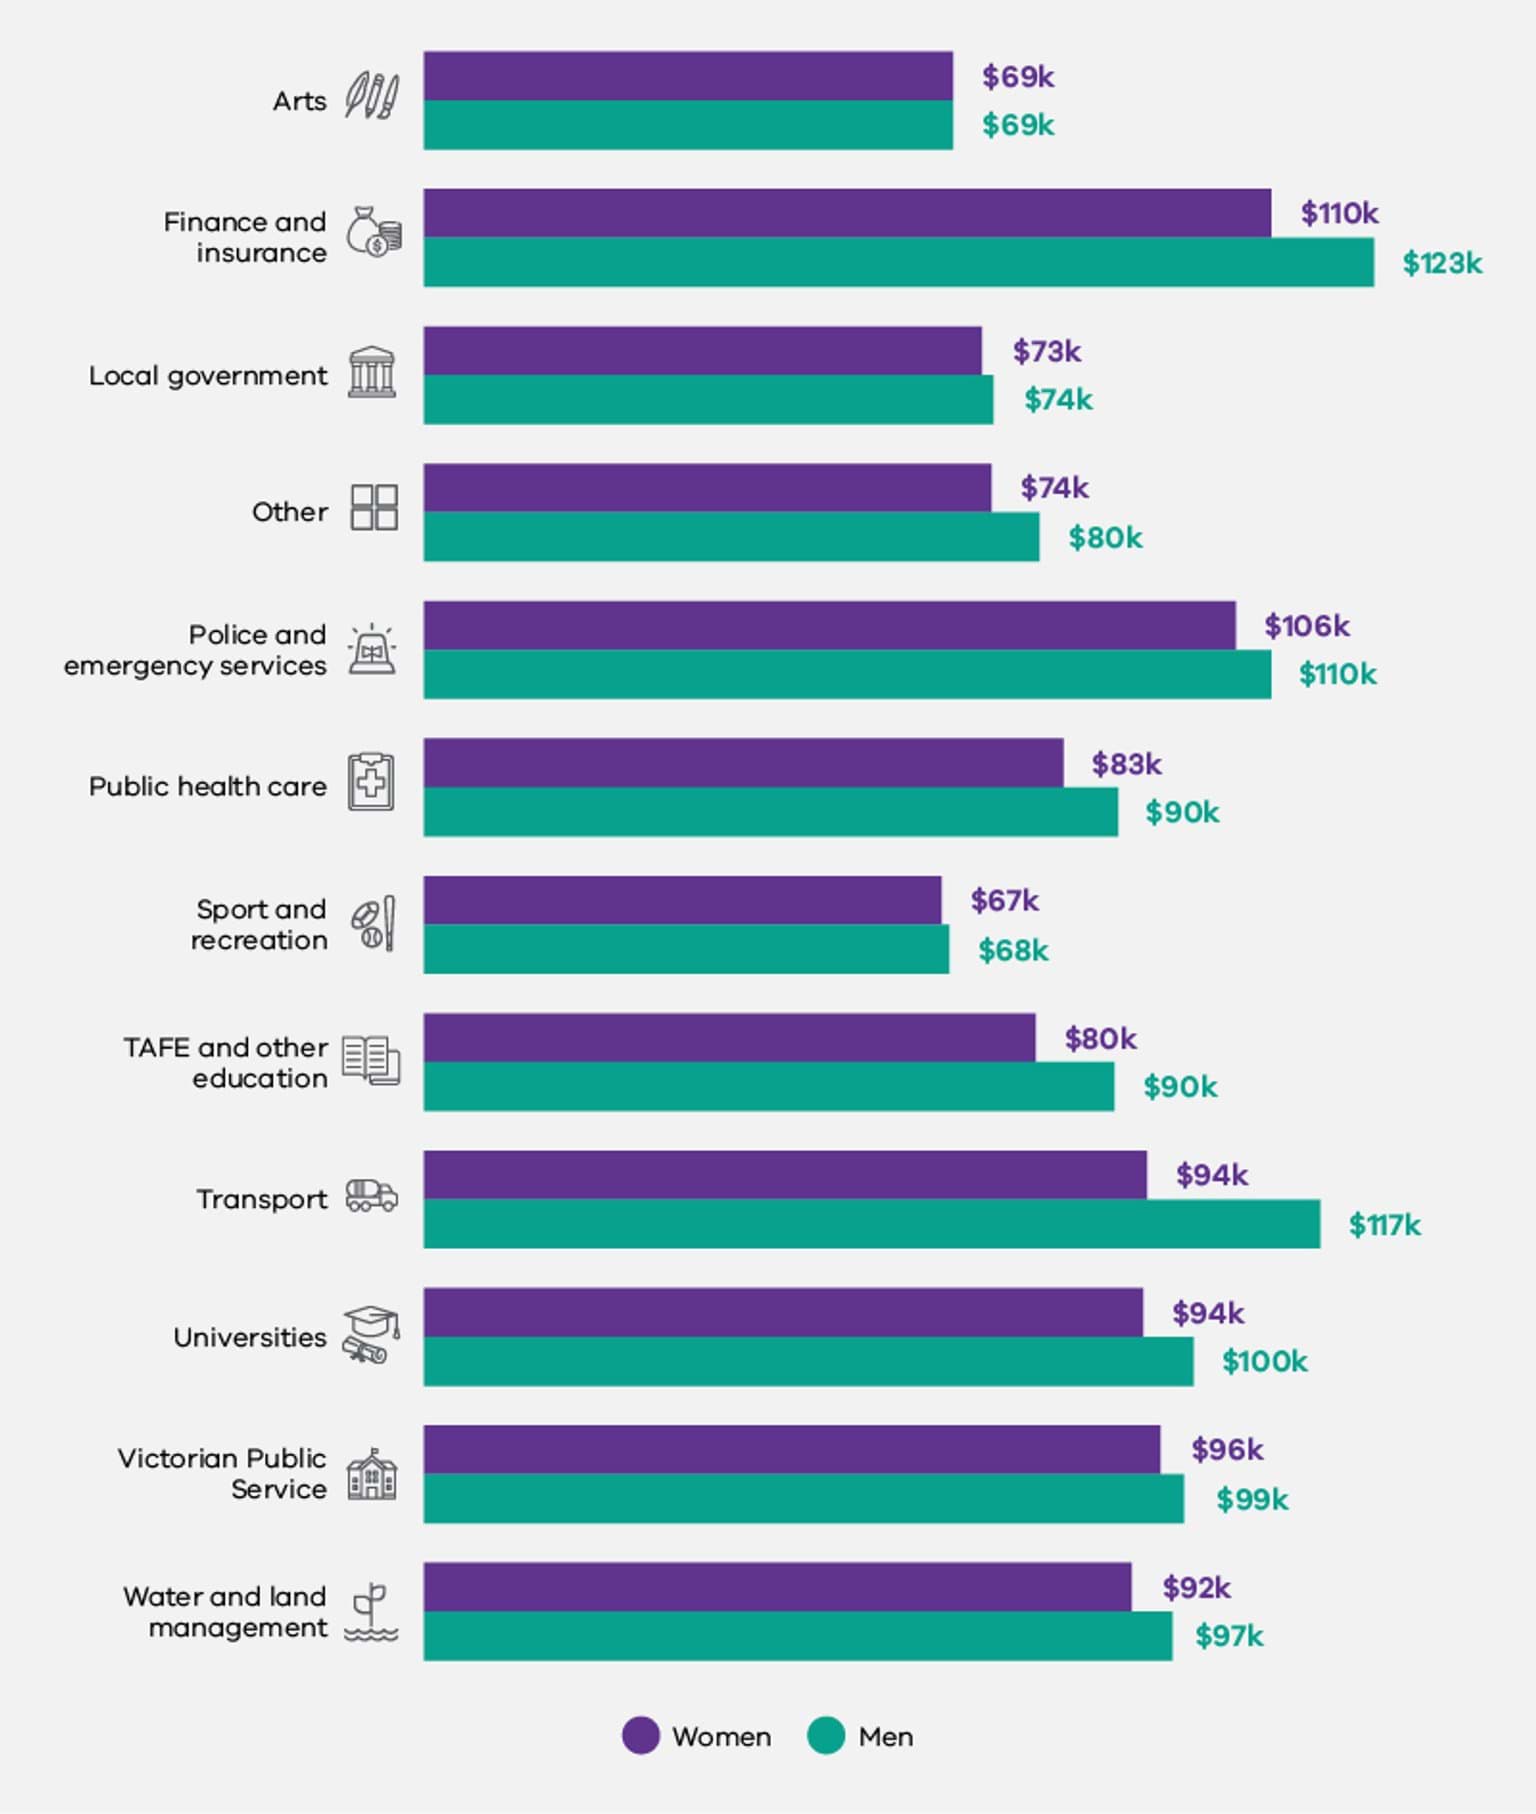
Significant and consistent pay gaps in favour of men were observed within organisations in 3 key industry groups: Transport, TAFE and Other Education, and Finance and Insurance (Figures 2.5 and 2.6). Significant but less consistent pay gaps were observed in the Public Health Care industry group. Consistent but less significant pay gaps were also observed in Universities and in the Police and Emergency Services industry group (Figures 2.5 and 2.6).
Fig. 2.6 Median base salary pay gap by industry group
|
Industry |
Median base salary pay gap |
Organisations with pay gaps in favour of men |
|
|
Transport |
19.4% |
$22,700 |
100% |
|
TAFE and other education |
11.2% |
$10,100 |
100% |
|
Finance and insurance |
11.1% |
$13,600 |
100% |
|
Public health care |
8.1% |
$7,300 |
61% |
|
Other |
7.6% |
$6,000 |
100% |
|
Universities |
6.6% |
$6,600 |
100% |
|
All industries |
6.1% |
$5,700 |
73% |
|
Water and land management |
5.4% |
$5,300 |
76% |
|
Police and emergency services |
3.7% |
$4,100 |
100% |
|
Victorian Public Service |
3.3% |
$3,300 |
91% |
|
Local government |
2.0% |
$1,500 |
58% |
|
Sport and recreation |
0.7% |
$500 |
91% |
|
Arts |
-0.2% |
-$200 |
57% |
Notes: 1. Bolded figures represent the highest figures. 2. Occupation groups with small headcounts were not reported here (i.e., ‘Sales Workers’ and ‘Machine Operators and Drivers’) nor were individuals who were not assigned an occupation code by their employer.
As Figure 2.7 shows, 9 out of the 12 industry groups had a pay gap in favour of men at the senior leadership level. Significant pay gaps were observed within four key industry groups: Police and Emergency Services (18.8%), Public Health Care (16.1%), Other (14.8%) and Universities (11.5%). When considering the gender pay gap found across the entire workforce within these industry groups (see Figure 2.5 above), this data reveals that the gender pay gap within industry groups widens significantly as women climb the leadership ladder. There were less significant pay gaps in favour of men at the senior leadership level in the Sport and Recreation, Local Government, Finance and Insurance, Transport and Water and Land Management industry groups.
There was a gender pay gap in favour of women in 2 out of the 12 industry groups: Arts (9.3%) and TAFE and Other Education (3%). Interestingly, there was also a narrow (0.2%) gender pay gap in favour of women across the entire workforce within the Arts industry group, however there was a significant (11.2%) and consistent gender pay gap in favour of men across the entire workforce within the TAFE and Other Education, where 100% of organisations in this industry group had a pay gap in favour of men (see Figure 2.6 above).
There was no gender pay gap at the senior leadership level in the Victorian Public Service.
Fig 2.7. Median annualised base salary for senior leaders, by industry and gender
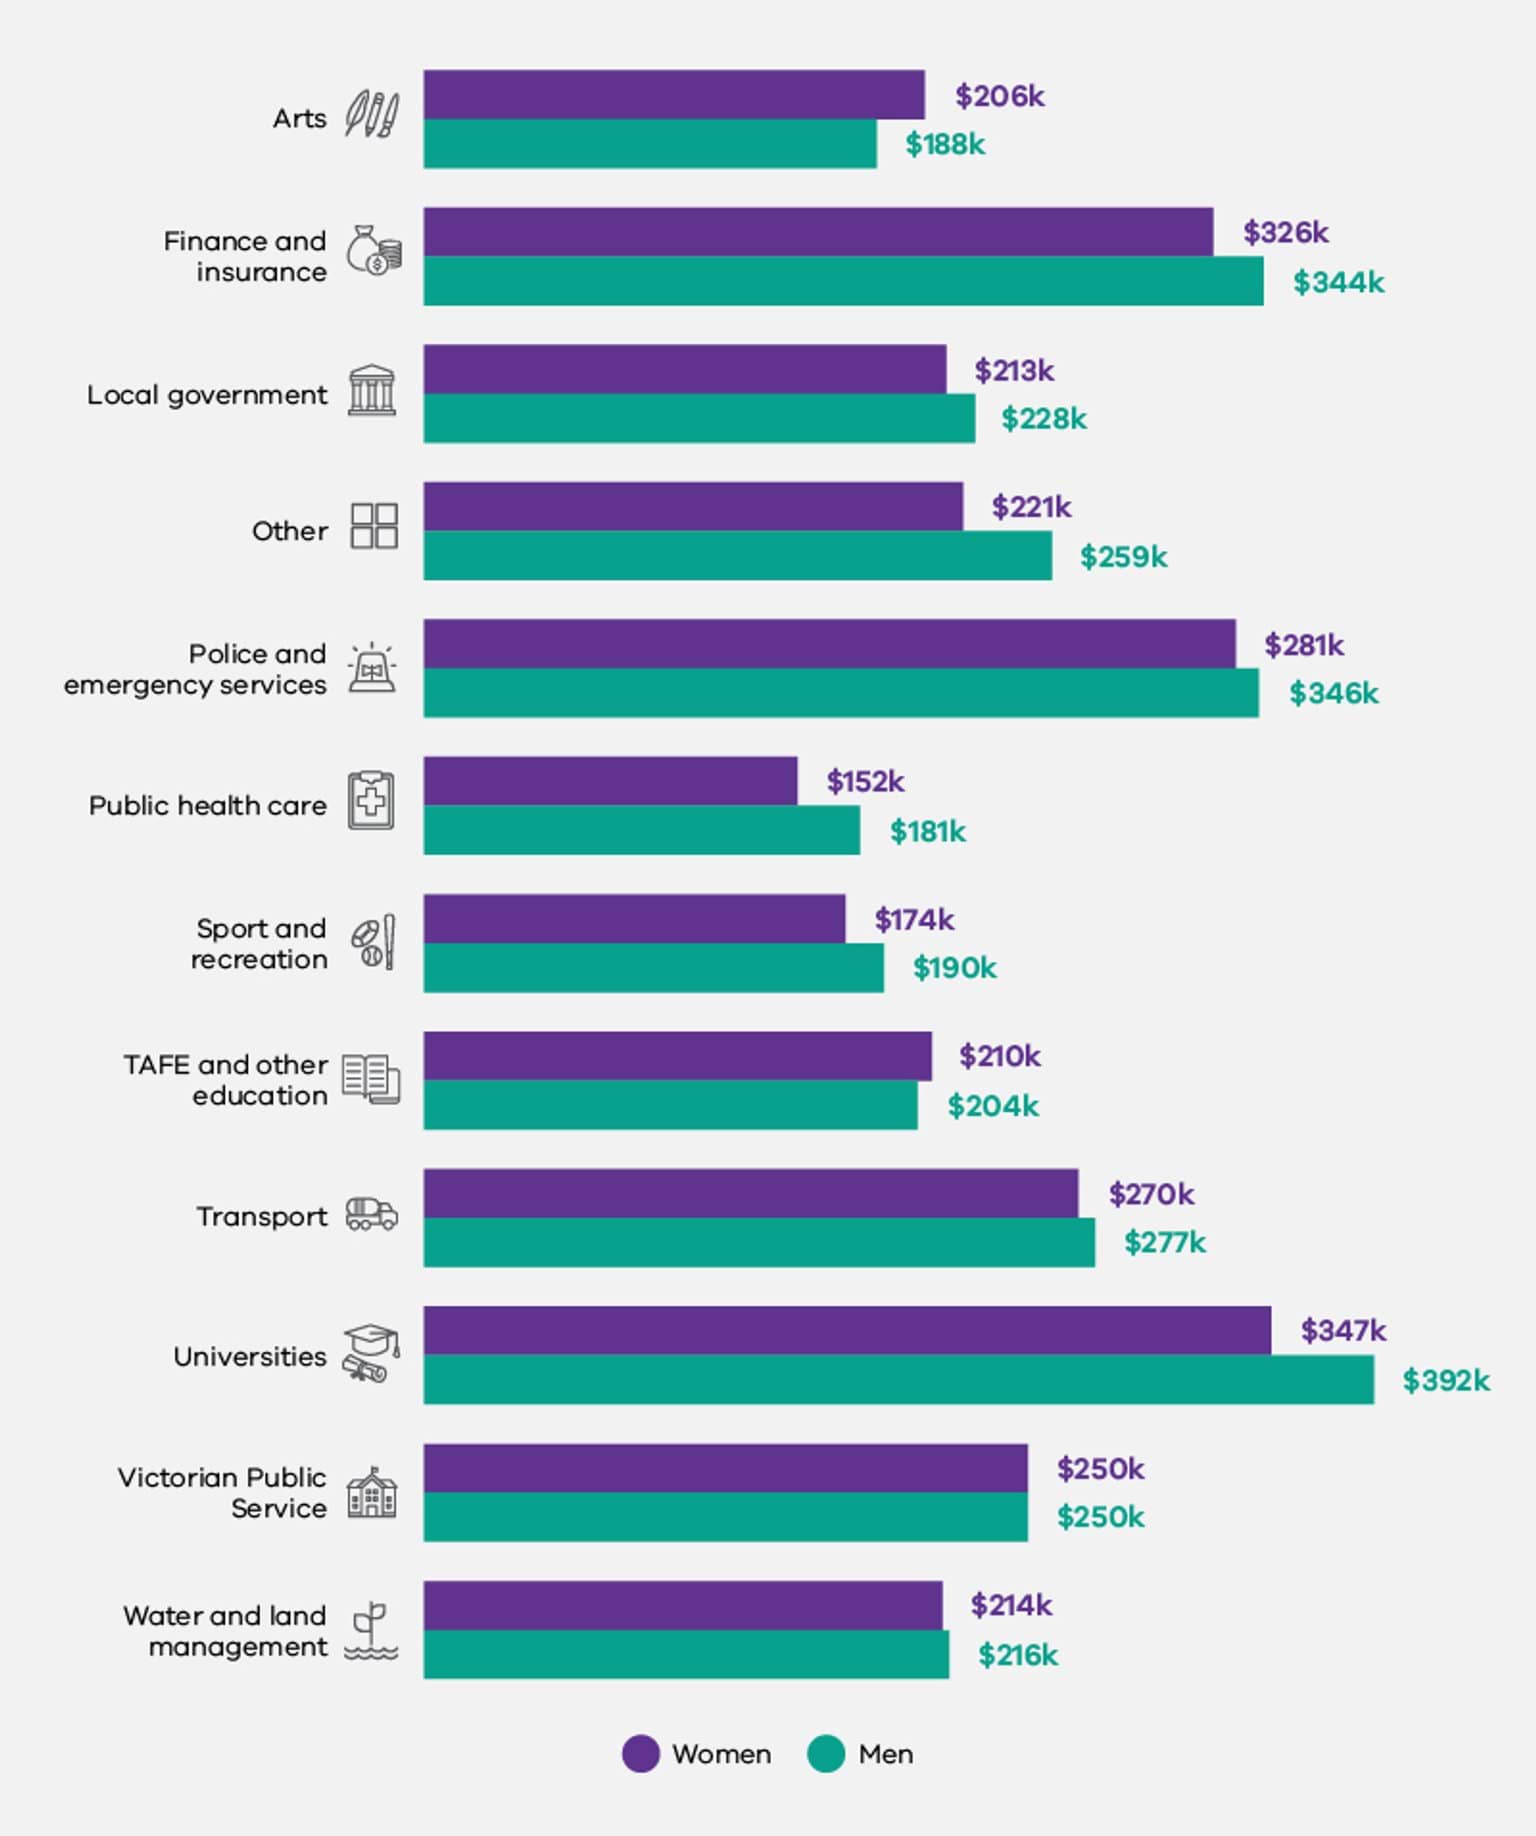
There was a significant gender pay gap at the CEO level in favour of men observed in 2 of the 8 industry groups at Figure 2.8 below: Sport and Recreation (25.9%) and Victorian Public Service (20.5%). In all other industry groups, there was a gender pay gap at the CEO level in favour of women, this was widest in the Arts (46.3%), TAFE and Other Education (31.6%) and Water and Land Management (18.4%) industry groups, and narrowest in the Local Government (7.2%), Other (1%) and Public Health Care (0.5%) industry groups.
Fig 2.8. Median annualised base salary for people in CEO roles, by industry and gender

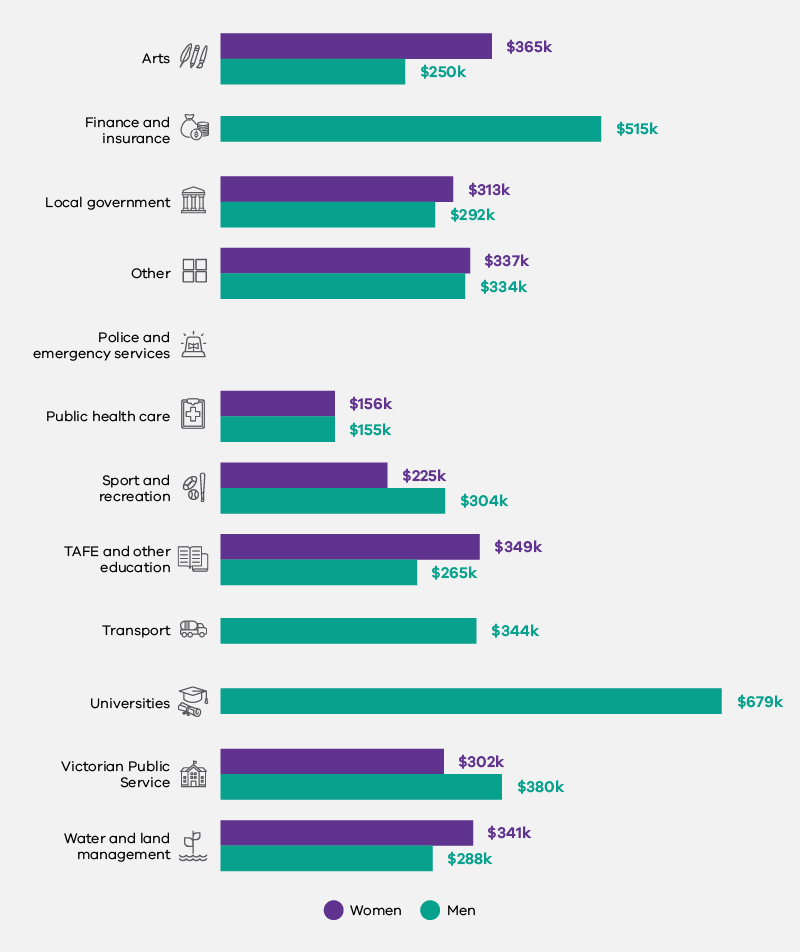
Pay scale representation
One in 3 men working in organisations reporting under the Act had a base salary above $109,000, compared to just one in 5 women (Figure 2.9). This means that only 20% of women in defined entities have a base salary in the top 25% of salaries, compared to 33% of men.
At the other end of the pay scale, one in 4 women had a base salary below $68,000, compared to just one in 5 men. This means that 27% of women working in the organisations comprising the Commission’s dataset had a base salary in the bottom 25% of salaries, compared to 21% of men.
This finding is consistent with the gender distributions across the Australian private sector and NSW public sector, which reflect a higher proportion of women in lower pay grades and a lower proportion in higher pay grades.96
Fig 2.9. Base salary pay quartiles, by gender

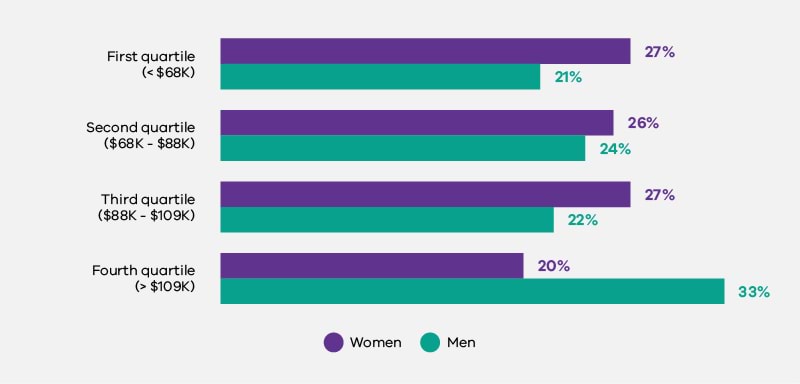
Gender pay gap and age
The gender pay gap between women and men working full time in organisations in this dataset increases with age.
As Figure 2.10 shows in the Commission’s dataset, the gender pay gap favouring men is smallest for employees aged between 25 and 34 years, with women in this age bracket earning a median base salary $2,800 lower than men in the same age group. This is a pay gap of 3.3%.
This gap begins to widen significantly for women in the 35 to 44 years age bracket (7.2%) and continues to widen for women in the next age bracket, 45 to 54 years (10.8%). The gender pay gap increases to its highest point (13.7%) for women aged 55 to 64 years. Women in this age bracket have median base salaries $13,200 lower than their male counterparts.
Fig 2.10. Difference between men's and women's median base salaries, by age
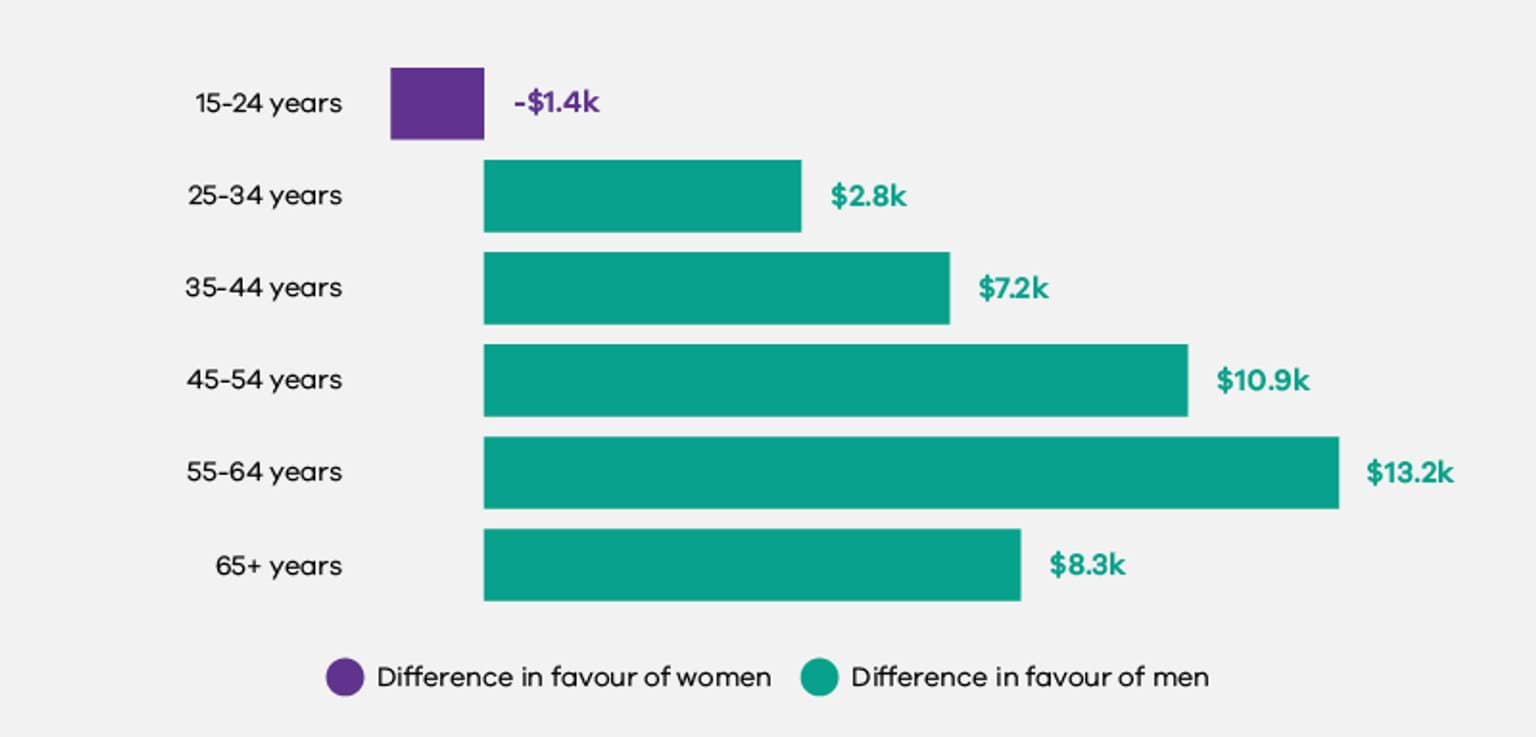
Discussion
Gender pay gaps are driven by a range of intersecting systemic and structural factors which must be tackled separately and collectively. In some cases, the gender pay gaps revealed through defined entities’ workplace gender audit data were lower than Victoria’s overall gender pay gap of 14.3%.97 Despite this, the 2021 workplace gender audit data still align firmly with existing research about the drivers of pay inequity.
The audit data revealed that across defined entities, the gender pay gap widened when considering total remuneration as compared to base salary. This finding demonstrates that men received the majority of additional paid benefits such as superannuation, bonuses and allowances.
The Commission’s data further indicates that men received the majority of salaries in the top 25%, while women received the majority of salaries in the bottom 25%. In certain industries, the pay gap widened even further, reflecting the industrial gender segregation that is pervasive across Australia.98 Higher gender pay gaps also correlate to other factors such as a reduced likelihood of offering paid parental leave.99
Data from Australia100 and around the world101 frequently indicates that the gender pay gap increases with age. This finding is reinforced by the Commission's gender audit data. Across defined entities, the pay gap increased with age, peaking in the 55-64 age group. Larger pay gaps in older age brackets can be attributed to a number of compounding inequalities across a woman’s career. These include women’s overrepresentation in part-time and casual employment, women’s reduced workforce participation due to caring responsibilities, women’s delayed or reduced promotion opportunities as a result of career interruptions and ongoing caring responsibilities, and compounded discrimination against older women.102
It is important to acknowledge the significance of the wage-setting context for the organisations covered by the Act. That is, notwithstanding the finding that public sector occupations and classifications generally have a narrow pay gap when women and men perform similar roles, defined entities are not the only actors determining pay and pay practices. Rather, wage-setting in individual defined entities may be directly influenced by personnel budget constraints, salary caps, and overall funding cuts that may restrict the pursuit of pay equity. As identified by Sojo et al., narrowing gender pay gaps across all defined entities will therefore require a unified approach, as well as the ‘co-operation and commitment of unions, industry bodies and professional associations – which all play varying roles in establishing rates of pay for different groups of workers’.103
Addressing gender pay gaps certainly requires looking at policies and processes around the allocation of salaries and other paid benefits. However, it is also essential to address systems and cultures around workplace flexibility and safety, stereotypes and norms about what roles and industries are seen as suitable for men and women, and the uneven distribution of unpaid caring work – among other contributing factors.104 While individual defined entities do not hold all of these levers, the collective focus and action spurred by the Gender Equality Act provides a unique opportunity to create change.
Recommendations
Research has shown that Australian organisations that are leading in relation to gender equality regularly measure and monitor their gender equality data.105 In these workplaces, organisation-wide, by-level and like-for-like pay parity analyses are undertaken at least annually, with gaps investigated and targeted for attention. Metrics are applied to both base salary and total remuneration.106
Research suggests that even though pay accounting techniques are perceived as impartial and objective, processes and systems of quantification (such as the processes applied to determine the gender pay gap in an organisation), and the decisions made about what and how to measure value and work-impact, can introduce bias into the outcomes.107 In fact, failure to identify and remedy gender bias in organisational processes, including those designed to support pay equity (such as job evaluations), is a key barrier to equal pay.108
It is therefore important that a gender lens is applied not only to pay practices within a defined entity, but also to the pay gap assessment process. This helps to identify any potential for bias in pay practices and pay audit results and avoids embedding gender bias in the relevant processes and systems.109 One way to consider bias in the gender pay audit process itself is to assess all the factors identified as legitimate causes of pay variation for potential bias – this may involve analysing employee performance measurement, promotion, recruitment and appointment systems.
Research has shown that if pay audits are not linked to pay-related decision-making and pay information systems, they often become purely analytical exercises, without any real impact on gender pay inequities.110 Defined entities should consider working towards embedding pay audit systems with pay-setting systems and human resources information systems to support ongoing monitoring of pay equity in the workplace.
Building internal capacity in relation to statistical literacy and pay practices can have impacts long after the data has been first collected. In fact, research suggests that statistical literacy designed to assist individuals to understand and interpret pay audits may also generate engagement with audit results and increase scrutiny of the audit methodology.111 This, in turn, helps ensure the quality of the data collected.112 Further, linking pay audits to pay system planning and pay-related decisions (for example, by creating strategic partnerships between those responsible for handing pay audit data and remuneration managers or line managers making pay-related decisions) provides greater opportunity for pay audit findings to be actioned.113
Investing in training and resources to support the development and use of high-quality pay equity data, can help develop this linkage between pay audits and broader pay-related processes. Presenting pay audit results in non-expert language can also support the translation of pay audit information into outcomes, by supporting employees’ ability to use pay gap disclosure to inform their pay and employment decisions.114
The Commission understands that many defined entities have experienced challenges in collating intersectional pay gap data, including due to a lack of data collection system capacity. However, research suggests that the gender pay gaps identified across defined entities are likely to be wider for employees who experience multiple forms of disadvantage and discrimination based on their individual characteristics.115 It is therefore critical that organisations covered by the Act actively improve their data collection systems to enable intersectional analyses.
References
- KPMG, She’s Price(d)less: The economics of the gender pay gap, KPMG, 13 July 2022, accessed 13 July 2022.
- KPMG, She’s Price(d)less.
- Workplace Gender Equality Agency (WGEA), Australia’s Gender Pay Gap Statistics, WGEA, 8 March 2022, accessed 22 July 2022.
- WGEA, Australia’s Gender Pay Gap Statistics 2019 [PDF 1.01 MB], WGEA, February 2019, accessed 22 July 2022.
- Victoria’s full-time average weekly base salary gender pay gap was 11.2% in November 2020 compared to 14.3% in November 2021. Australian Bureau of Statistics (ABS), Average Weekly Earnings, Australia, ABS Website, November 2021, accessed 12 July 2022.
- ABS, Average Weekly Earnings, Australia.
- KPMG, She’s Price(d)less.
- KPMG, She’s Price(d)less.
- KPMG, Towards a more equal sharing of work, KPMG, May 2021; The Treasury, Retirement Income Review: Final Report, Australian Government, July 2020, pp 262–263.
- KPMG, Towards a more equal sharing of work, p.14. Voluntary contributions play a role in closing the superannuation gap at retirement age as, on average, women aged 55-64 make significantly larger voluntary contributions to their super than men: The Treasury, Retirement Income Review: Final Report, p. 272.
- The Treasury, Retirement Income Review: Final Report, p. 257.
- The Treasury, Retirement Income Review: Final Report, p. 257.
- KPMG, Towards a more equal sharing of work; WGEA, Wages and Ages: Mapping the Gender Pay Gap by Age, WGEA, 27 June 2022, accessed 22 July 2022.
- Victorian Government, ‘Intersectionality in gender inequality’, Gender Equality Baseline Report, Victorian Government, 2019, accessed 22 July 2022.
- Department of Premier and Cabinet, Safe and Strong: A Victorian gender equality strategy, Victorian Government, 2016, accessed 22 July 2022.
- Victorian Government, ‘Intersectionality in gender inequality’
- Department of Premier and Cabinet, Safe and Strong; Australian Institute for Health and Wellbeing (AIHW), Homelessness among indigenous Australians, AIHW, 2014, accessed 22 July 2022.
- For the first time under Australian gender equality reporting legislation, organisations covered by the Act were required to provide data disaggregated not only by gender, but across a range of attributes. As outlined in the Introduction, we will publish insights from this intersectional data in our companion report on intersectionality, to be released in 2023.
- That is, how much each employee was paid over the course of the year.
- That is, how much each employee would be paid if they worked full-time hours.
- It should be noted that the Commission did not publish specific guidance on how to report casual remuneration. As a result, there was some variation between data provided by defined entities. This omission will be corrected in future audit guidance materials for defined entities.
- This is consistent across Australia. WGEA found that Australian women are 3 times more likely to be working part time than men, primarily because of their higher unpaid caring load. WGEA, Removing the motherhood penalty, WGEA, May 2018, accessed 22 July 2022.
- T Fitzsimmons, et al., Employer of Choice for Gender Equality: Leading practices in strategy, policy and implementation, AIBE Centre for Gender Equality in the Workplace, 2020, p. 18.
- Organisation for Economic Co-operation and Development (OECD), Gender wage gap (indicator), OECD, 2022, accessed 22 July 2022.
- Victorian Public Sector Commission (VPSC), Employee pay and gender pay, VPSC, 2022, accessed 25 July 2022. Note: See Figure 2.1 for specifications of VPSC gender pay gap calculation.
- NSW Public Service Commission, ‘Gender’, Workforce Profile Report 2020, State of New South Wales, 2020, accessed 22 July 2022.
- WGEA, Australia's gender equality scorecard: Key results from the Workplace Gender Equality Agency’s 2020-21 employer census, WGEA website, February 2022, accessed 25 July 2022. Note: see Figure 2.1 for specifications of WGEA gender pay gap calculation.
- WGEA, Australia’s Gender Pay Gap Statistics, WGEA website, February 2022, accessed 25 July.
- In 2020-21, WGEA’s full-time total remuneration gender pay gap was 23.1% for key management personnel, 22.5% for other executives and general managers, 17.7% for senior managers and 19.8% for other managers: WGEA, Australia’s gender equality scorecard: Key results from the Workplace Gender Equality Agency’s 2020-21 employer census [PDF 1.00 MB] WGEA, February 2022, p. 12, accessed 25 July 2022.
- Note: Results have not been reported for cohorts composed of one individual. In particular, we have not included the gender pay gap data at the CEO level for the Finance and Insurance, Police and Emergency Services, Transport, and Universities industry groups, in these findings
- WGEA, Australia's gender equality scorecard, p. 11; NSW Public Service Commission, ‘Gender’, Workforce Profile Report 2020, State of New South Wales, 2020, accessed 22 July 2022.
- ABS, Average Weekly Earnings, Australia.
- KPMG, She’s Price(d)less, p 24.
- KPMG, She’s Price(d)less, p 24.
- WGEA, Australia’s Gender Pay Gap Statistics.
- UK Office for National Statistics, ‘Gender pay gap in the UK’, Census 2021, UK Office for National Statistics website, October 2021, accessed 25 July 2022; Statistics Canada, Employee wages by industry, annual, Statistics Canada website, July 2022, accessed 25 July 2022; Statistics Iceland, Unadjusted gender pay gap 2019, Statistics Iceland website, January 2021, accessed 25 July 2022; Te Kawa Mataaho Public Service Commission,, Pay gaps, Te Kawa Mataaho Public Service Commission, New Zealand, , December 2021, accessed 25 July 2022.
- WGEA, Wages and Ages.
- V Sojo, et al., What works, what’s fair? Using systematic reviews to build the evidence base on strategies to increase gender equality in the public sector, The University of Melbourne, The Australian National University, and Swinburne University of Technology, 2022, doi: 10.6084/m9.figshare.19243536, p.78.
- KPMG, She’s Price(d)less.
- Fitzsimmons et al., Employer of Choice for Gender Equality.
- Fitzsimmons et al., Employer of Choice for Gender Equality.
- Sojo et al., What works, what’s fair?, p.73.
- Sojo et al., What works, what’s fair?, p. 82; J Rubery, ‘Joan Acker and Doing Comparable Worth’, Gender, Work and Organization, 2019, 26(12):1786-1793, doi:/10.1111/gwao.12242.
- Sojo et al., What works, what’s fair?, pp. 76, 82.
- Sojo et al., What works, what’s fair?, pp. 73-74, 77.
- Sojo et al., What works, what’s fair?, p. 78.
- Sojo et al., What works, what’s fair?, p. 78.
- Sojo et al., What works, what’s fair?, p. 84.
- Sojo et al., What works, what’s fair? p. 84.
- A Hegewisch and E Mefferd, Gender Wage Gaps Remain Wide in Year Two of the Pandemic, Institute for Women’s Policy Research website, March 2022, accessed 25 July 2022; L Hopkins and V Salvestrini, Caught at the Crossroads? An Intersectional Approach to Gender and Ethnicity Pay Gaps in the HE Universities & Colleges Employers Association website, November 2018, accessed 25 July 2022.
Workplace sexual harassment
This chapter looks at the data for the gender equality indicator ‘sexual harassment in the workplace’.
Introduction
Workplace sexual harassment remains widespread and persistent. Research collected over the past five decades confirms that it occurs in every industry and at all levels of the workforce, with 39% of Australian women and 26% of Australian men having experienced sexual harassment in the workplace in the five years to 2018.116 Seventy-nine per cent of these experiences of workplace sexual harassment were reported to have been perpetrated by men.117
The most frequently reported types of sexually harassing behaviour are sexually suggestive comments or jokes and intrusive questions about a person’s private life or physical appearance.118 Sexual harassment behaviour also includes repeated unwanted invitations to go on dates or pressure for sex, leering, unwelcome touching, cornering, or hugging, sexually explicit emails, phone calls or text messages and actual or attempted rape or sexual assault.119
Key issues: Why was this measured?
Gender inequality drives workplace sexual harassment
Gender inequality – that is, structural and social power disparities between genders – is the key driver of sexual harassment.120
Other forms of disadvantage and discrimination can intersect with gender inequality to magnify power imbalances that can also drive sexual harassment.121 In a 2018 national survey 45% of young people aged 18–29 years, 55% of Aboriginal women, 52% of people with diverse sexual orientations and 52% of women living with disability reported that they had experienced workplace sexual harassment in the preceding 5 years.122
Workplace culture and settings influence prevalence
In addition to the foundational drivers of sexual harassment, poor workplace culture, a lack of understanding about what constitutes workplace sexual harassment, and the use of alcohol in a work context, also play a critical role in contributing to the prevalence of workplace sexual harassment.123
Sexual harassment is also more prevalent in workplaces that are organised by a rigid hierarchy (such as police, legal and medical organisations), where men are over-represented in the workforce and/or over-represented in senior leadership roles, and in which the nature of the work is considered non-traditional for women. It is also more prevalent in workplaces that involve a lot of contact with patients, clients, or customers (such as social assistance and healthcare).124
Workplace sexual harassment is harmful
At the individual level, the impacts of sexual harassment can be life changing. The physical and psycho-social harms associated with workplace sexual harassment can compromise a victim-survivor’s long-term workforce participation, job satisfaction and productivity – and therefore their economic security.125
In addition to organisational impacts such as staff turnover and financial and legal costs associated with complaints, workplace sexual harassment also impacts workplace cultures and reputations.126
Workplace sexual harassment significantly impacts our economy. Deloitte Access Economics estimated that workplace sexual harassment cost the Australian economy $3.8 billion in 2018. Employers bore 70% of these financial costs, government 23% and individuals 7%.127
There are many barriers to formal reporting for victims
Research has continued to find that formal reporting of workplace sexual harassment is low, with the Australian Human Rights Commission’s 2018 Respect@Work National Inquiry finding that only 17% of respondents made a formal complaint about the sexual harassment they had experienced.128 Key barriers to reporting included fear of victimisation, a concern that others would think the victim was overreacting, uncertainty as to what amounts to sexual harassment, a perception that the behaviour was commonplace or accepted, and a lack of confidence in the effectiveness and/or confidentiality of the employer’s reporting system.129
How was this indicator measured?
Organisations covered by the Act were required to provide the following workforce data over the period from 1 July 2020 to 30 June 2021:
- the number and nature of formal sexual harassment complaints made, disaggregated in various ways, such as by gender, intersectionality attributes and the complainant’s relationship to the organisation (whether they were an employee, governing body member, member of the public alleging harassment by a staff member or other).130
- the outcomes of any formal sexual harassment complaints, including any settlement and/or non-disclosure agreements, and the overall satisfaction with these outcomes.
In addition, employees of defined entities were invited to participate in a standardised employee experience survey. Organisations were surveyed separately, and the results were reported to the Commission as percentages of respondents. Items with fewer than 10 responses were suppressed to protect respondents’ privacy.
The Commission measured this indicator from responses to questions about:
- The experience of sexual harassment in the previous 12 months and whether this was formally reported or not (disaggregated by gender and other intersectional attributes)
- If sexual harassment was experienced but not formally reported, the reasons for this (disaggregated by gender and other intersectional attributes)
- Complaint handling and outcome satisfaction
- Bystander actions
- Workplace cultures
What was found: Key data insights
Experiences of sexual harassment
As set out in Figure 3.1 below, across organisations covered under the Act, an estimated 6% of women and 4% of men reported experiencing sexual harassment at work in the previous 12 months.131
Women were most likely to have experienced sexual harassment in the Transport industry group (14%) or in Police and Emergency Services (12%). These were also the 2 industry groups with the highest proportion of men in the workforce (75% and 64% respectively). Men were most likely to have experienced sexual harassment in Universities (7%) or in the Arts industry group (7%).
Fig 3.1. Proportion of survey respondents who reported experiencing sexual harassment at work, by industry and gender
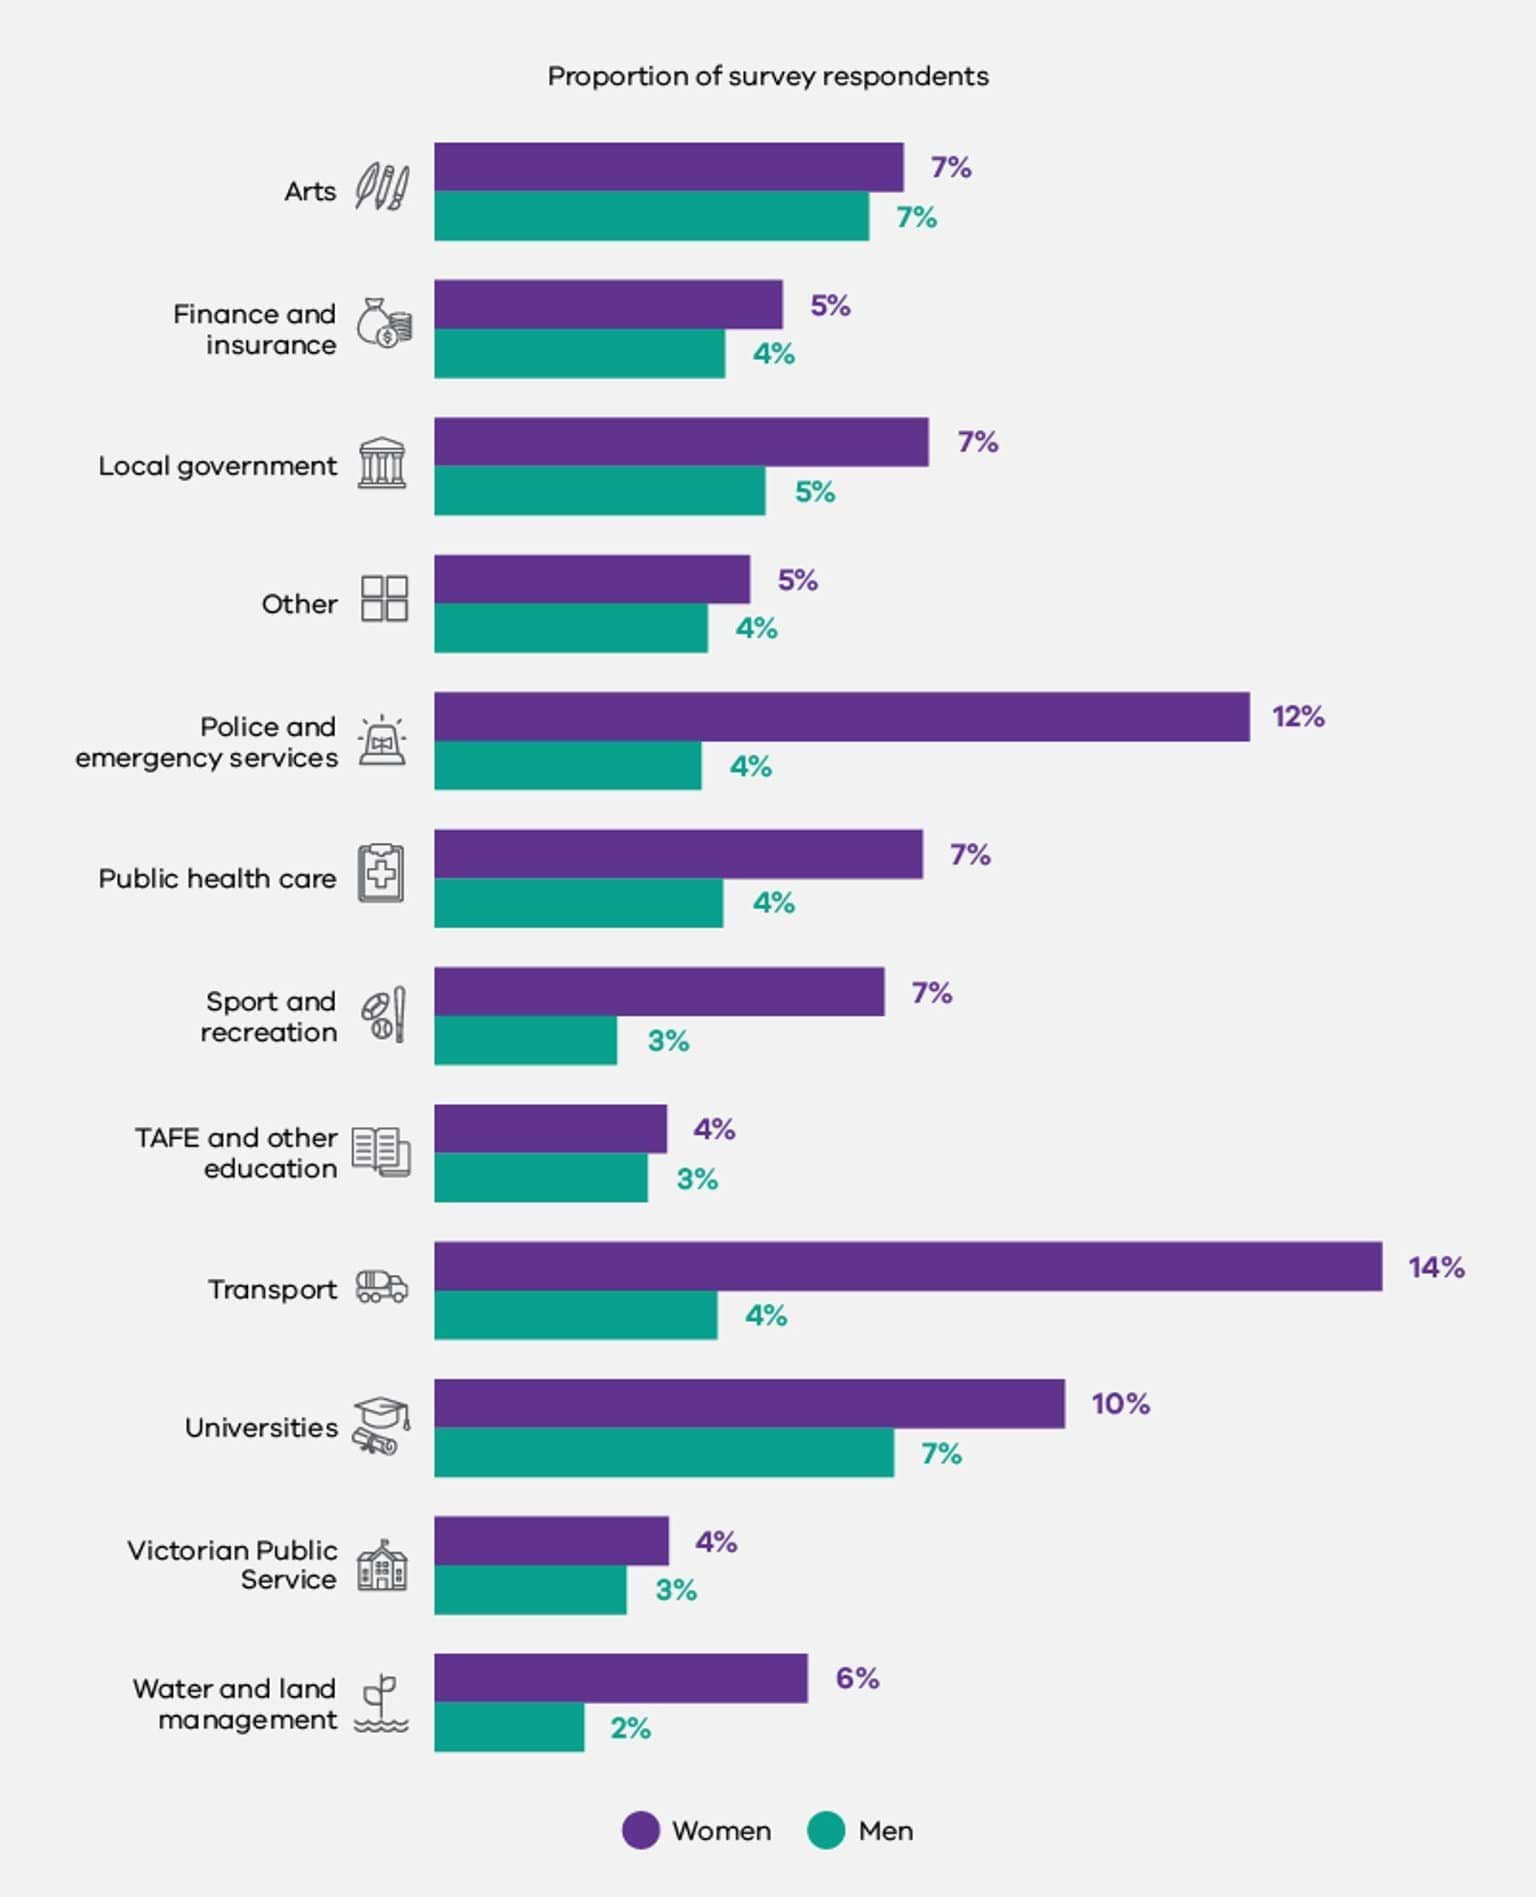
Types of sexual harassment experienced
As can be seen in Figure 3.2 below, and in line with findings from other research132, the most common sexual harassment behaviours reported by both women and men were sexually suggestive comments or jokes and intrusive questions about the survey respondent’s private life or comments about their physical appearance. Women were more likely to have experienced most types of sexual harassment behaviours than men.
Fig 3.2. Types of sexual harassment behaviour reported by survey participants, by gender
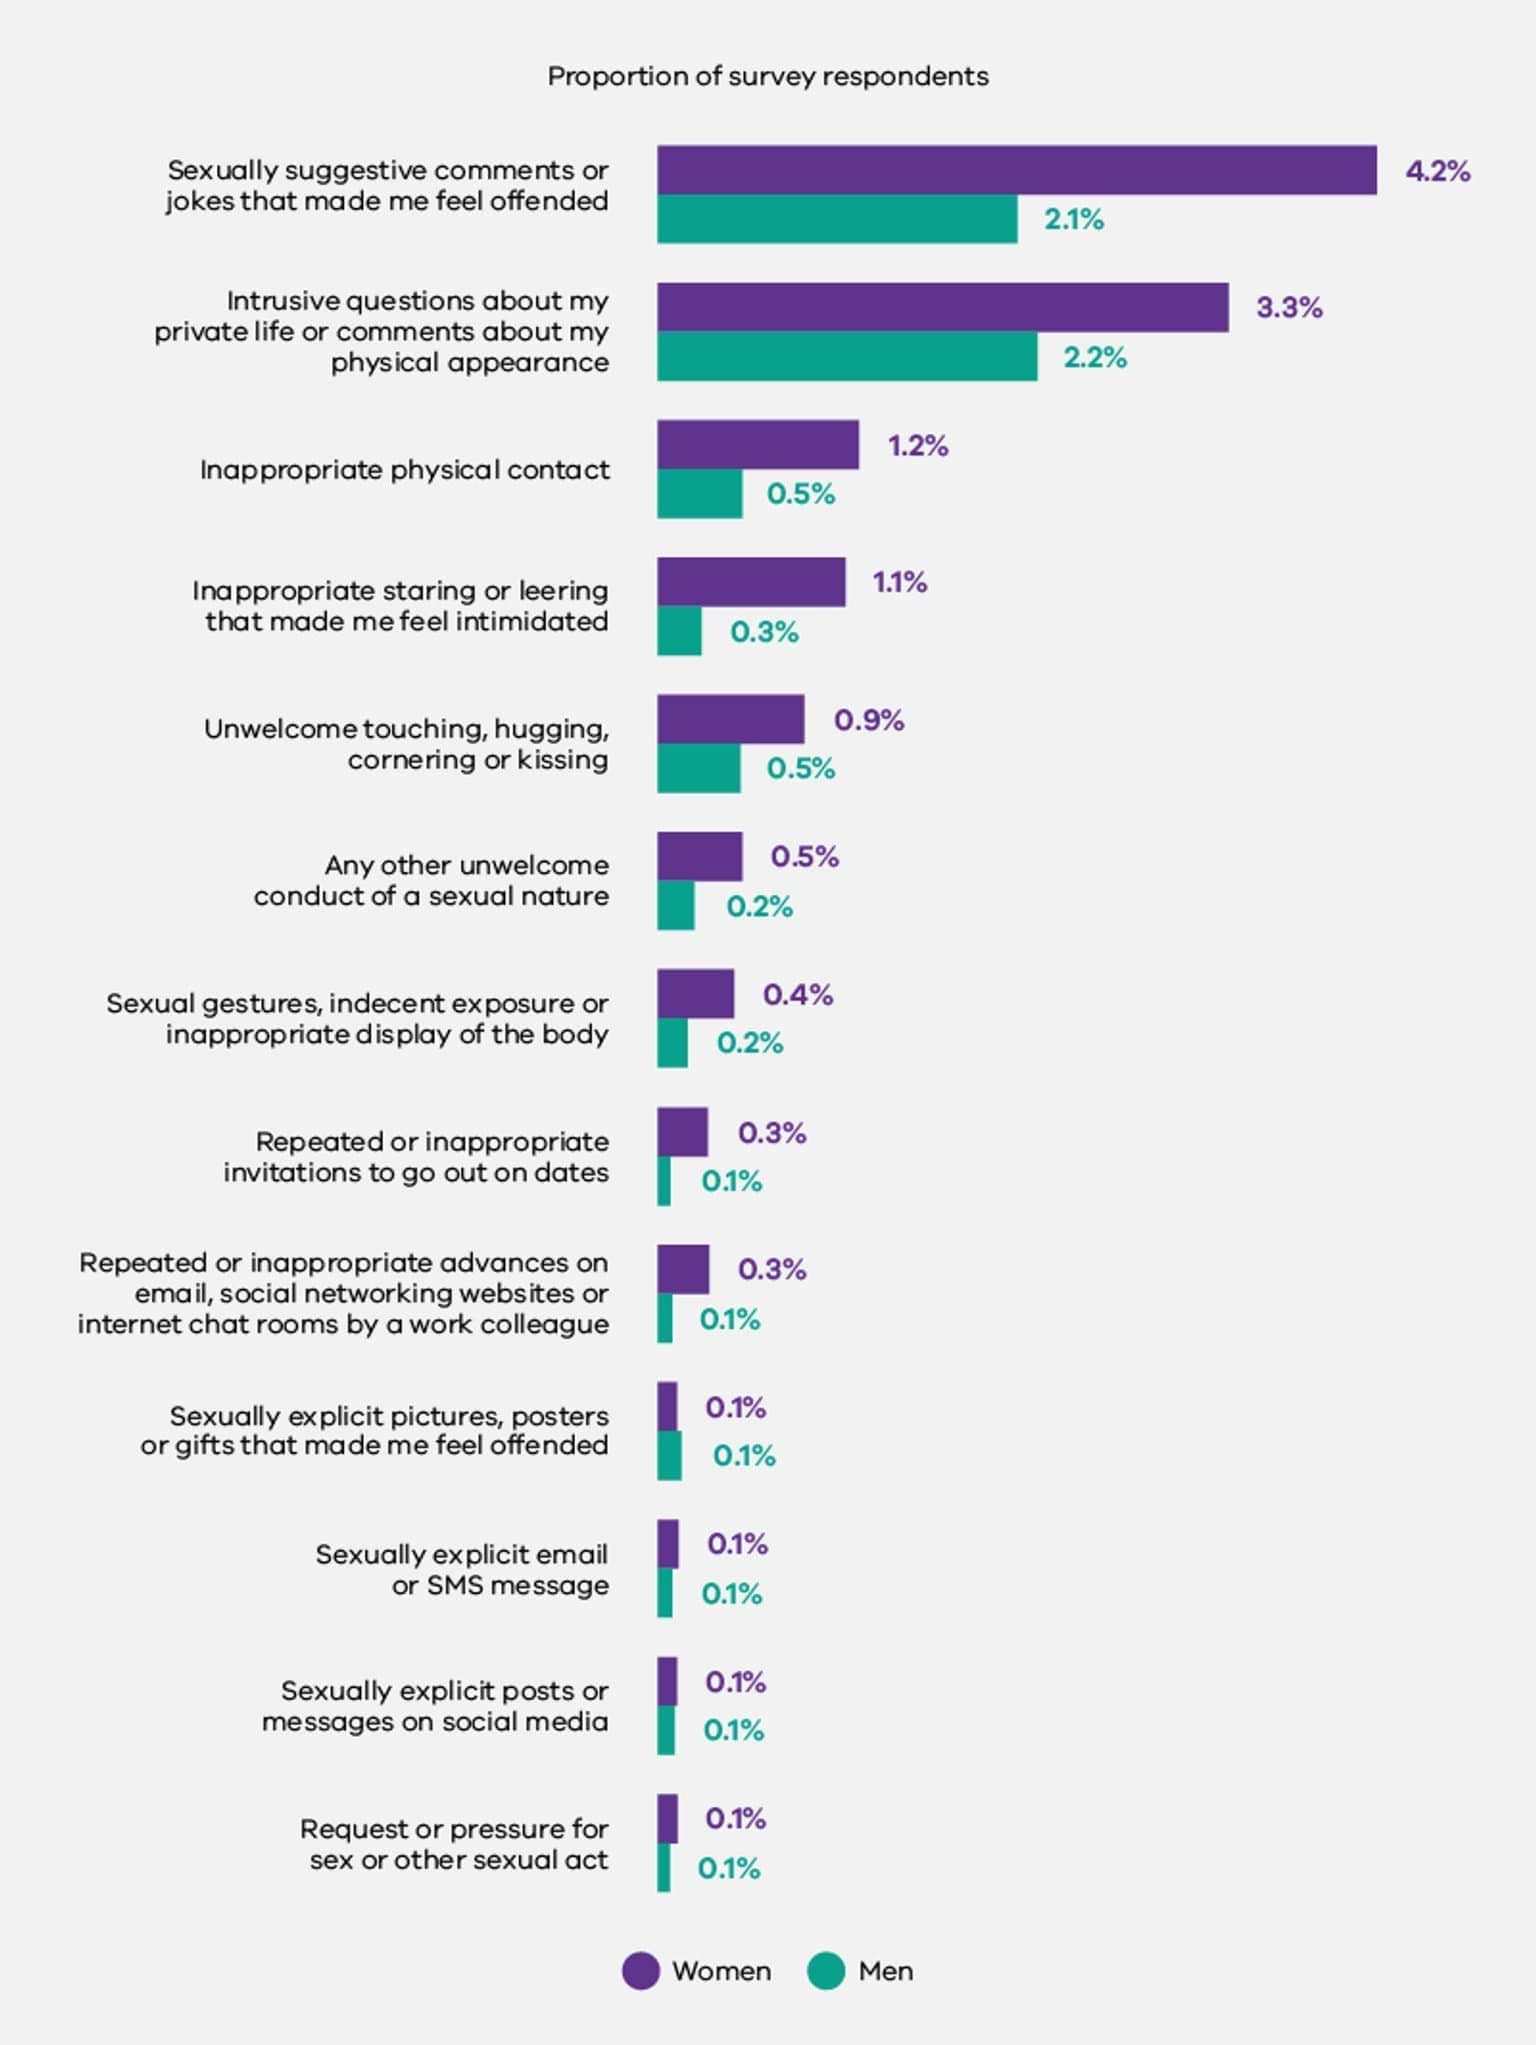
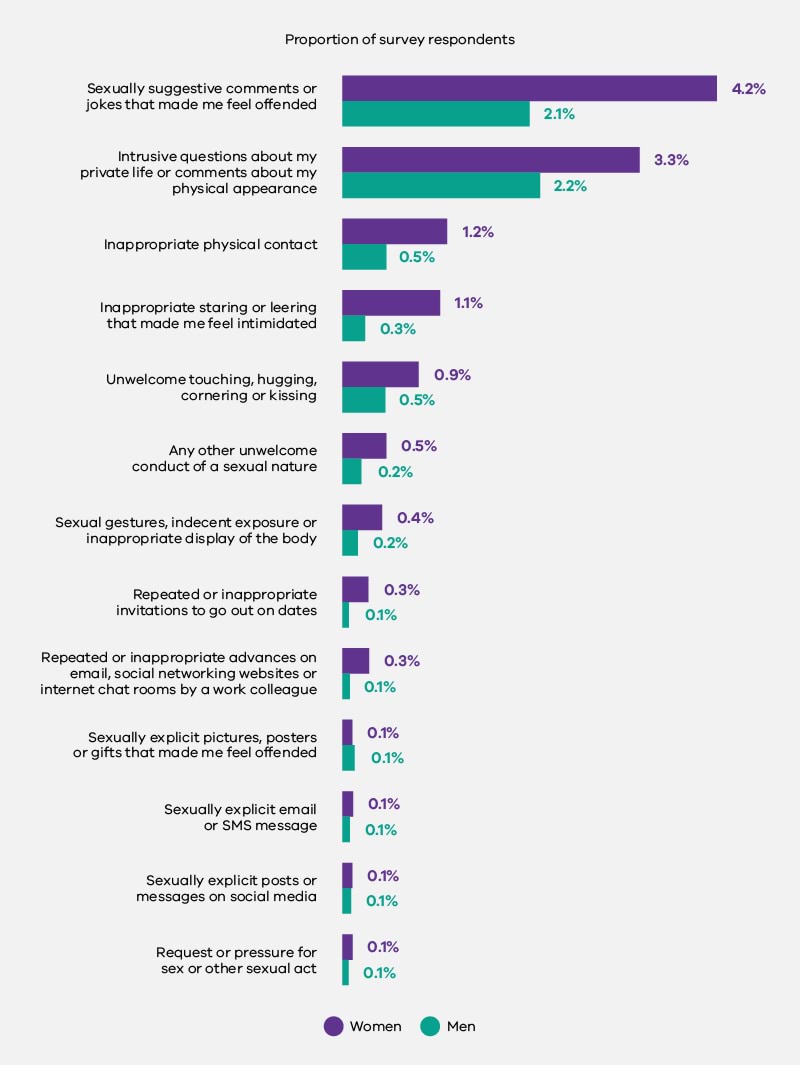
Victims' responses to sexual harassment
Survey respondents who indicated that they had experienced workplace sexual harassment in the previous 12 months were asked how they had responded. As Figure 3.3 below shows, the most common responses to sexual harassment for both men and women were to pretend the behaviour didn’t bother them, to try to laugh it off, or to try to forget about it. More women than men said they responded by avoiding the person, by telling a colleague, by telling the person the behaviour was not okay, by telling a friend or family member, by telling a manager, or by avoiding locations where the behaviour might occur.
Fig 3.3. Responses to sexual harassment, by gender
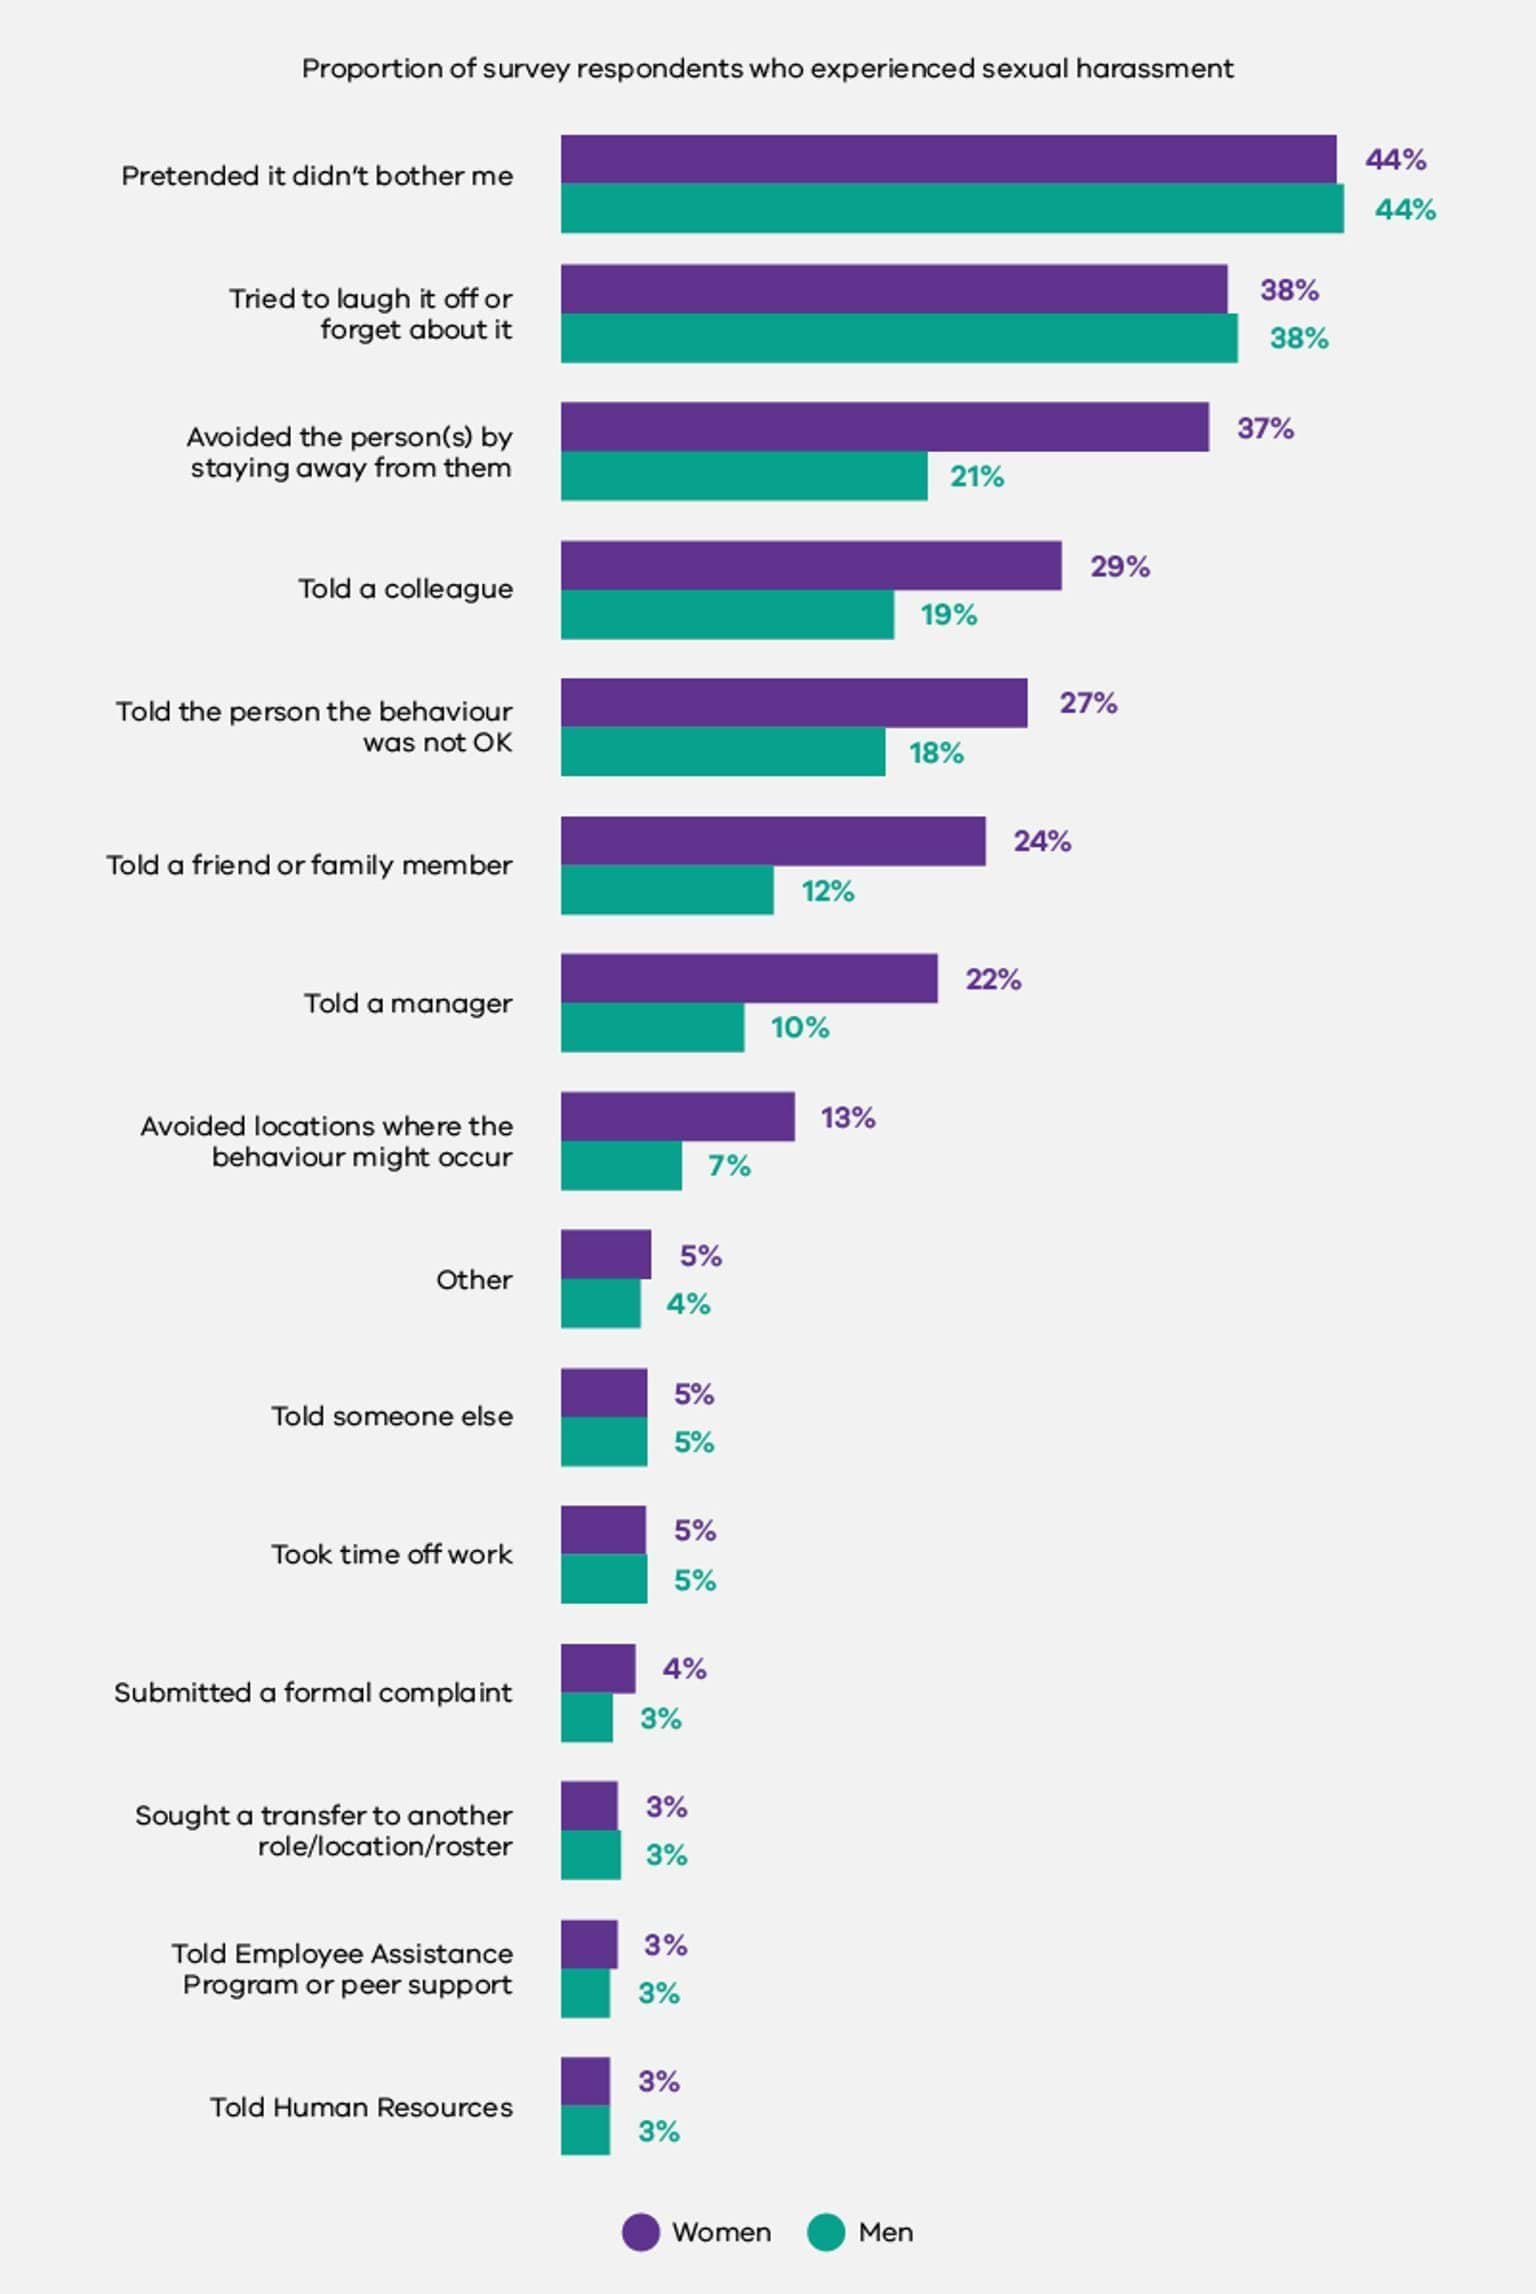
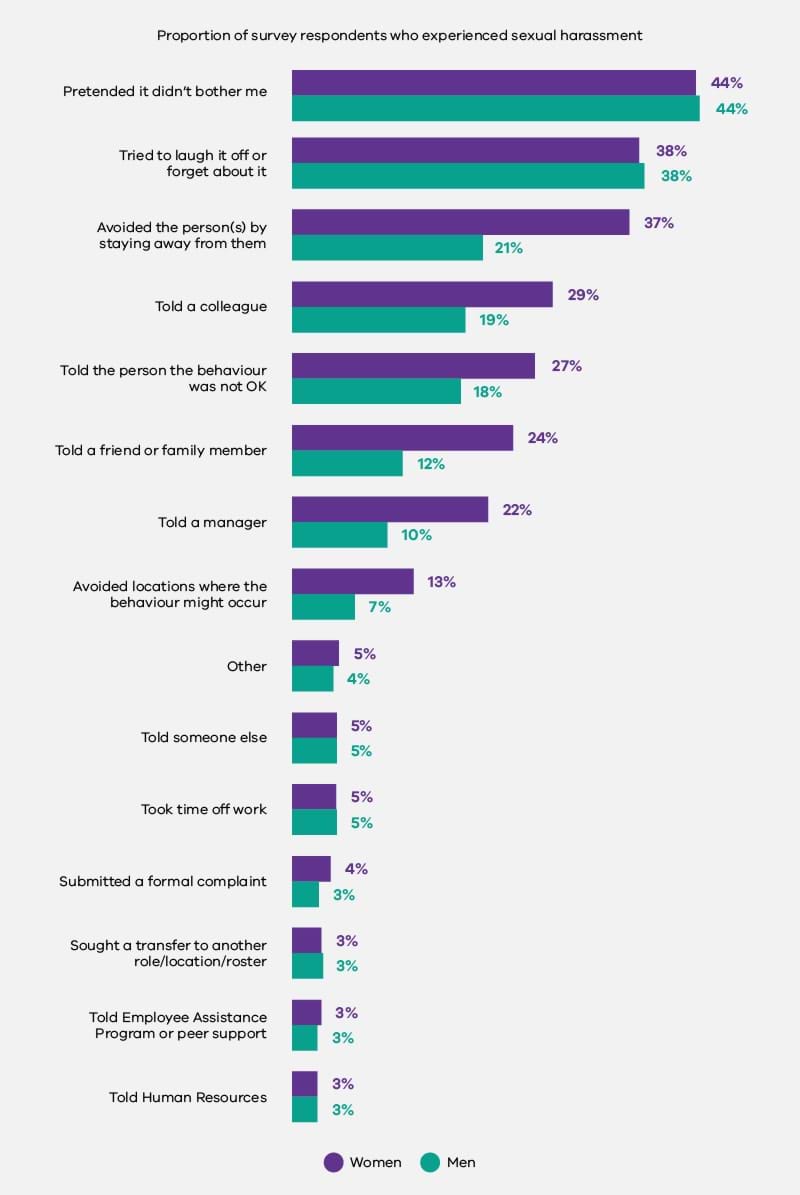
As Figure 3.4 below shows, a significant majority of experiences of sexual harassment went unreported through formal channels – regardless of the gender of the complainant or the industry in which they worked.
Across all organisations covered by the Act, only 4% of women and 3% of men who said they had experienced sexual harassment in the survey, went on to file a formal complaint. Formal complaints were most common for women in the Water and Land Management industry group.
In the Local Government industry group, there was a stark discrepancy between genders, with women more than 5 times more likely to make a formal complaint than men. In 3 industry groups, none of the men who said they had experienced sexual harassment made a formal complaint.
Fig 3.4. Proportion of survey respondents who experienced sexual harassment who made a formal complaint, by industry and gender

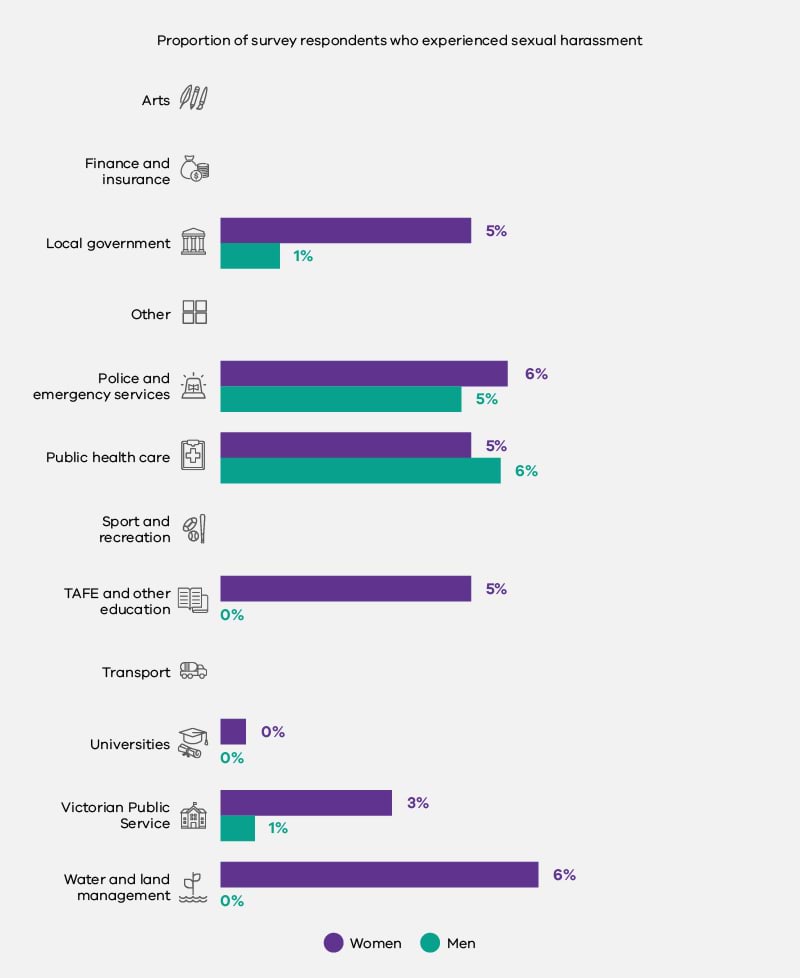
As seen in Figure 3.5 below, among those survey respondents who did not make a formal complaint after experiencing sexual harassment, 47% of women and 38% of men said they didn’t think the harassment was serious enough. For women, the next most common reason was that they didn’t think it would make a difference (36%). For men, the next most common reason was that they believed there would be negative consequences for their own reputation (38%). Further, 29% of men and 18% of women said they did not report their experience of sexual harassment because they believed this would have negative consequences for their career.
Fig 3.5. Reasons why survey respondents did not make a formal sexual harassment complaint, by gender

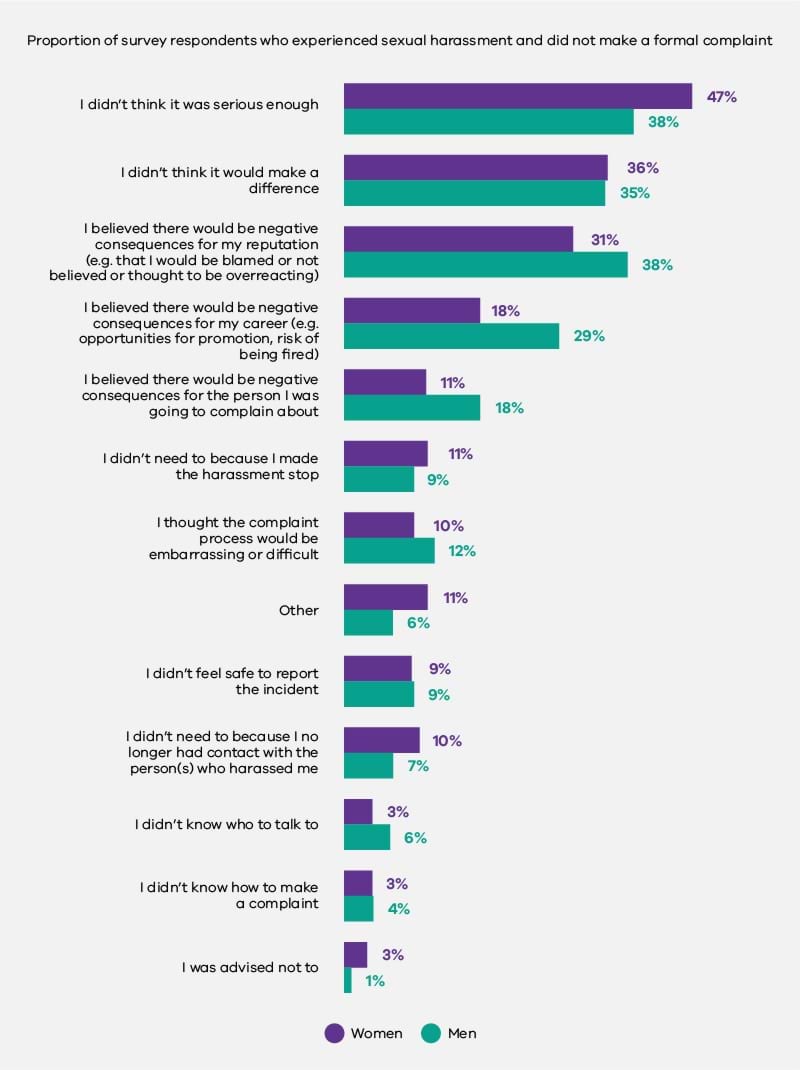
Challenging inappropriate behaviour
Across all organisations covered by the Act, an estimated 61% of women and 70% of men who responded to the survey, said they felt safe to challenge inappropriate behaviour at work. In all 12 industry groups, men were more likely to say they felt safe to challenge inappropriate behaviour than women (Figure 3.6, below). Those in the Sport and Recreation industry group felt safest to challenge inappropriate behaviour (72% of women and 84% of men). Those employed in the University industry group felt least safe to challenge inappropriate behaviour (49% of women and 61% of men). Only 55% of women in the Police and Emergency Services industry group said they felt safe to do so.
Fig 3.6. Proportion of survey respondents who felt safe to challenge inappropriate behaviour at work, by industry and gender
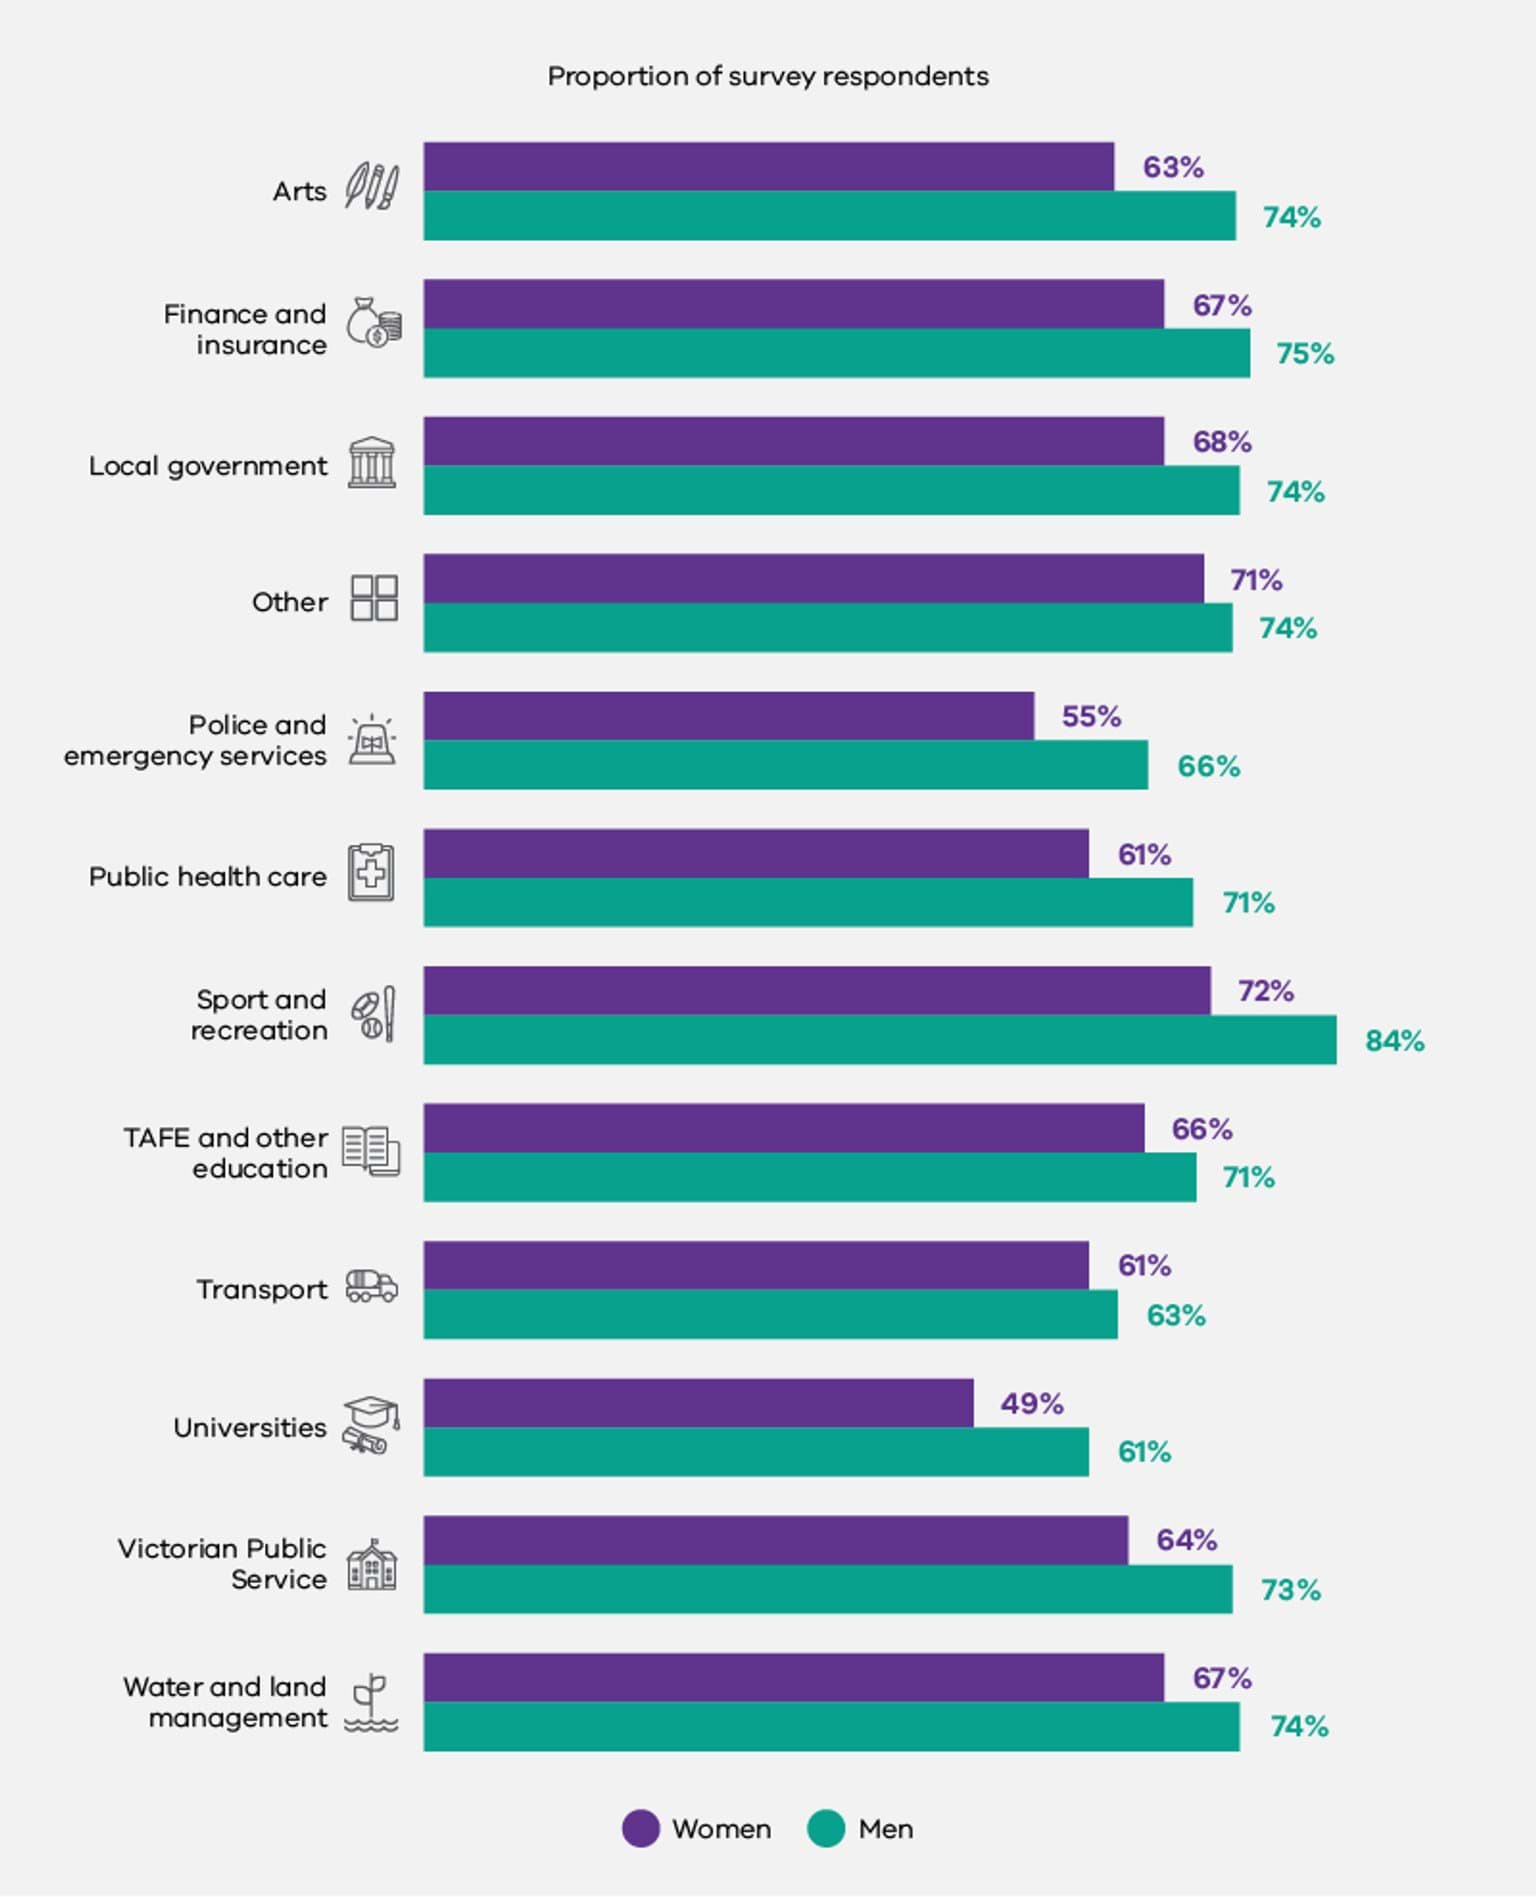
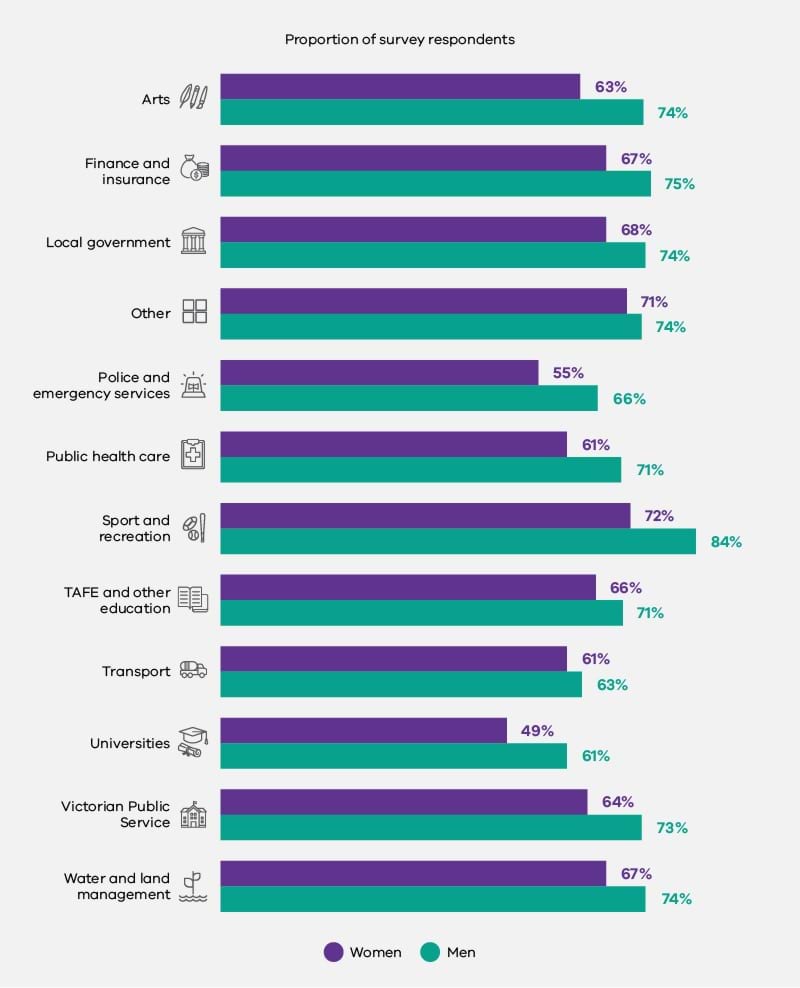
Formal complaints
The Commission only received formal sexual harassment complaint data from 186 organisations, 95 of which had not received any formal sexual harassment complaints.
Of the remaining 91 organisations with formal sexual harassment complaints data, 88 provided detail around the complainant’s relationship to the organisation. Within this dataset, the vast majority of formal sexual harassment complaints were lodged by employees – about 70% of whom were women.
Fig 3.7. Formal sexual harassment complaints, by type and gender of complainant
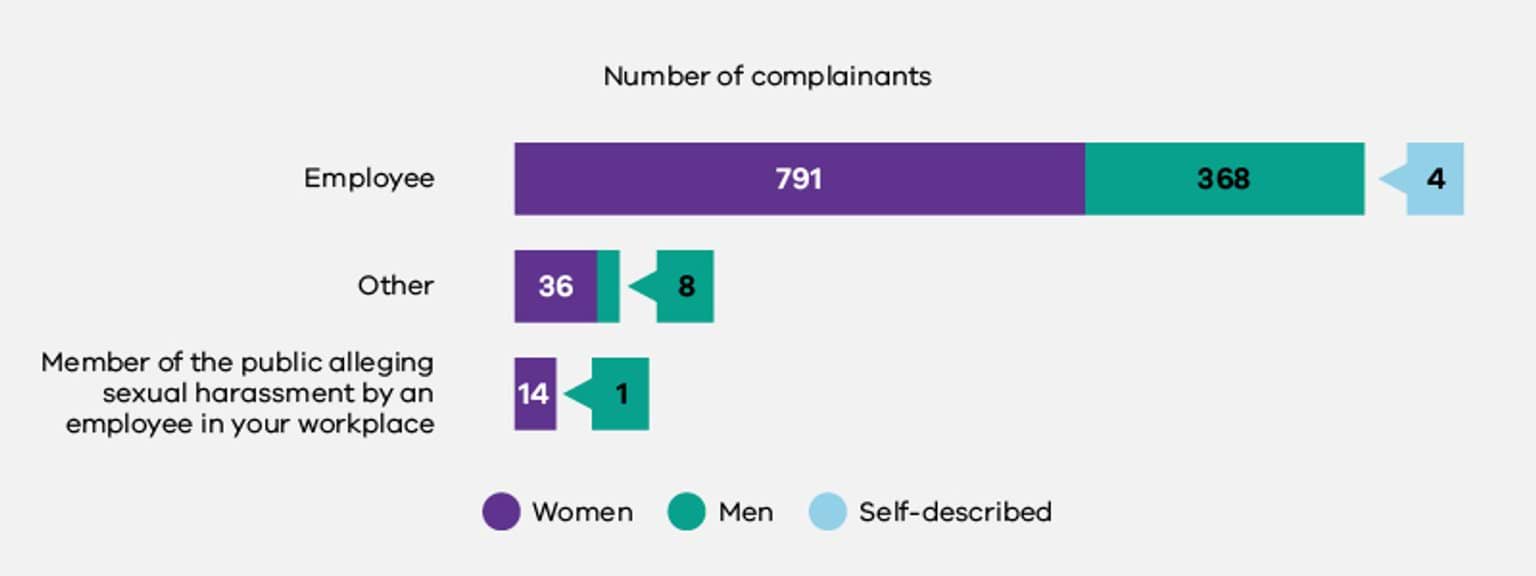
The Commission received formal complaint outcome data from 83 organisations. A significant number of complaints were registered as ‘Other outcome’, which some organisations used to capture industry-specific actions.133 The next most common outcome was disciplinary action against the perpetrator.
Fig 3.8. Formal sexual harassment complaints, by outcome and gender of complainant
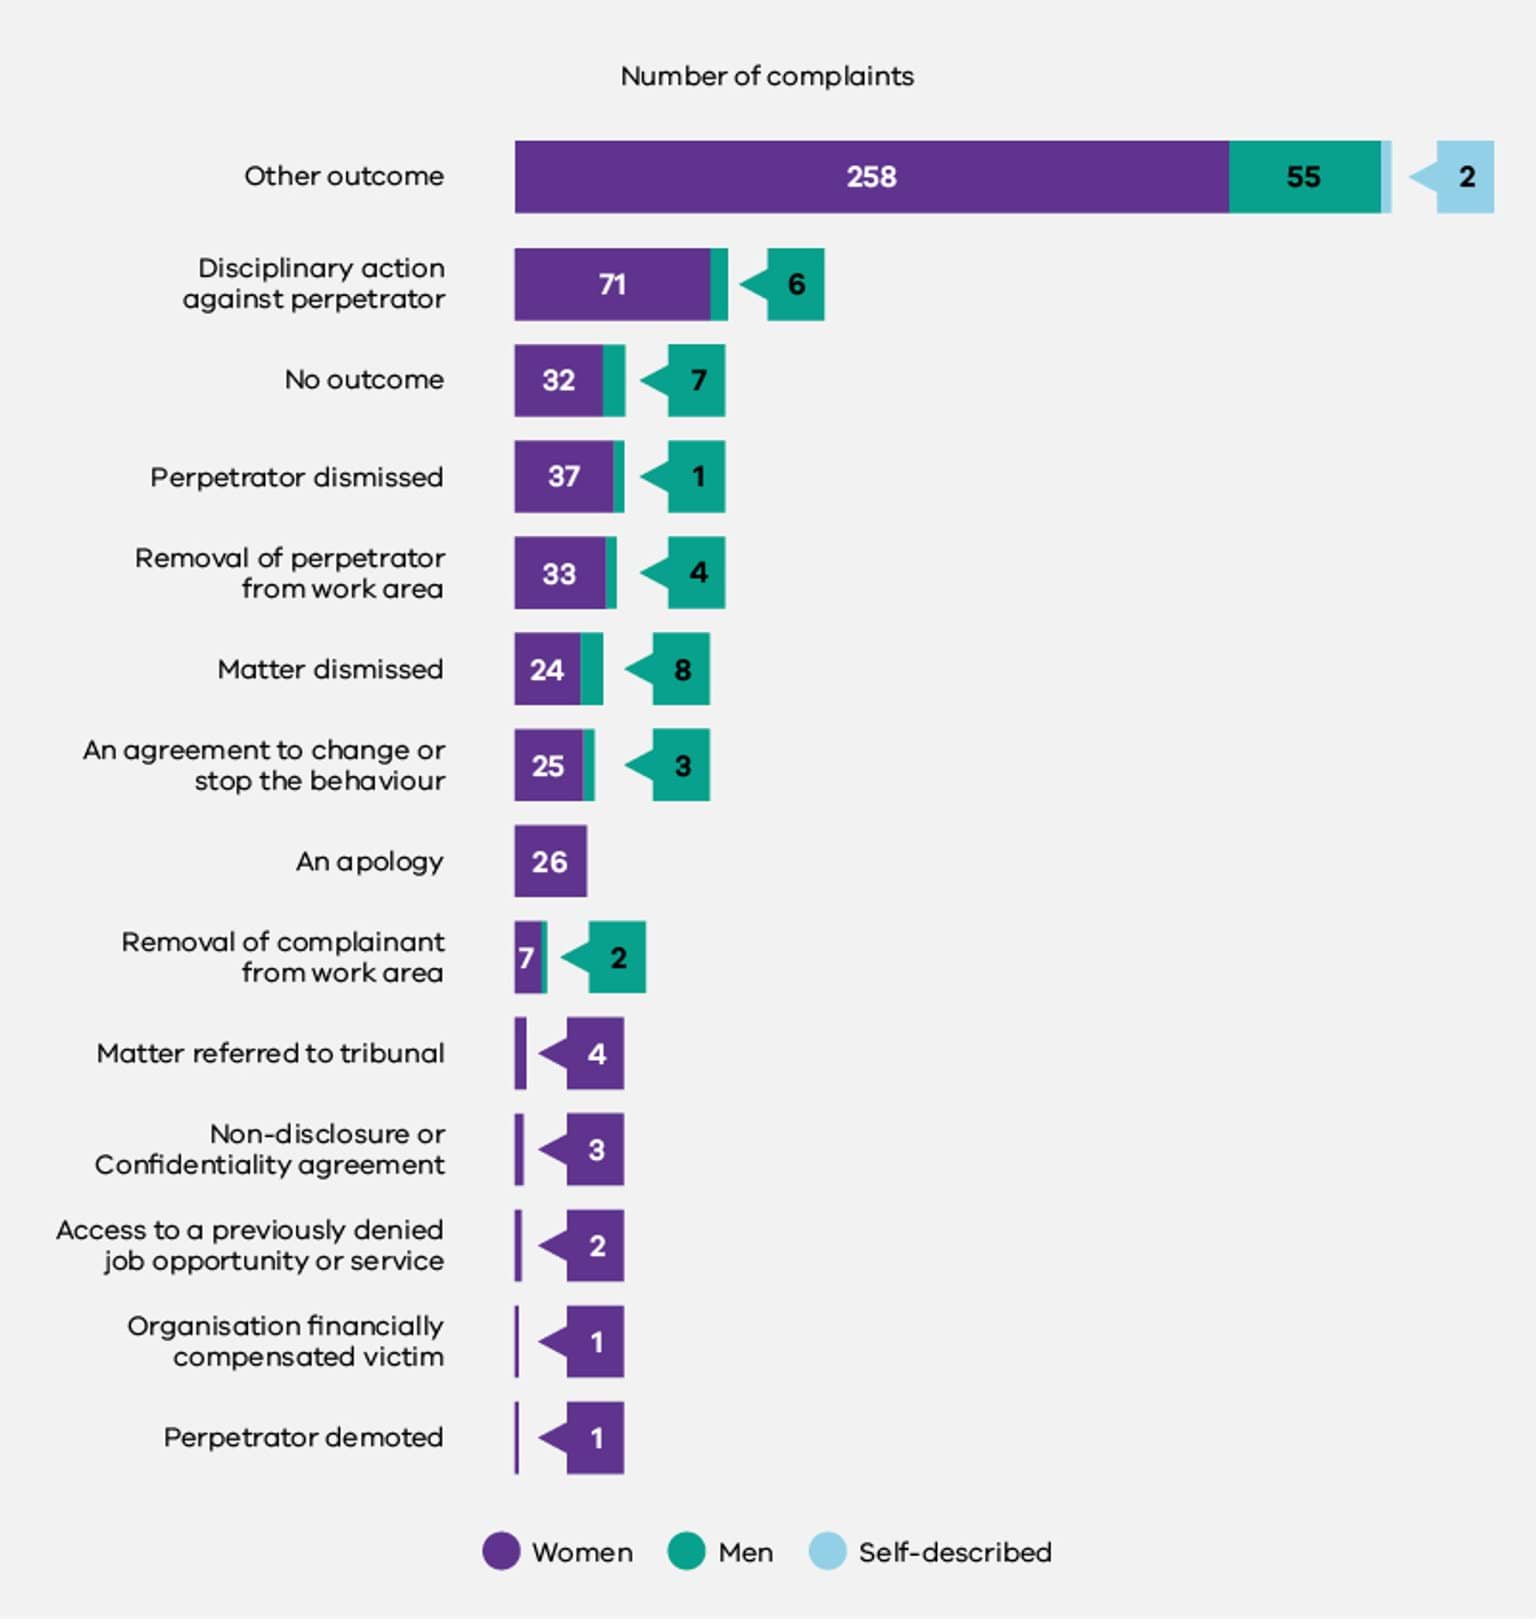
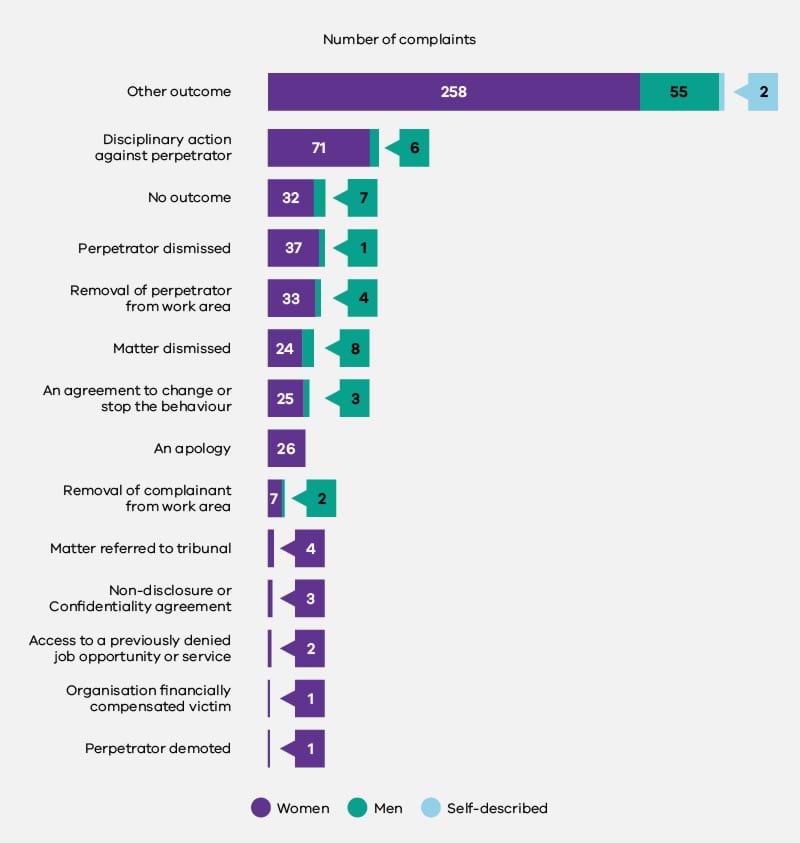
Only 50 organisations reported to the Commission regarding complainants’ satisfaction with the outcome of their formal sexual harassment complaint. Even amongst these organisations, many of the datasets were incomplete, with missing satisfaction ratings for nearly 1 in 3 complaints (41 out of 133 complaints). This may suggest irregular complainant follow-up processes but could also be affected by natural lags in data collection, as some complaints may not have been fully resolved at the close of the reporting period.
Amongst formal complaints where complainant satisfaction was known, about three-quarters of complainants were satisfied or very satisfied with the outcome of their complaint. One in 10 women who made a formal complaint was unsatisfied or very unsatisfied.
Fig 3.9. Complainant satisfaction with outcomes of formal sexual harassment complaints, by gender of complainant
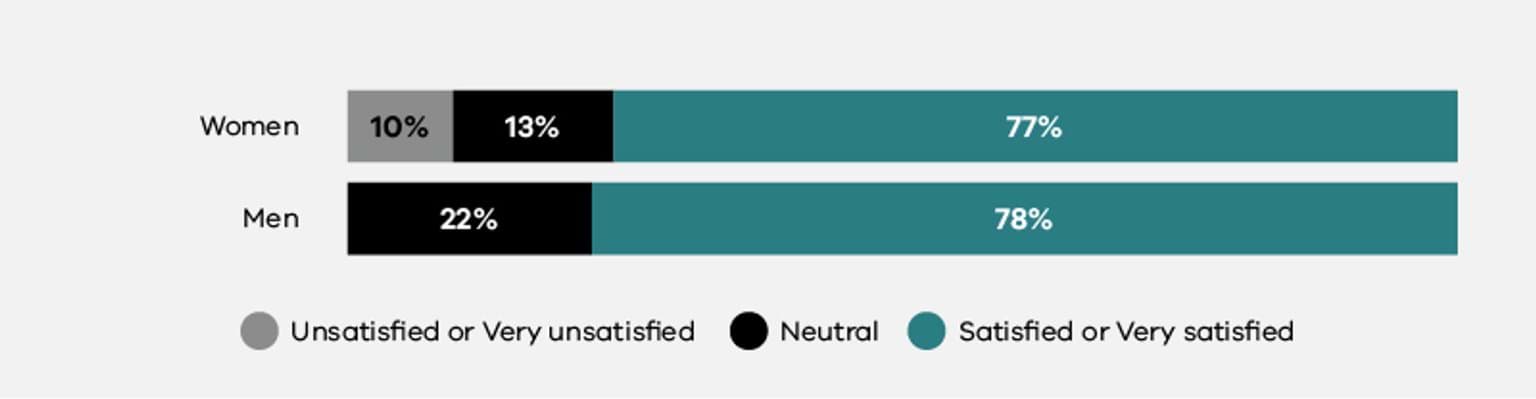
Organisations also had the opportunity to report on the actions they took to prevent future incidents of sexual harassment in the workplace. The Commission received this data from 158 organisations. The most common action was staff training, which was implemented by more than 80% of participating organisations.
Fig 3.10. Actions taken to prevent future incidents of sexual harassment in the workplace

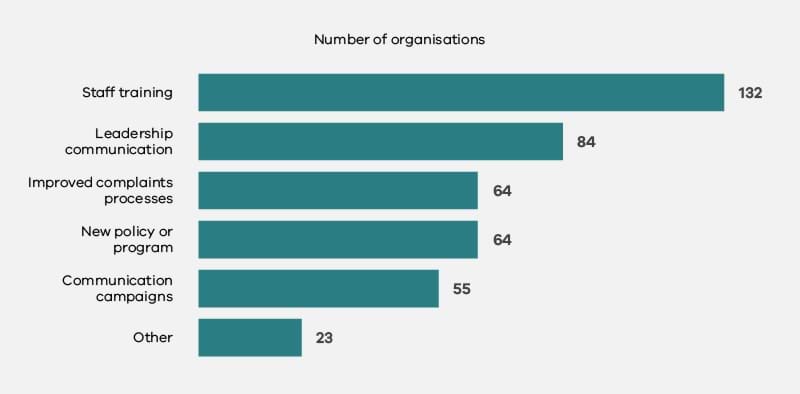
Discussion
The overall prevalence of workplace sexual harassment across defined entities (6% of women and 4% of men) was comparatively low. Australia-wide research conducted by the AHRC in 2018 showed that in the previous 12 months, 23% of women and 16% of men had experienced sexual harassment at work.134 The prevalence of sexual harassment across defined entities was also significantly lower than findings in particular Victorian workforces and industries. For example, in the Legal industry in 2019, 27% of women and 18% of men said they had experienced sexual harassment in the past 12 months.135 Similarly, in the Local Government industry group in 2020, a survey found that 30% of women and 25% of men had experienced workplace sexual harassment in the previous 12 months.136
It should be noted that the Commission’s data relates to a 12-month period in Victoria where large numbers of employees were required to work from home due to the COVID-19 pandemic. While it is possible that the lower rates of sexual harassment across defined entities reflect the decline in face-to-face interactions between co-workers during the pandemic, international research found there was an increase in gender-based harassment and sexual harassment during the pandemic.137 We also know that the pandemic has produced ‘new manifestations of unacceptable behaviours’ and made it more difficult for employers to detect, investigate and address sexual harassment in virtual spaces.138 Further investigation is required to understand these evolving dynamics. The rate of sexual harassment identified by the 2021 workplace gender audit is comparable to that in the NSW public sector. According to the 2021 NSW People Matter Employee Survey, 4% of respondents had experienced sexual harassment in the preceding 12 months – which included 4 months of pandemic-related lockdown.139 It is noted, however, that the NSW dataset does not include local councils or universities, so is not directly comparable to the current data.
Across all defined entities, only 4% of women and 3% of men who said they had experienced sexual harassment went on to file a formal complaint. Many respondents believed that formally reporting the incident would not make a difference (36% of women and 35% of men) or were concerned that reporting would have negative consequences for their career (29% of men and 18% of women). This may indicate a lack of trust in both the reporting and investigation processes in the relevant defined entities, as well as the support offered to victim-survivors to ensure they are not subject to victimisation after making a formal complaint.
Interestingly, however, while survey data showed that very few of those who experienced sexual harassment went on to make a formal complaint, workforce data showed high levels of satisfaction with formal complaint processes. Of those formal complaints where complainant satisfaction was known, about three-quarters of complainants were satisfied or very satisfied with the outcome. The workplace gender audit data shows that some defined entities are working to improve their sexual harassment prevention and response measures, through initiatives such as conducting staff training and improving complaints processes. Organisations’ Gender Equality Action Plans are also expected to detail more specific interventions to prevent and respond to sexual harassment.
The Commission anticipates an increase in reporting complaints of sexual harassment over the next two to three years as defined entities improve their organisational culture, awareness of sexual harassment and accountability mechanisms, as well as their policy and reporting structures.
The Commission’s data revealed that experiences of sexual harassment against women were more common in majority-men industries. In particular, the Transport industry group and Police and Emergency Services had the highest proportions of men in the workforce (75% and 64% respectively), and the greatest number of women who reported experiencing workplace sexual harassment (14% for Transport and 12% for Police and Emergency Services). These industry groups also had low representation of women in CEO positions140 – with women holding 17% of CEO roles in the Police and Emergency Services industry group and no CEO roles in the Transport industry group. In contrast, the Victorian Public Service had the second-highest proportion of women in the workforce (70%) and the lowest number of women who reported experiencing workplace sexual harassment (4%).
Perhaps unsurprisingly, in the industry groups that had the highest rates of sexual harassment against women (the Transport, Police and Emergency Services and University industry groups), there were fewer employees who felt safe to challenge inappropriate behaviour at work. For example, in the Police and Emergency Services industry group, only 55% of women and 66% of men felt safe to call out inappropriate behaviour. In the University industry group – which had the equal highest rate of sexual harassment against men at 7%, and the third highest rate of sexual harassment against women at 10% – only 49% of women and 61% of men felt safe to challenge inappropriate behaviour in the workplace.
Decades of research indicates that these trends are not unique to organisations reporting under the Act. Women working in majority-men industries have been found to be more likely to experience workplace sexual harassment than women in majority-women or gender-balanced environments.141 Breaking down forms of power that may be based on outdated, gendered understandings of hierarchy, as well as addressing any unequal distribution of power across genders, will assist organisations in creating an environment where sexual harassment is less likely to occur.142 It is also imperative that any systemic unequal distribution of power between genders is challenged. Working towards a more balanced representation of genders across all levels of an organisation and in all occupations can support this change.143
The Commission only received data relating to formal sexual harassment complaints from 186 organisations (less than two-thirds of organisations covered under the Act). Among those organisations that submitted information on formal reports of sexual harassment, there remained significant data gaps. These included a lack of data about the complainant’s relationship to the organisation, the outcomes of complaints, and complainants’ satisfaction with those outcomes. These data gaps are concerning, as research shows that comprehensive reporting and data collection systems are central to addressing workplace sexual harassment.144 The Commission will be issuing further guidance to defined entities to support improved practice in data collection and reporting on formal sexual harassment complaints.
Recommendations
It is crucial for organisations to collect, monitor and report on formal sexual harassment complaints data. This includes information regarding the nature of incidents, patterns emerging from those incidents, resolution time frames, outcomes and satisfaction of the parties to formal reports, as well as anonymous data on unreported sexual harassment experiences through employee experience surveys.
Collecting and analysing data regarding sexual harassment will help organisations understand and address the prevalence, nature, reporting, impacts of, and responses to, sexual harassment in the workplace.145 Leaders within organisations reporting under the Act must monitor incident rates closely to ensure their policy and program interventions are effective. Organisations should take steps to amend their GEAP strategies and measures if the rate of reported experience of sexual harassment (e.g. via an anonymous survey) does not decrease, and formal reporting of the experience of sexual harassment (i.e. the number of formal complaints made) does not increase in their organisation at a reasonable and material rate.
Monitoring the satisfaction of those reporting sexual harassment (complainants) can also help organisations understand where their policies and implementation can be improved.146 For defined entities, the regular workplace gender audit required under the Act supports these processes, but organisations should also consider undertaking a review of their data at least annually.147 It is also important to collect data on informal reporting processes – see Recommendation 3.2, below.
Collecting and analysing data on informal sexual harassment complaints, alongside formal complaints data, will assist defined entities to better understand the prevalence of sexual harassment in their workplace.148 This can also assist with a more nuanced analysis of sexual harassment complaints data.149
Defined entities should also collect, where possible, data on the reasons why employees chose to report a workplace sexual harassment incident informally, or chose not to continue with a formal complaint and investigation. This will assist them to assess the barriers to formal reporting within their organisation and the effectiveness of their informal complaint pathways.150
Individuals who may experience multiple, overlapping forms of disadvantage and discrimination can be particularly vulnerable to workplace sexual harassment.151 They may also feel less empowered to report sexual harassment, may experience compounding forms of discrimination and harassment, and their experiences may be less adequately reflected in organisational policy.152
Accurate data collection is therefore important to identify whether there are trends in your organisation with regards to sexual harassment and people with intersectional attributes. Collecting this data can help your organisation understand and respond to any patterns with regards to behaviour or other structural or systemic concerns contributing to the sexual harassment of people who experience multiple forms of discrimination. It can also help you ensure that your prevention and response framework is responsive to diverse needs.
In collecting, analysing and reporting on data about people who may experience compounding forms of inequality, organisations need to be sensitive to employee safety and privacy considerations and allow employees the discretion to self-identify.153
In addition to monitoring the effectiveness of complaints pathways, complaints handling, and support for victim-survivors, organisations should consider monitoring the impact of prevention efforts aimed at changing workplace culture.
To enable a workplace to understand whether they are moving towards a culture that is free from sexual harassment, organisations should consider collecting a holistic range of quantitative, qualitative and evaluation data including:
- evaluation data relating to programmatic efforts focused on:
- preventing sexual harassment in online environments
- supporting managers to develop safe team cultures free from sexual harassment
- generating more gender balance across occupations and in leadership
- feedback from all levels of the organisation about how prevention efforts can be improved.
Workplace gender audits completed under the Act will also support this data collection.
References
- Australian Human Rights Commission (AHRC), Everyone’s Business: Fourth National Survey on Sexual Harassment in Australian Workplaces, AHRC, 2018, accessed 22 June 2022.
- AHRC, Everyone’s Business.
- AHRC, Everyone’s Business.
- AHRC, Everyone’s Business.
- AHRC, Respect@Work: National Inquiry into Sexual Harassment in Australian Workplaces, AHRC, 2020, accessed 22 June 2022.
- AHRC, Respect@Work.
- AHRC, Everyone’s Business.
- AHRC, Everyone’s Business.
- AHRC, Everyone’s Business.
- Deloitte Access Economics, The economic costs of sexual harassment in the workplaceThe economic costs of sexual harassment in the workplace, Deloitte Access Economics, 2020, pp 27–37, 43-45, accessed 9 August 2022; AHRC, Respect@Work, p 273, 380.
- AHRC, Respect@Work, p 287–89.
- Deloitte Access Economics, The economic costs of sexual harassment.
- AHRC, Respect@Work, p 70.
- AHRC, Everyone’s Business, p 81-83.
- As outlined in the Introduction, the Commission will publish insights from intersectional data in a companion report on intersectionality, to be released in 2023.
- An employee experience survey item listed 13 types of sexual harassment and asked the respondent whether they experienced any of these behaviours at work in the prior 12 months. Because the employee experience results were reported as percentages of respondents within each organisation, the survey results have been weighted based on the size and gender composition of each defined entity to produce the estimates cited here.
- AHRC, Everyone’s Business, p 8.
- This category was particularly used in health organisations in regard to patient perpetration of sexual harassment. Outcomes listed included the use of duress alarms, reporting cases to police, heightened observation and supervision of patient/area, increasing staffing levels, reviews of procedures, and changes to patient management strategies.
- AHRC, Everyone’s Business, p 8.
- Victorian Legal Services Board + Commissioner (VLSB+C), Sexual Harassment in the Victorian Legal Sector: 2019 study of legal professionals and legal entities, accessed 9 August 2022 VLSB+C, 2020, p 18.
- Victorian Auditor-General’s Office (VAGO), Sexual Harassment in Local Government: December 2020, VAGO, 2020, p 29.
- Project Include, Remote work since COVID-19 is exacerbating harm: What companies need to know and do [PDF 536 KB] Project Include, March 2021, pp 8 -11, 55, accessed 9 August 2022; Rights of Women, Right of Women survey reveals online sexual harassment has increased, as women continue to suffer sexual harassment whilst working through the COVID-19 pandemic, Rights of Women, 11 January 2021, accessed 9 August 2022; E Tiry et al, The New World of Work: Principles and Practices for Addressing Harassment The Purple Campaign, June 2021, pp 2-3, accessed 9 August 2022.
- A Orifici, ‘Under the cloak of COVID-19: How the pandemic affects workplace investigations’ Impact, Monash Business School, 24 June 2020, accessed 26 July 2022.
- NSW Public Service Commission, People Matter Employee Survey 2021, Sector Report – NSW Public Sector, p 34, accessed 25 July 2022.
- Finance and Insurance were tied with Police and Emergency Services (17% women CEOs).
- M Foley et al., ‘”I’ll never be one of the boys”: Gender harassment of women working as pilots and automotive tradespeople’ Gender, Work, Organization, 2020, pp 1-16, DOI: 10.1111/gwao.12443, p 3. It is also worth noting that in these environments, some forms of harassment may not be overtly sexual, but may be subtle (though no less serious) and targeted at individuals or groups because of their gender. Sometimes labelled ‘everyday sexism’, gender-based harassment of this nature reflects outdated societal attitudes towards women and is both a consequence and cause of power imbalances. Foley et al., ‘”I’ll never be one of the boys”’, p 4. See also, F Wilson and P Thompson, ‘Sexual harassment as an exercise of power’, Gender, Work and Organization, 2001, 8(1): p 61–83, DOI: 10.1111/1468-0432.00122.
- Sojo et al., ‘What works, what’s fair?’.
- South Australian Equal Opportunity Commission, 2016, ‘Sex discrimination, sexual harassment and predatory behaviour in South Australia Police: Independent reviewSouth Australian Equal Opportunity Commission, 2016; Sojo et al., ‘What works, what’s fair?’.
- Sojo et al., ‘What works, what’s fair?’.
- Sojo et al., ‘What works, what’s fair?’; AHRC, Respect@Work.
- South Australian Equal Opportunity Commission, Sex discrimination, sexual harassment and predatory behaviour.
- It is vital that defined entities have appropriate and tailored reporting mechanisms and a culture where people feel safe to report. Reporting mechanisms should be developed in consultation with victim-survivors and relevant experts to enable organisations to respond swiftly and appropriately when a complaint is made, as well as to create an environment of trust and safety. Similarly, it is important that organisations covered by the Act have adequate supports in place for victim-survivors across all aspects of the reporting process, as well as for those who witness or receive disclosures of harassment.
- VAGO, Sexual Harassment in the Victorian Public Service, 2019, pp 12, 22, 25, accessed 9 August 2022; AHRC, Respect@Work, p 716.
- AHRC, Respect@Work, p 716; US Equal Employment Opportunity Commission (EEOC), Select Task Force on the Study of Harassment in the Workplace, EEOC, June 2016, p 36, accessed 9 August 2022..
- VAGO, Sexual Harassment in the Victorian Public Service, p 25.
- PE Villegas (2019) ‘“I made myself small like a cat and ran away”: workplace sexual harassment, precarious immigration status and legal violence’, Journal of Gender Studies, 2019, 28(6): pp. 674-686, doi: 10.1080/09589236.2019.1604326.
- Sojo et al., What works, what’s fair?.
- Commission for Gender Equality in the Public Sector (CGEPS), How do I maintain my employees’ privacy?, CGEPS website, 2021, accessed 26 July 2022.
Special look: Women in leadership
This chapter provides a special look at the data for women in leadership positions across organisations reporting under the Act.
Introduction
Women are underrepresented in key leadership roles across almost all industries in the Australian workforce and recent studies suggest that we will not see an equal share of women in CEO positions until the turn of next century, 78 years from now.154 This was reflected in the current workplace audit data, demonstrating that the ‘glass ceiling’ is still largely intact for women seeking access to the most senior levels of public sector leadership.
Despite clear evidence that having women in decision-making roles delivers better performance, profitability, and productivity, persistent gendered norms and assumptions (such as the association of leadership traits with men and masculinity) and structural barriers (such as inflexible working arrangements) limit women’s representation in leadership.155
What was found: Key data snapshot
Women made up 66% of the workforce of defined entities, but only 46% of senior leadership roles.
- Women were underrepresented in senior leadership across two-thirds of defined entity industry groups.
- This is consistent with data from NSW, where women make up over 65% of the public sector workforce, and only 40% of senior executive level roles.156
Women were most underrepresented in leadership positions in the Victorian Public Service and Local Government industry groups.
- There was a 24% discrepancy in each of these industry groups, with women making up 70% of the VPS workforce but only 46% of senior leadership positions, and 63% of the local government workforce but only 39% of senior leadership positions.
- This is followed by the Finance and Insurance and Public Health Care industry groups, where there were discrepancies of 21% and 20%, respectively.
Men outnumbered women in CEO (or equivalent) roles in 83% of industry groups.
- Women were most likely to hold CEO positions within the Arts, Other, Public Health Care and Victorian Public Service industry groups, and least likely to hold CEO positions within the Transport, Finance and Insurance, Police and Emergency Services and Sport and Recreation industry groups.
There was a median base salary gender pay gap in favour of men at the senior leadership level in 9 out of 12 industry groups.
- The gender pay gap in favour of men was widest in the Police and Emergency Services (18.8%), Public Health Care (16.1%), Other (14.8%) and Universities (11.5%) industry groups.
- There was a gender pay gap in favour of women in 2 out of the 12 industry groups: Arts (9.3%) and TAFE and Other Education (3%).
- There was no gender pay gap at the senior leadership level in the Victorian Public Service.
More than 3 in 5 CEOs (or equivalent) were men.
- 61% of CEO positions were held by men, 38% by women, and 0.4% by people of self-described gender.
There was a median base salary gender pay gap in favour of women at the CEO level in 6 out of 8 industry groups.157
- The gender pay gap in favour of women was widest in the Arts (46.3%), TAFE and Other Education (31.6%) and Water and Land Management (18.4%) industry groups.
- There was a gender pay gap in favour of men in 2 out of the 8 industry groups: Sport and Recreation (25.9%) and Victorian Public Service (20.5%).
Across all defined entities, there were a very small number of people of self-described gender in senior leadership roles.
- This is evidence of the barriers people of self-described gender face in their career progression, which could equally be driven by lack of data.
- Organisations are still building their capacity to collect gender identity data and the public sector as a whole is working to build cultural safety to allow greater gender-identity reporting.
The representation of women in leadership declined with role seniority.
- Women made up 66% of workforce of defined entities, but only 46% of senior leadership roles, and 38% of CEO-level positions.
- These discrepancies were greater in some industries. For example, women made up 61% of the Finance and Insurance industry workforce, but held only 40% of senior leadership positions, and 17% of CEO (or equivalent) positions.
- This is similar to the experience of women in the private sector, where they comprised 51% of the total Australian workforce, 34.5% of key management personnel, and 19% of CEOs.158
As this is the first time that organisations have reported women in leadership data to the Commission, there are limitations in the ability to report on the intersectional breakdown of women in leadership. The Commission will work closely with organisations over the coming years to enhance reporting on these important aspects of this indicator.
Special look: Women in leadership (infographic)
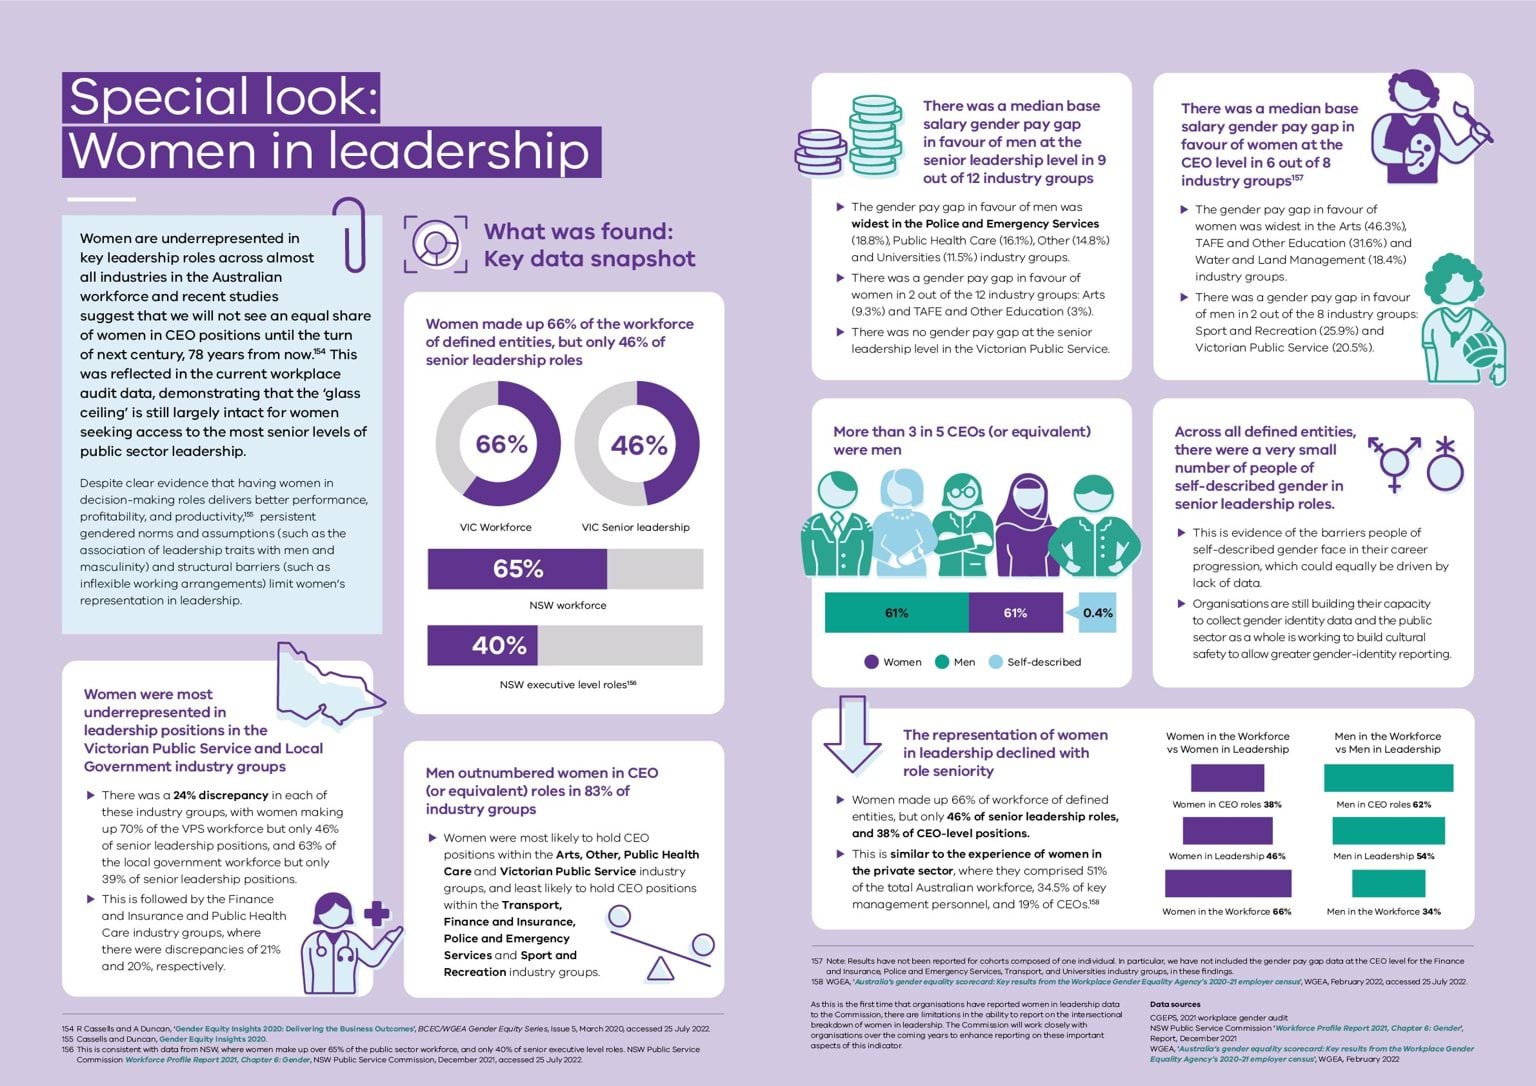
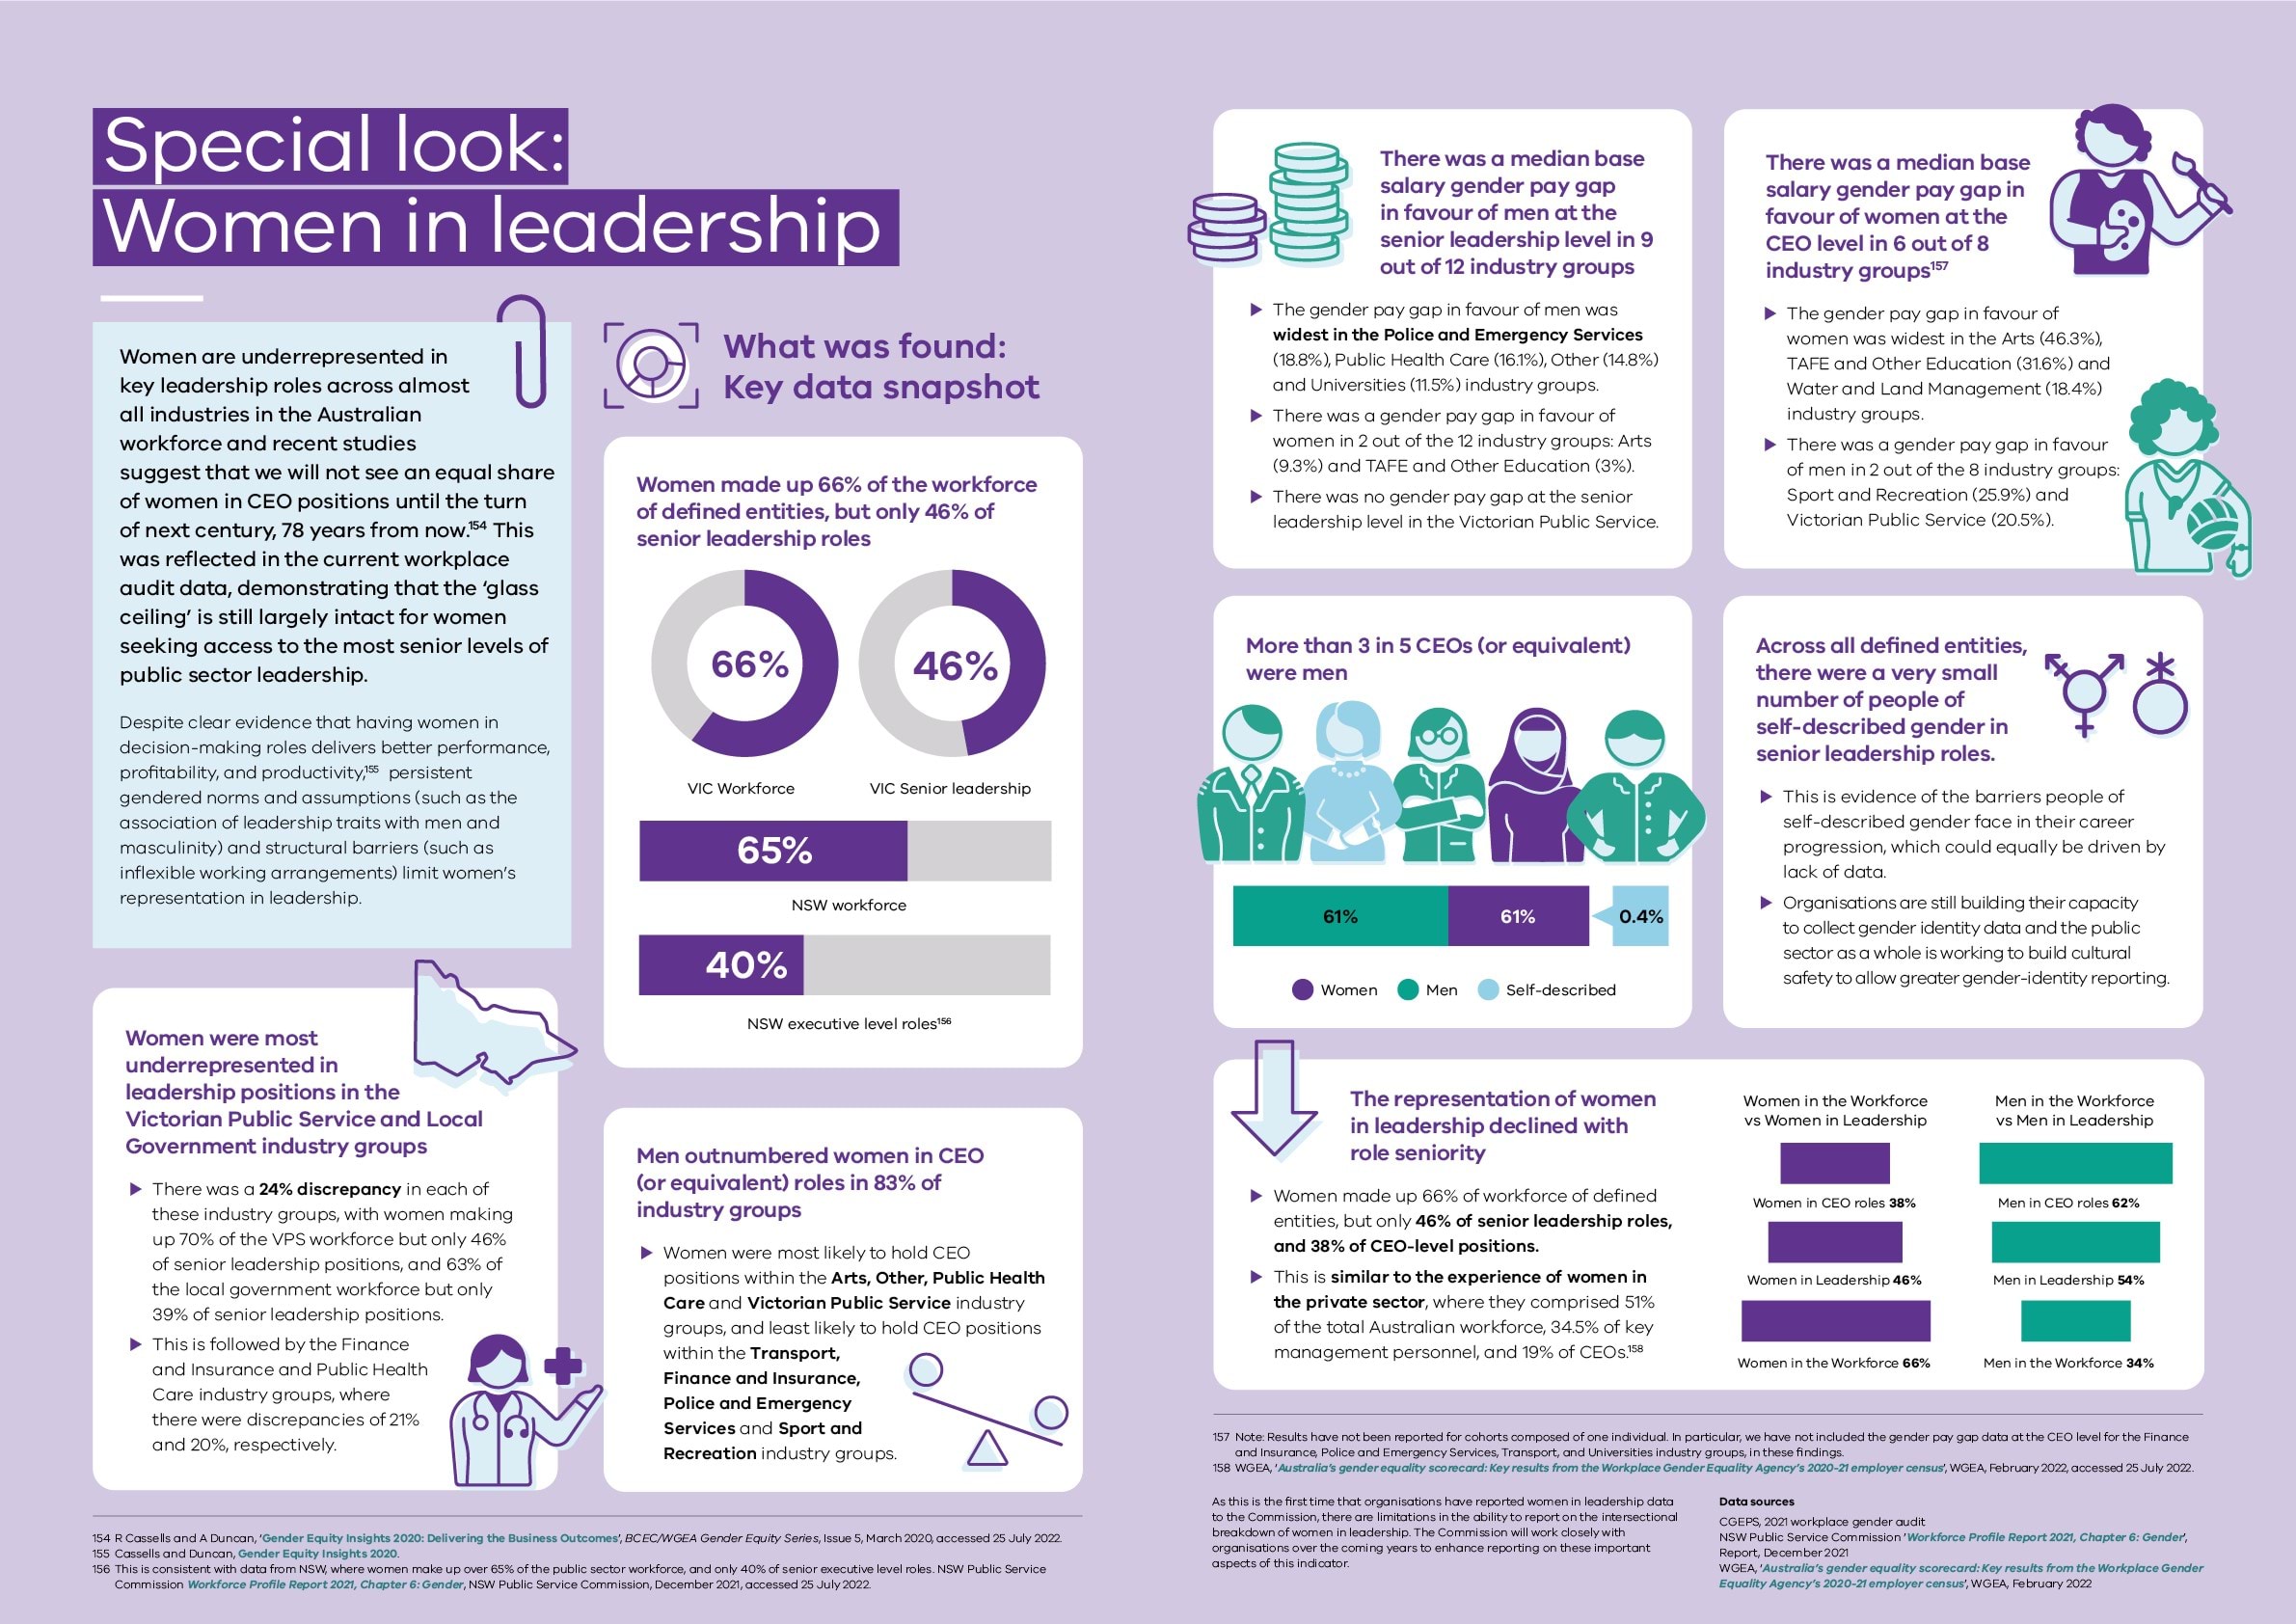
References
- R Cassells and A Duncan, ‘Gender Equity Insights 2020: Delivering the Business Outcomes’, BCEC/WGEA Gender Equity Series, Issue 5, March 2020, accessed 25 July 2022.
- Cassells and Duncan, Gender Equity Insights 2020.
- NSW Public Service Commission Workforce Profile Report 2021, Chapter 6: Gender, NSW Public Service Commission, December 2021, accessed 25 July 2022.
- Note: Results have not been reported for cohorts composed of one individual. In particular, we have not included the gender pay gap data at the CEO level for the Finance and Insurance, Police and Emergency Services, Transport, and Universities industry groups, in these findings.
- WGEA, Australia’s gender equality scorecard: Key results from the Workplace Gender Equality Agency’s 2020-21 employer census [PDF 1.00 MB], WGEA, February 2022, accessed 25 July 2022.
Recruitment and promotion practices
This chapter looks at the data for the gender equality indicator ‘recruitment and promotion practices in the workplace’.
Introduction
Gender bias can permeate every aspect of the recruitment and promotion lifecycle. Gendered language and imagery in job advertisements influence potential applicants, and unconscious and conscious bias and gendered stereotyping influence shortlisting, interviewing, hiring, salary and promotion decisions, as well as talent identification and performance and development discussions, programs, and opportunities.159
Gender-equitable recruitment and promotion practices are integral to achieving gender equality.160 Ensuring the recruitment, development, and promotion of a diverse workforce will ensure the organisations reporting under the Act are more representative of, and better equipped to serve, the diverse Victorian community. This will also enable the sector to model fair, flexible, and opportunity-filled career paths for people of all genders.
Key issues: Why was this measured?
Discrimination in recruitment and selection processes is pervasive
Gender-coded language and imagery in job advertisements can filter people into different occupations or industries.162
Conscious and unconscious bias in the processing of candidates’ information can lead to sub-optimal personnel decisions and discrimination among evaluators.163 Research has also shown that the CVs of women as well as minority groups are often unwarrantedly screened out in recruitment processes, particularly when these groups are underrepresented in specific industries or occupations.164
Compared to similarly qualified men, women receive fewer interview invitations, are perceived as less ‘hireable’ during recruitment and less ‘likeable’ when negotiating their salary, and are assumed to have lower levels of career motivation, therefore receiving fewer challenging work projects and development opportunities.165 As an example, research has found that women are more likely to leave STEMM careers compared to men due to the lack of mentoring and networks, as well as discrimination by managers and colleagues impacting on their career development opportunities.166
Intersectionality compounds gender discrimination
In a recent workplace survey conducted by Women of Colour Australia almost 60% of respondents reported that they had faced discrimination related to their identity as a woman of colour, including being passed over for promotion and having their ‘cultural fit’ raised as a reason they were less likely to be hired for the role.167
Similarly, women with disability report that they are not afforded the same employment and development opportunities as people without disability and are often disadvantaged by inaccessible recruitment practices and employer misconceptions about the cost of workplace modifications, equipment and concerns about additional human resources work.168
Recent research has found that Aboriginal and Torres Strait Islander women are likely to be assigned or accept heavier unpaid cultural workloads (for example, by advising on Indigenous issues, initiatives, or content) than Aboriginal and Torres Strait Islander men.169 Mainstream research has found that additional and unpaid work assignments can be undervalued in comparison to traditional workloads and therefore form a contributing factor to slower promotion of women than men.170
Women also face growing barriers as they age, with research finding women are subject to negative age stereotypes about ‘employability’ from a younger age than men.171
Discrimination is a key driver of the gender pay gap
Discrimination in recruitment, salary negotiation, promotion and other development opportunities compounds across women’s careers and drives other forms of workplace gender inequality. For example, gender discrimination is the most significant driver of the gender pay gap172 and therefore impacts women’s economic security, as well as the overrepresentation of women in lower-level positions, as explored in the Equal pay and Workforce gender composition and segregation chapters of this report, respectively.173
Data on recruitment and promotion outcomes can reveal inequalities across the employment cycle within an organisation and help identify strategies to create more equal opportunities.
How was this indicator measured?
Organisations covered by the Act were asked to provide gender-disaggregated data on measures of recruitment and career progression over the period from 1 July 2020 to 30 June 2021.
The Commission used this data to calculate the proportion of men, women and gender diverse people in total recruitments, exits, promotions and career development opportunity uptake (including training, higher duties and internal secondments), disaggregated by employment basis and intersectional attributes.
In addition, employees of defined entities were invited to participate in a standardised employee experience survey. Organisations were surveyed separately, and the results were reported to the Commission as percentages of respondents. Items with fewer than 10 responses were suppressed to protect respondents’ privacy.
The Commission used this data to understand employee views about levels of support for diversity and inclusion, barriers to their success in the organisation, adequacy of learning and development opportunities, and fairness of organisational recruitment and promotion practices.
For the first time under Australian gender equality reporting legislation, organisations covered by the Act were required to provide data disaggregated not only by gender, but across a range of attributes. As outlined in the Introduction, we will publish insights from this intersectional data in our companion report on intersectionality, to be released in 2023.
Further detail about how each measure was defined can be found in the glossary at the end of this report.
What was found: Key data insights
Recruitments and exits by gender
Recruitments and exits across organisations covered under the Act closely matched the gender balance of the workforce.
Between 1 July 2020 to 30 June 2021, the proportion of staff that were recruited to work in, or that exited, organisations covered by the Act closely matched the gender balance of the workforce. Women made up 66% of the overall workforce and comprised 66% of recruitments and 64% of exits. People of self-described gender comprised a larger portion of recruitments (0.3%) compared to their proportion of the workforce (0.1%) and exits (0.1%).
Fig 4.1 Overall workforce, recruitments and exits, by gender

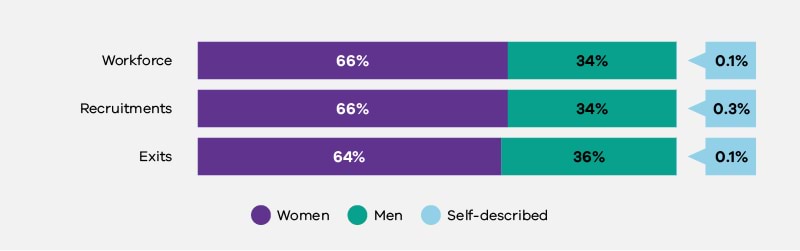
Recruitments and exits closely matched the gender balance of the workforce in most industry groups, as can be seen in Figure 4.2, below. The Transport industry group was the most significant exception, with women comprising only 25% of the workforce, but 43% of new recruits and 31% of exits.174
Some industries such as Transport, and Police and Emergency Services also experienced a higher proportion of men exiting organisations, relative to the number of men recruited over the same period. However, both the Transport and Emergency Services industries remain majority-men in composition.
Fig 4.2 Workforce, recruitments and exits, by industry and gender
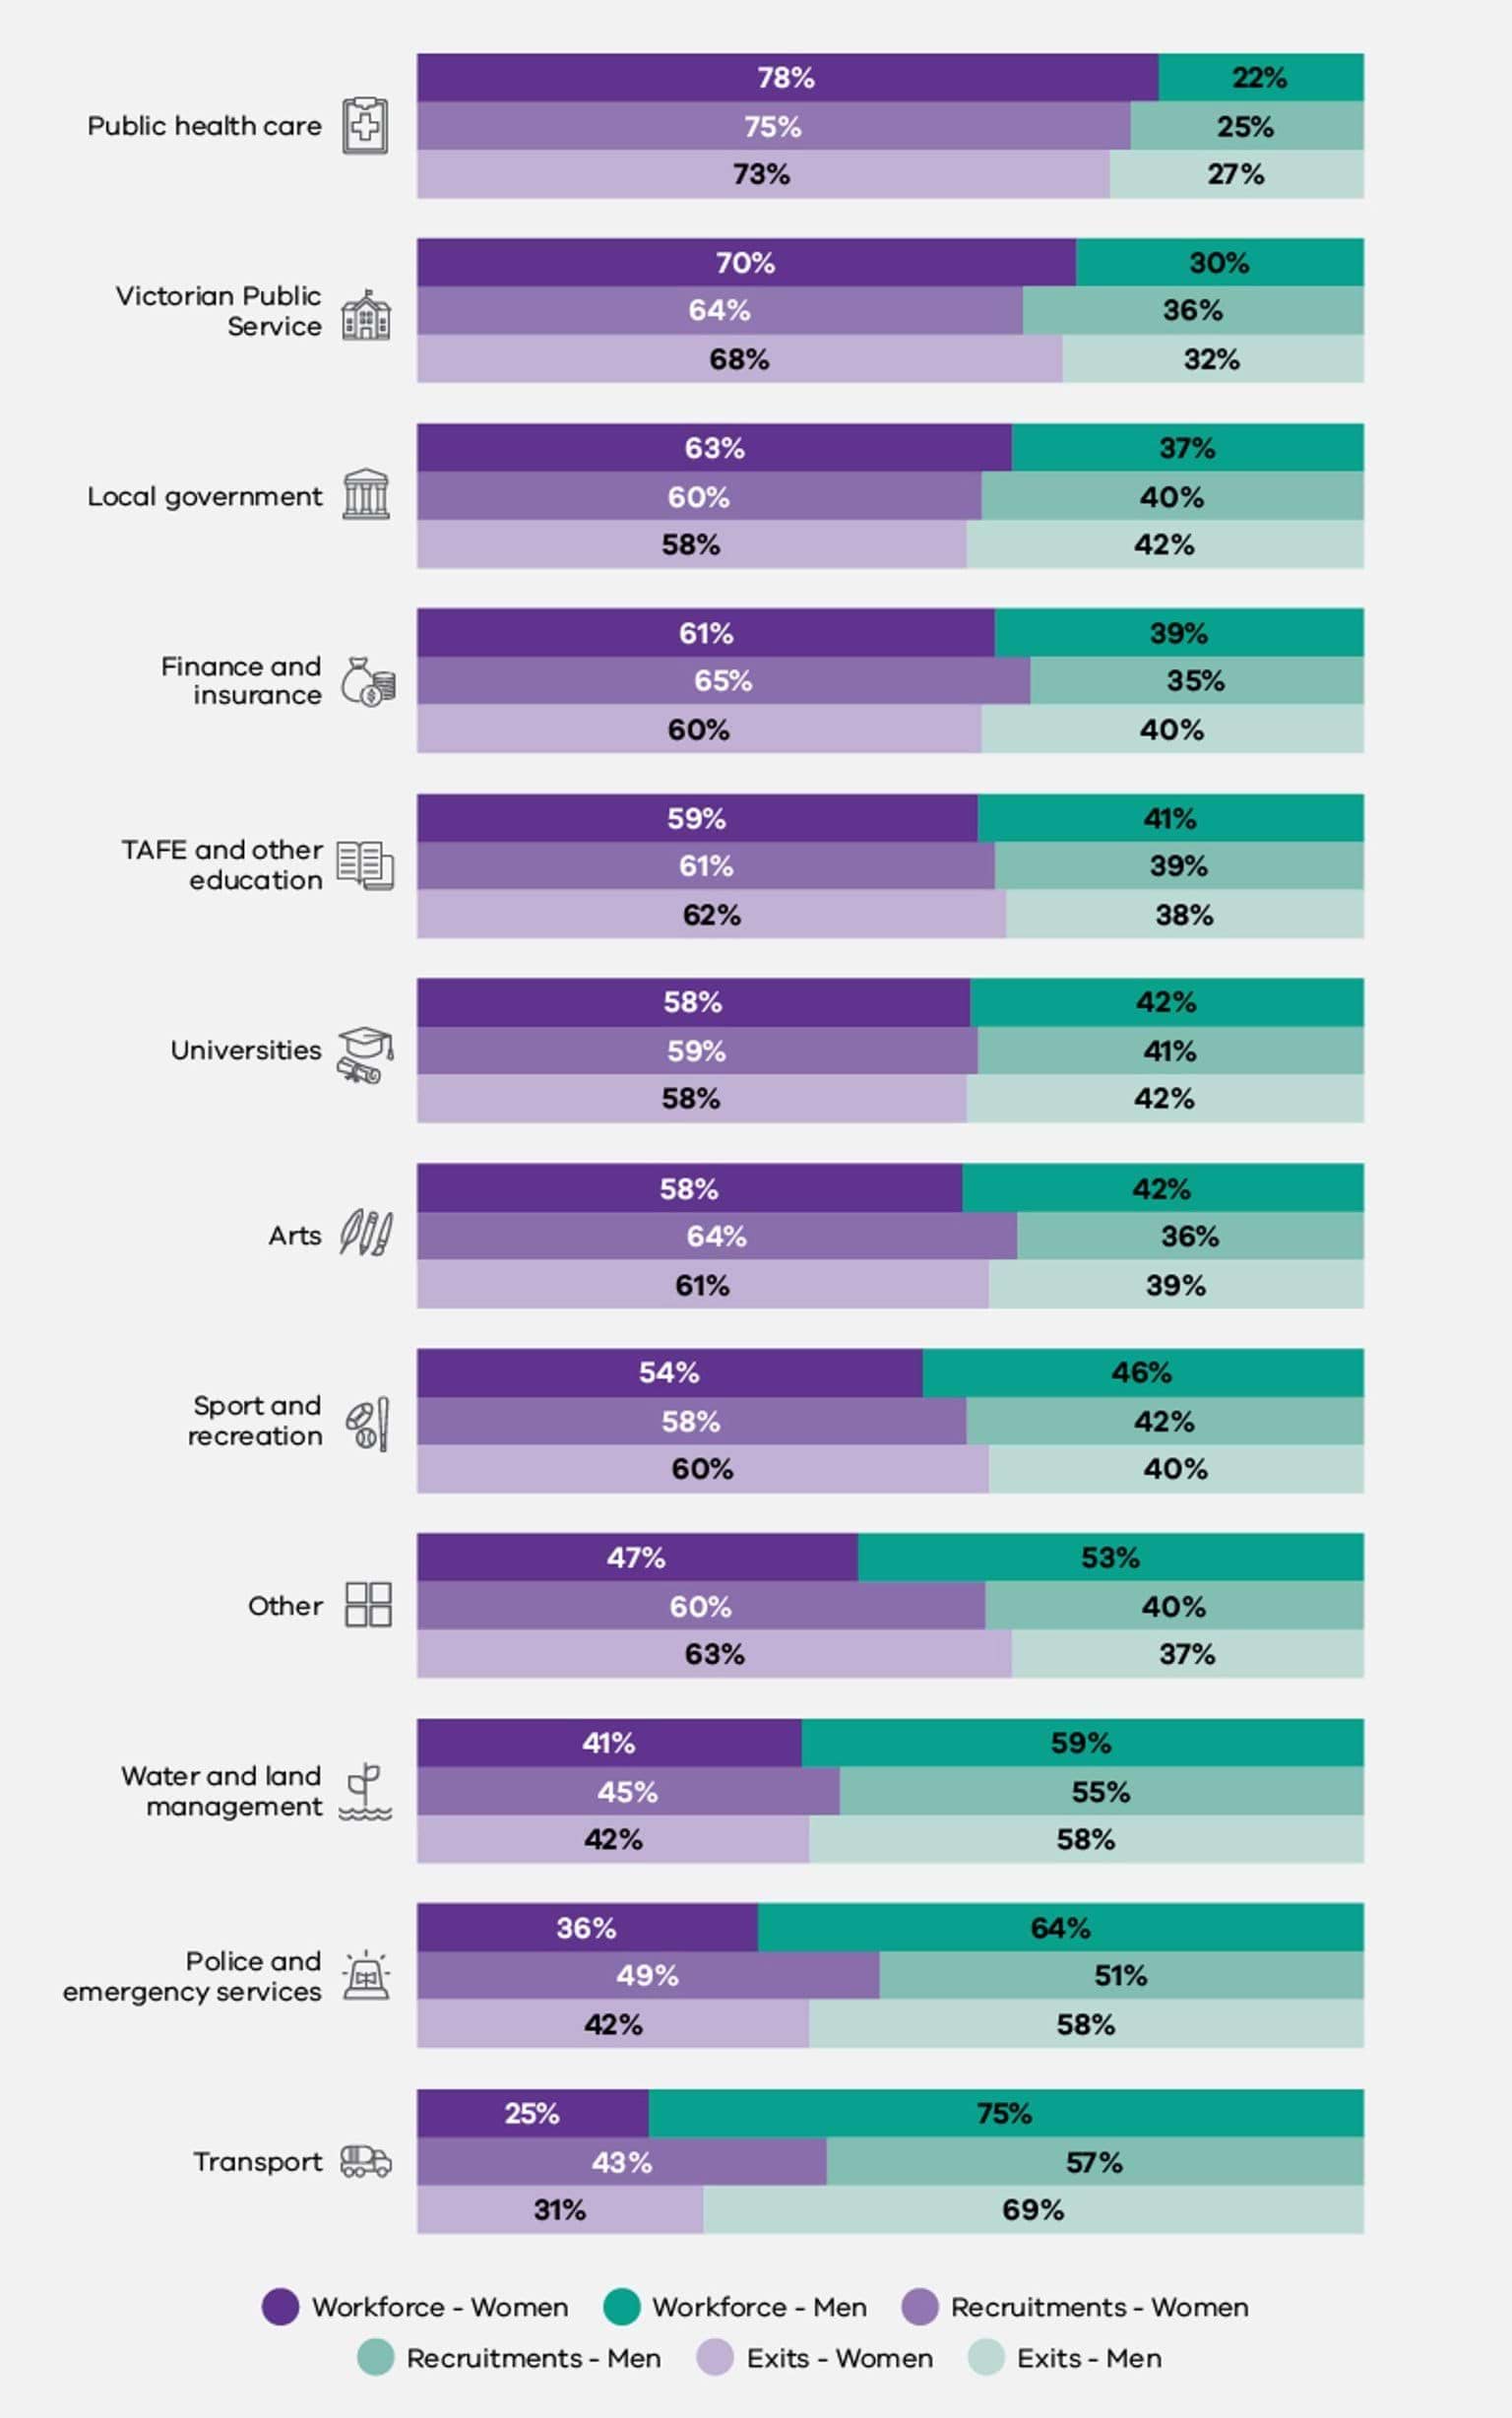
Career development opportunities by gender
Despite making up 66% of the workforce across all defined entities, women comprised only 62% of those staff accessing career development training opportunities and only 58% of those awarded internal secondments. While men comprised 34% of the overall workforce, they made up 38% of those staff accessing career development training opportunities and 42% of those staff awarded internal secondments. People of self-described gender comprised 0.1% of people who accessed career development training and 0.1% of people who were awarded higher duties across all defined entities, which was comparable to their proportion of the total workforce.
This imbalance remained when it came to the proportion of staff awarded higher duties. Though they comprised 66% of the workforce across all defined entities, women comprised only 59% of staff awarded higher duties assignments and only 63% of those who received promotions. Whereas men comprised only 34% of the overall workforce, they were awarded 41% of higher duties awards and comprised 37% of those who received promotions.
Research from the US and the UK suggest this imbalance is not unique to the Commission’s data set. In the US, the Yale Insights 2021 study found that women are 14% less likely to be promoted each year.175 Similarly, McKinsey found that only 79 women are promoted to manager for every 100 men,176 and a UK study, found only 27.8% of women were promoted in the 3 years after childbirth, compared to 90% of new fathers.177
Fig 4.3 Workforce and career advancement measures, by gender

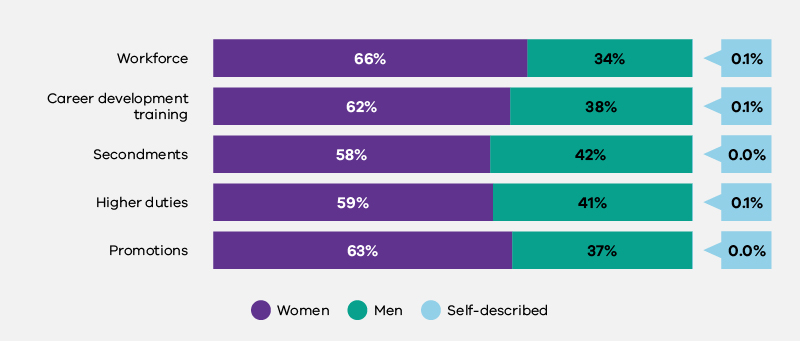
Views on recruitment and promotion by gender
Among survey respondents, the responses from women and men in relation to recruitment and promotion practices were similar:
- nearly three-quarters of women and men felt that gender was not a barrier to success in their organisation
- more than half of women and men said there were adequate opportunities to develop skills and experience at work
- more than half of women and men agreed that their organisation makes fair recruitment and promotion decisions, based on merit
- just under half of women and men felt they had an equal chance at promotion in their organisation.
Fig 4.4. Survey participant perceptions of recruitment and promotion practices, by gender
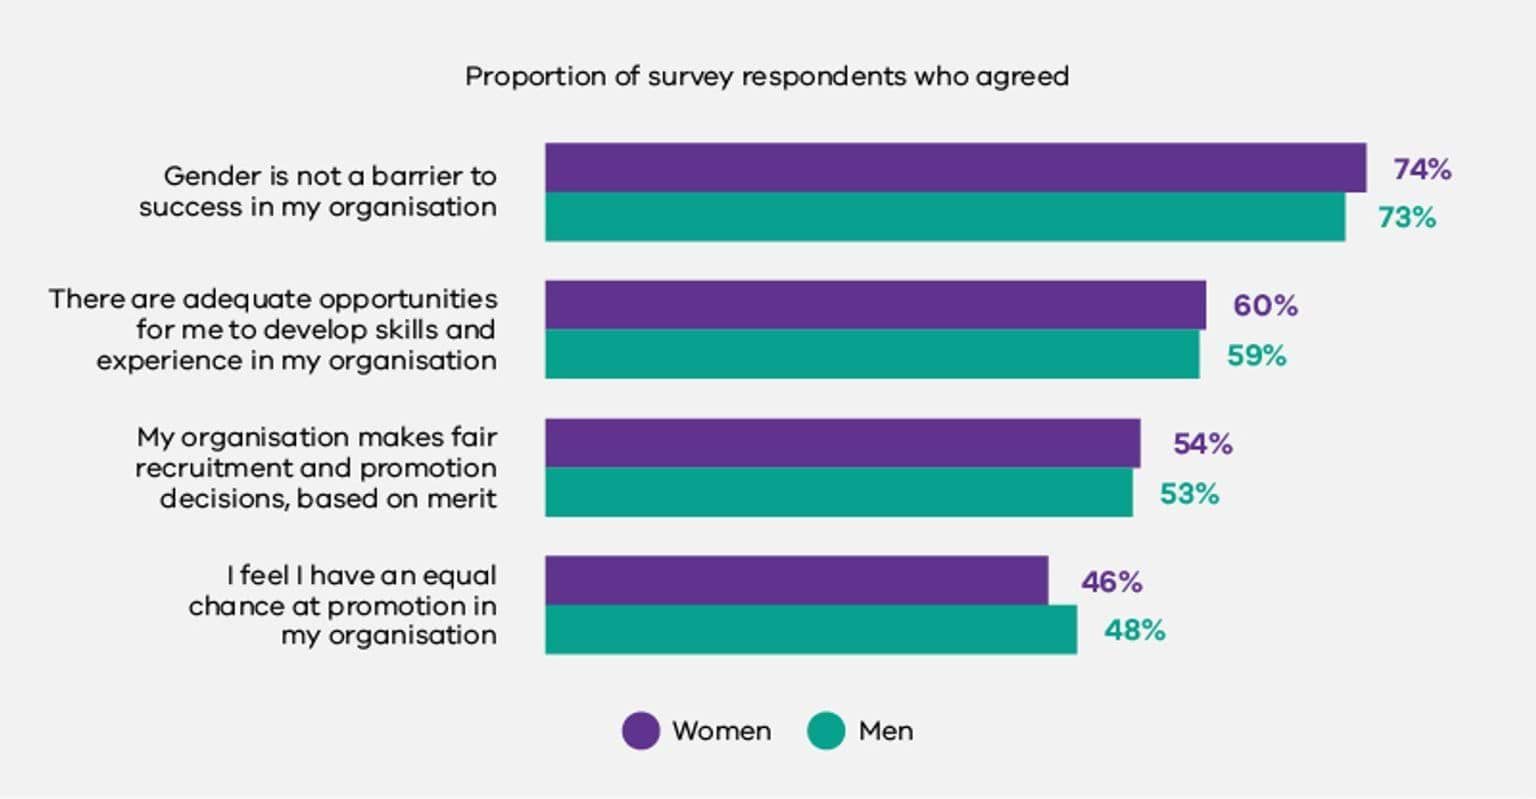
Discussion
Career progression is predicated on, among other things, ‘cumulative skill development’ and equal access to development opportunities – this means that when women are excluded from training opportunities, secondments and higher duties they experience vertical segregation in a workforce.178
The Commission’s audit data reveals that, while women were over-represented in the defined entity workforce as a whole (as explored in the Workforce gender composition and segregation chapter), they were under-represented in terms of access to career development opportunities. Further, men were disproportionately represented in higher-paying industries, occupations, and leadership classifications.
Each of these skewed distributions is influenced by inequalities in recruitment, promotion and career development processes and decision-making. For example, the Commission’s data revealed that women comprised only 45% of senior leadership roles and 38% of CEO roles across all defined entities, despite making up 66% of the workforce as a whole (see the Workforce gender composition and segregation chapter).
Women were also over-represented in Clerical and Administrative and Community and Personal Service Worker roles across defined entities. Not only did these occupations have the lowest median base salaries (aside from the Labourers occupation), but also had gender pay gaps in favour of men (see Figure 2.4 in the Equal pay chapter).
Women in defined entities were more than twice as likely than men to work in part-time roles across defined entities, while more than three‑quarters of those using flexible work arrangements were women (see Figure 1.2 in the Workforce gender composition and segregation chapter, and Figure 5.2 in the Leave and flexible work chapter).
Research shows that people in support roles (such as those in the Clerical and Administrative occupation group) tend to have decreased career enhancement, and that people working in flexible roles are more often overlooked for career development opportunities, such as training, promotion, and important meetings.179
Employee experience data analysed by the Commission demonstrated women in defined entities lacked confidence in their organisation’s recruitment and promotion processes. Only 46% of women respondents across defined entities felt like they had an equal chance of promotion in their organisation, while only 54% felt their organisation made recruitment and promotion decisions based on merit.
Merit and its attribution, however, are structured along perceived gender lines. Many organisations consider themselves to have ‘merit-based’ employment practices, whereby they employ and promote candidates based on their individual skills, traits, and qualifications, irrespective of gender or other attributes.
However, research commissioned by WGEA demonstrated that cultural assumptions and stereotypes can sway managers’ recruitment, selection, and promotion decisions.180 Research indicates that managers in organisations that explicitly claim to be meritocratic are more likely to exhibit gender biases in favour of men over equally qualified women.181
While it can be challenging for organisations to monitor the impact of a range of variables on individuals’ progression over the mid- to long-term, this information is crucial to ensuring organisations can track the impact of their interventions over time. Addressing unconscious bias and systemic discrimination in recruitment and promotion practices is key to achieving workplace gender equality.
As explained above, research indicates that employees from diverse backgrounds are more likely to experience discrimination and disadvantage at every stage of the employment cycle. This includes non-binary, gender-diverse and transgender employees and employees with intersectional attributes.182
For example, in Australia, the first national transgender mental health study in 2013 revealed that respondents had difficulty securing employment and faced discrimination in their workplace due to their transgender identity.183 In Canada, a survey of transgender individuals found that 18% of respondents had been denied a position because they were transgender and 13% had been dismissed from a role for being transgender.184
Similar results have been found in the UK and Ireland, where 35% of respondents believed they had not been hired for a position and further 19% experienced workplace harassment and discrimination at work because of their transgender identity.185 In the US, 67% of respondents to the 2015 US Transgender Survey who had applied for a position in the previous year reported not being hired, denied a promotion, or dismissed (constructively or expressly) as a result of their transgender identity.186
The Commission requested that defined entities submit a broad range of intersectional data in this first workplace gender audit cycle. This included data in relation to recruitment, retention and promotion for gender-diverse people, as well as people with a range of other intersectional attributes. Due to a number of factors – including that many defined entities currently lack system configurations that enable collection of this data – there remain significant data gaps in this area.
Workforce gender audit data reveals that 0.1% of people who accessed career development training and 0.1% of people who were awarded higher duties across all defined entities were people of self-described gender.
In future years and following release of the Commission’s findings and recommendations on intersectionality in 2023, defined entities will be able to develop their capacity to provide more complete data in relation to intersectional gender inequality in recruitment, promotion, and career development opportunities.
Recommendations
Organisations that are leading on gender equality recognise that their recruitment and selection strategies must be accompanied by regular and consistent monitoring and evaluation processes. This is important to establish the level of progress against their goals for more gender-equal recruitment and selection.187
In these leading practice organisations, monitoring and evaluation of performance on gender equality outcomes is considered throughout the recruitment, selection and onboarding processes for new employees.188 Data is then used to help inform and guide actions if inequalities are identified.189
Some organisations have also begun to extend their evaluation into career development processes, such as promotions and performance and development reviews. Metrics that support these evaluation processes include data related to development opportunities, allocation and distribution of higher duties, and approvals for professional development leave.190
Data collected as part of the 2021 workplace gender audit showed that while organisations covered under the Act provided a wide variety of formal and informal career development and training opportunities, there are inadequate systems in place to monitor access and take-up, particularly among intersectional cohorts.
This data can be collected through learning and development systems, as well as through regular anonymous pulse surveys that include an optional demographic component to capture informal opportunities.
References
- I Bohnet, What Works: Gender Equality By Design, Harvard University Press, 2016; Workplace Gender Equality Agency (WGEA), Gender equitable recruitment and promotion, 2019, accessed 25 July 2022.
- WGEA, Gender equitable recruitment and promotion.
- M Adamovic, ‘Analyzing discrimination in recruitment: A guide and best practices for resume studies’ International Journal of Selection and Assessment, 2020, 28(4), pp 445-464, doi:10.1111/ijsa.12298.
- D Gaucher, J Friesen, and AC Kay, ‘Evidence That Gendered Wording in Job Advertisements Exists and Sustains Gender Inequality’, Journal of Personality and Social Psychology, July 2011, 101(1):109-28, doi:10.1037/a0022530.
- A Genat, Evaluation bias and backlash: how unconscious gender bias hurts women's career progress and two interventions to improve outcomes [doctoral dissertation], The University of Melbourne, 2019, accessed 25 July 2025.
- Adamovic, ‘Analysing discrimination in recruitment’.
- WGEA, Gender ethical recruitment and promotion.
- J Hunt, ‘Why do women leave science and engineering?’, ILR Review, 2016, 69(1):199-226, doi:10.1177/0019793915594597; Professionals Australia, Women staying in the STEM workforce - an economic imperative for Australia: Professionals Australia's Women in the STEM Professions Survey Report [PDF 3.42MB], Professionals Australia, 2021, accessed 29 August 2022.
- Women of Colour Australia (WoCA), Workplace Survey Report 2021, WoCA, 2021, accessed 25 July 2022.
- Women with Disabilities Australia (WWDA), WWDA's Submission to the National Disability Employment Strategy Consultation Paper, 2021, accessed 25 July 2022; Australian Human Rights Commission (AHRC), Willing to Work: National Inquiry into Employment Discrimination Against Older Australians and Australians with Disability, 2016, accessed 25 July 2022.
- O Evans, Gari Yala (Speak the Truth): gendered insights, Jumbunna Institute of Education and Research and Diversity Council Australia, 2021, accessed 22 July 2022, p 7.
- Evans, Gari Yala.
- M McGann et al., ‘Gendered Ageism in Australia: Changing Perceptions of Age Discrimination among Older Men and Women’ Economic Papers (Economic Society of Australia), 35(4):375-388, doi:10.1111/1759-3441.12155.
- KPMG, She’s Price(d)less: The economics of the gender pay gap, KPMG, 2022, accessed 22 July 2022.
- WGEA, Women’s economic security in retirement, 2020, p 12, accessed 25 July 2022; KPMG, She’s Price(d)less.
- There was insufficient data in this measure to report meaningfully on the experiences of people of self-described gender.
- Chief Executive Women, Take It from the Top: Accelerating Women’s Representation in Executive Leadership [PDF 1.65 MB], 2022, p 17, accessed 25 July 2022.
- McKinsey & Company, Women in the Workplace 2021, 27 September 2021, accessed 25 July 2022.
- University of Bristol, Women ‘less likely to progress at work’ than their male counterparts following childbirth [press release], University of Bristol, 2 October 2019, accessed 25 July 2022.
- T Fitzsimmons et al., Employer of Choice for Gender Equality: Leading practices in strategy, policy and implementation, AIBE Centre for Gender Equality in the Workplace, 2020, p 127, accessed 22 July 2022.
- Fitzsimmons et al., Employer of Choice for Gender Equality, p 67.
- WGEA, Gender equitable recruitment and promotion.
- EJ Castilla and S Bernard, ‘The Paradox of Meritocracy in Organizations’ Administrative Science Quarterly, 2010, 55(4): 543-676.
- S Waite, ‘Should I Stay or Should I Go? Employment Discrimination and Workplace Harassment against Transgender and other Minority Employees in Canada’s Federal Public Service’, Journal of Homosexuality, 2021, 68(11):1833-1859, doi:10.1080/00918369.2020.1712140; KK Dray et al., ‘Moving beyond the gender binary: Examining workplace perceptions of nonbinary and transgender employees’, Gender, Work & Organisation, November 2020, 27(6):1181-1191, doi:10.1111/gwao.12455; LK Kleintop, ‘Deciding to be Authentic: Transgender Employees and Their Decision to Be Out at Work,” in J Marques (ed) Exploring Gender at Work, Springer, 2021), pp 139-158, doi:10.1007/978-3-030-64319-5_8.
- Z Hyde et al., The First Australian National Trans Mental Health Study: Summary of Results, Curtin University of Technology: School of Public Health, 2013, accessed 25 July 2022.
- GR Bauer and AI Scheim, Transgender people in Ontario, Canada: Statistics from the Trans PULSE project to inform human rights policy, Trans PULSE Project Team, 2015, accessed 25 July 2022.
- J McNeil et al., Trans Mental Health Study, 2012, p 96, accessed 25 July 2022.
- S James et al., The Report of the 2015 U.S. Transgender Survey [PDF 2.21 MB], National Centre for Transgender Equality, 2016, accessed 25 July 2022.
- Fitzsimmons et al., Employer of Choice for Gender Equality.
- Fitzsimmons et al., Employer of Choice for Gender Equality.
- Fitzsimmons et al., Employer of Choice for Gender Equality.
- Fitzsimmons et al., Employer of Choice for Gender Equality.
Leave and flexible work
This chapter looks at the data for the indicator focused on availability and utilisation of family violence leave; flexible work; and arrangements supporting employees with family responsibilities.
Introduction
Flexibility and leave are important enablers of gender equality for organisations across Australia.191 Flexibility includes arrangements such as working remotely, working part-time, working more hours over fewer days, job sharing, shift swapping, and flexible start and finish times. Leave entitlements include parental leave, carers leave, purchased leave and family violence leave.
Attracting and retaining diverse talent is crucial to future-proofing workplaces and the economy more broadly and making workplaces more flexible and responsive to the needs of employees is an important way of achieving this.192 The uptake of paid parental leave and carers leave by both parents, as well as access to family violence leave, play a particularly important role in supporting greater economic security by enabling women to remain in the workforce.193
Key issues: Why was this measured?
Workplace flexibility is desirable
Research shows that workplace flexibility is a highly desirable feature of Australian workplaces194 with employees increasingly expecting organisations to have moved away from traditional workplace models.195 This has been magnified by the COVID-19 pandemic, which has led to a rethink of what it means to 'go to work'.196 Unsurprisingly, the economic, health and social benefits associated with flexibility in work patterns have seen Australians want to continue to have the option to work from home.197
Research reported in 2021 found that Australian women were more likely than men to request to work from home in order to accommodate the higher burden of unpaid domestic and care responsibilities.198 Men were more reluctant to request flexibility as a result of masculine norms and because of perceived or actual impact on their career progression.199
Parenthood stalls career progression for women
Women’s transition due to parenthood from full-time work to either part-time work or leaving the paid workforce altogether stalls women’s career progression.200 This has been identified as contributing to 20% of the gender pay gap.201
Australian data also shows that women who experience intersecting forms of inequality are more likely to leave the workforce after having children. This trend is apparent for migrant and First Nations mothers, as well as mothers with disability, mothers caring for others with disability and young mothers.202
Women do most of the unpaid domestic and caring work
Women in Australia are 3.5 times more likely to have spent 30+ hours on unpaid domestic work per week, compromising their ability to participate in the formal economy to their full capability.203
The recently published results of the Household, Income and Labour Dynamics (HILDA) Survey found housework is the largest form of unpaid work, averaging roughly 10 hours per week, followed by caring for one’s own children.204 Additionally, more than 12% of Australian women and 9% of men care for an elderly person or a person with disability, usually a family member. In 2018, 7 in 10 primary carers of elderly people or people with disability were women.205
Family violence is gendered and intersectional
Research has found that Aboriginal and Torres Strait Islander women are 32 times more likely to be hospitalised for family violence than non-Indigenous people,206 that one in 3 migrant and refugee women have experienced family violence,207 and that people with disability are almost twice as likely to have experienced family violence than people without disability.208 We also know that these individuals face more barriers to reporting family violence and accessing support services.209
Research indicates that leave is an important element among a range of workplace responses that can enable victim-survivors of family violence to maintain paid employment.210 Family violence leave, especially when paid, affords victim-survivors financial security, while allowing them time to access support, attend court appointments, move house, and recover from violence and abuse.211
How was this indicator measured?
Organisations covered by the Act were asked to provide data on the following as at 30 June 2021:
- the proportion of employees utilising formal flexible work arrangements (not including mandatory working from home periods due to the COVID-19 pandemic) disaggregated by gender, classification and employment basis
- the number of senior leaders utilising flexible work arrangements, disaggregated by gender and the type of flexible work arrangement. 212
In addition, they were asked to provide data on the following for the period between 1 July 2020 and 30 June 2021:
- the proportion of employees who had taken either paid and unpaid parental leave, disaggregated by gender, classification, and length of leave, and the number of people who exited the defined entity during a period of parental leave, disaggregated by gender
- the number of people accessing family violence leave and carers’ leave over the same period, disaggregated by gender.
In addition, employees of defined entities were invited to participate in a standardised employee experience survey. Organisations were surveyed separately, and the results were reported to the Commission as percentages of respondents. Items with fewer than 10 responses were suppressed to protect respondents’ privacy.
The Commission used this data to understand:
- employee views as to whether use of flexible work arrangements or having family or caring responsibilities acts as a barrier to success
- whether employees believe there is support and a positive culture in the workplace with respect to employees with flexible work arrangements or family or caring responsibilities
- employee uptake of flexible work arrangements.
What was found: Key data insights
Formal flexible working arrangements
As Figure 5.1 shows, approximately one in 4 workers in organisations covered by the Act had formal flexible working arrangements in place. At the time of data collection, formal flexible work arrangements were most common within the Victorian Public Service, universities, local government and public health care industry groups. They were least common within the arts, finance and insurance, and the transport industry groups.
Fig 5.1. Prevalence of formal flexible work arrangements, by industry
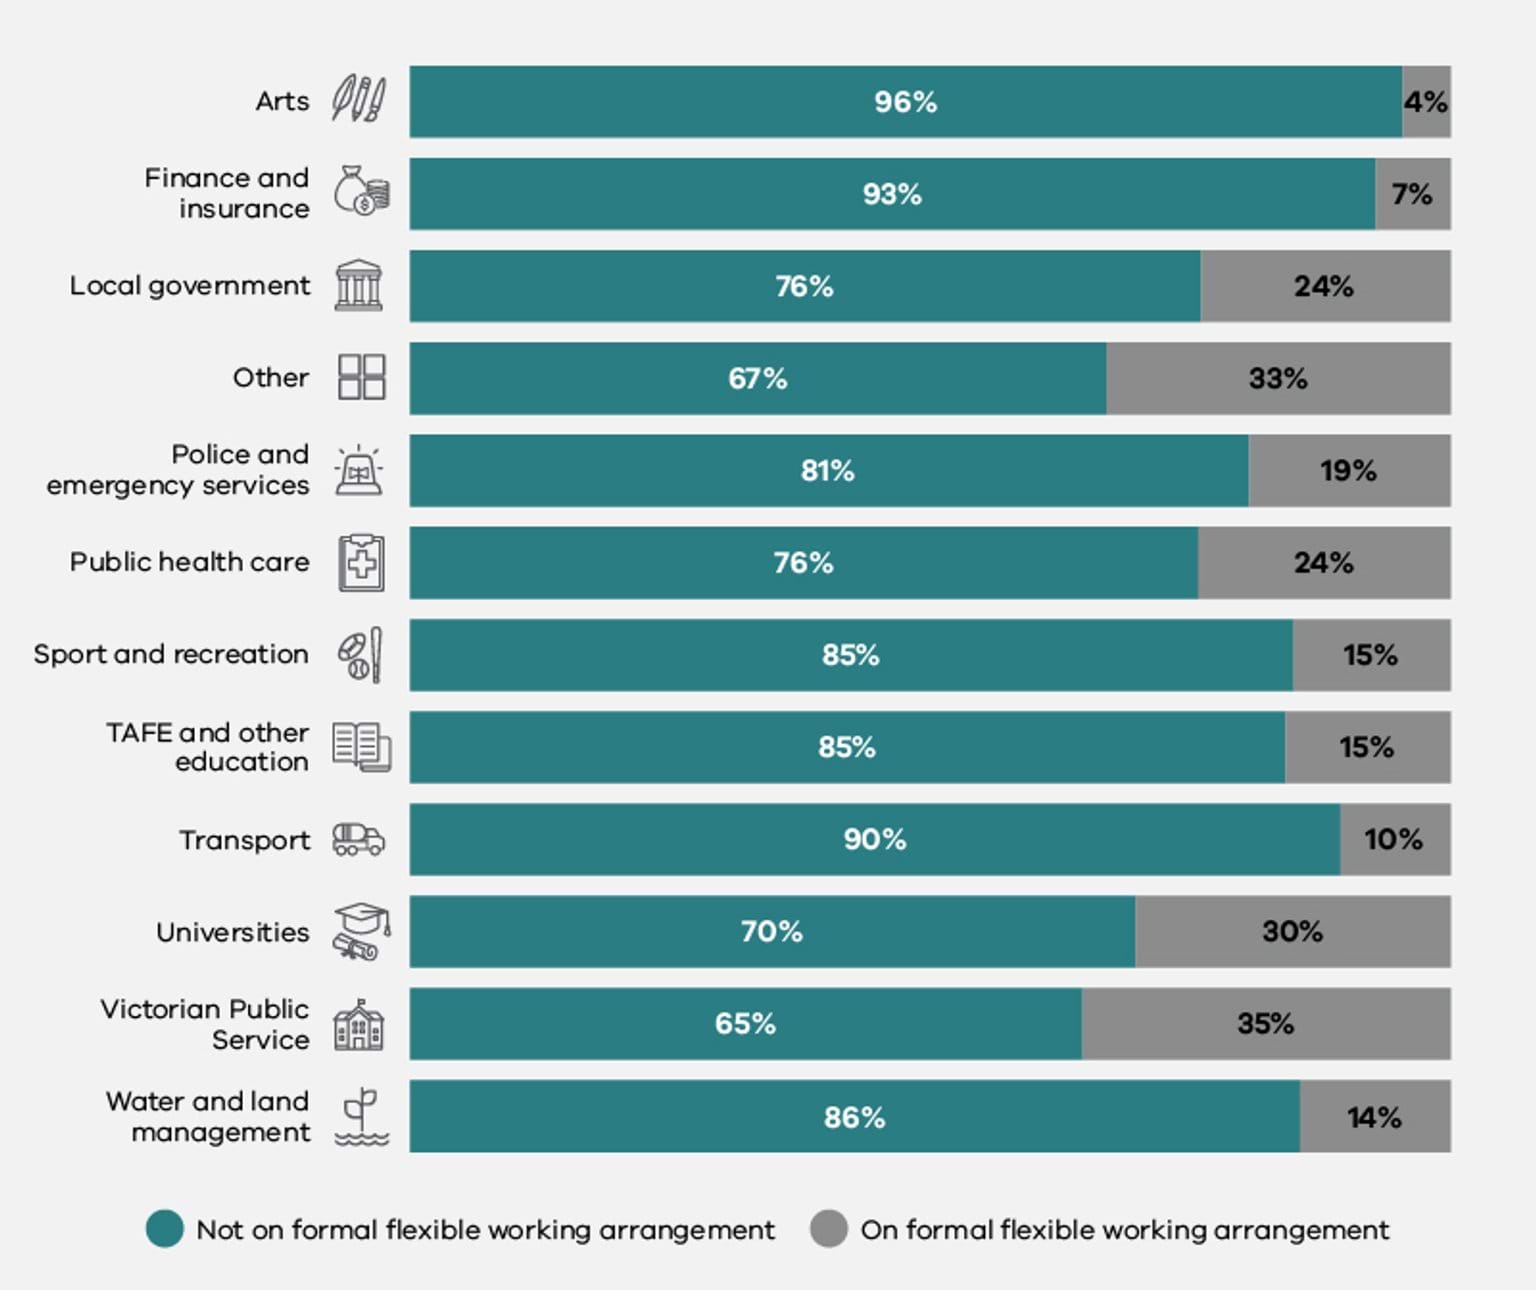
As at June 30 2021, across all defined entities, women comprised 77% of those with formal flexible work arrangements. Men comprised 22% and people of self-described gender comprised 0.1%.
As Figure 5.2 shows, at the industry group level, women with formal flexible work arrangements outnumbered men in all but one industry group. Transport was the only sector where more men than women were accessing formal flexible working arrangements.
At the industry group level, people of self-described gender comprised up to 1.8% of those using formal flexible work arrangements, with the Arts sector showing the highest level of uptake among this group.
Fig 5.2. Gender composition of workforce compared with those on formal flexible working arrangements, by industry
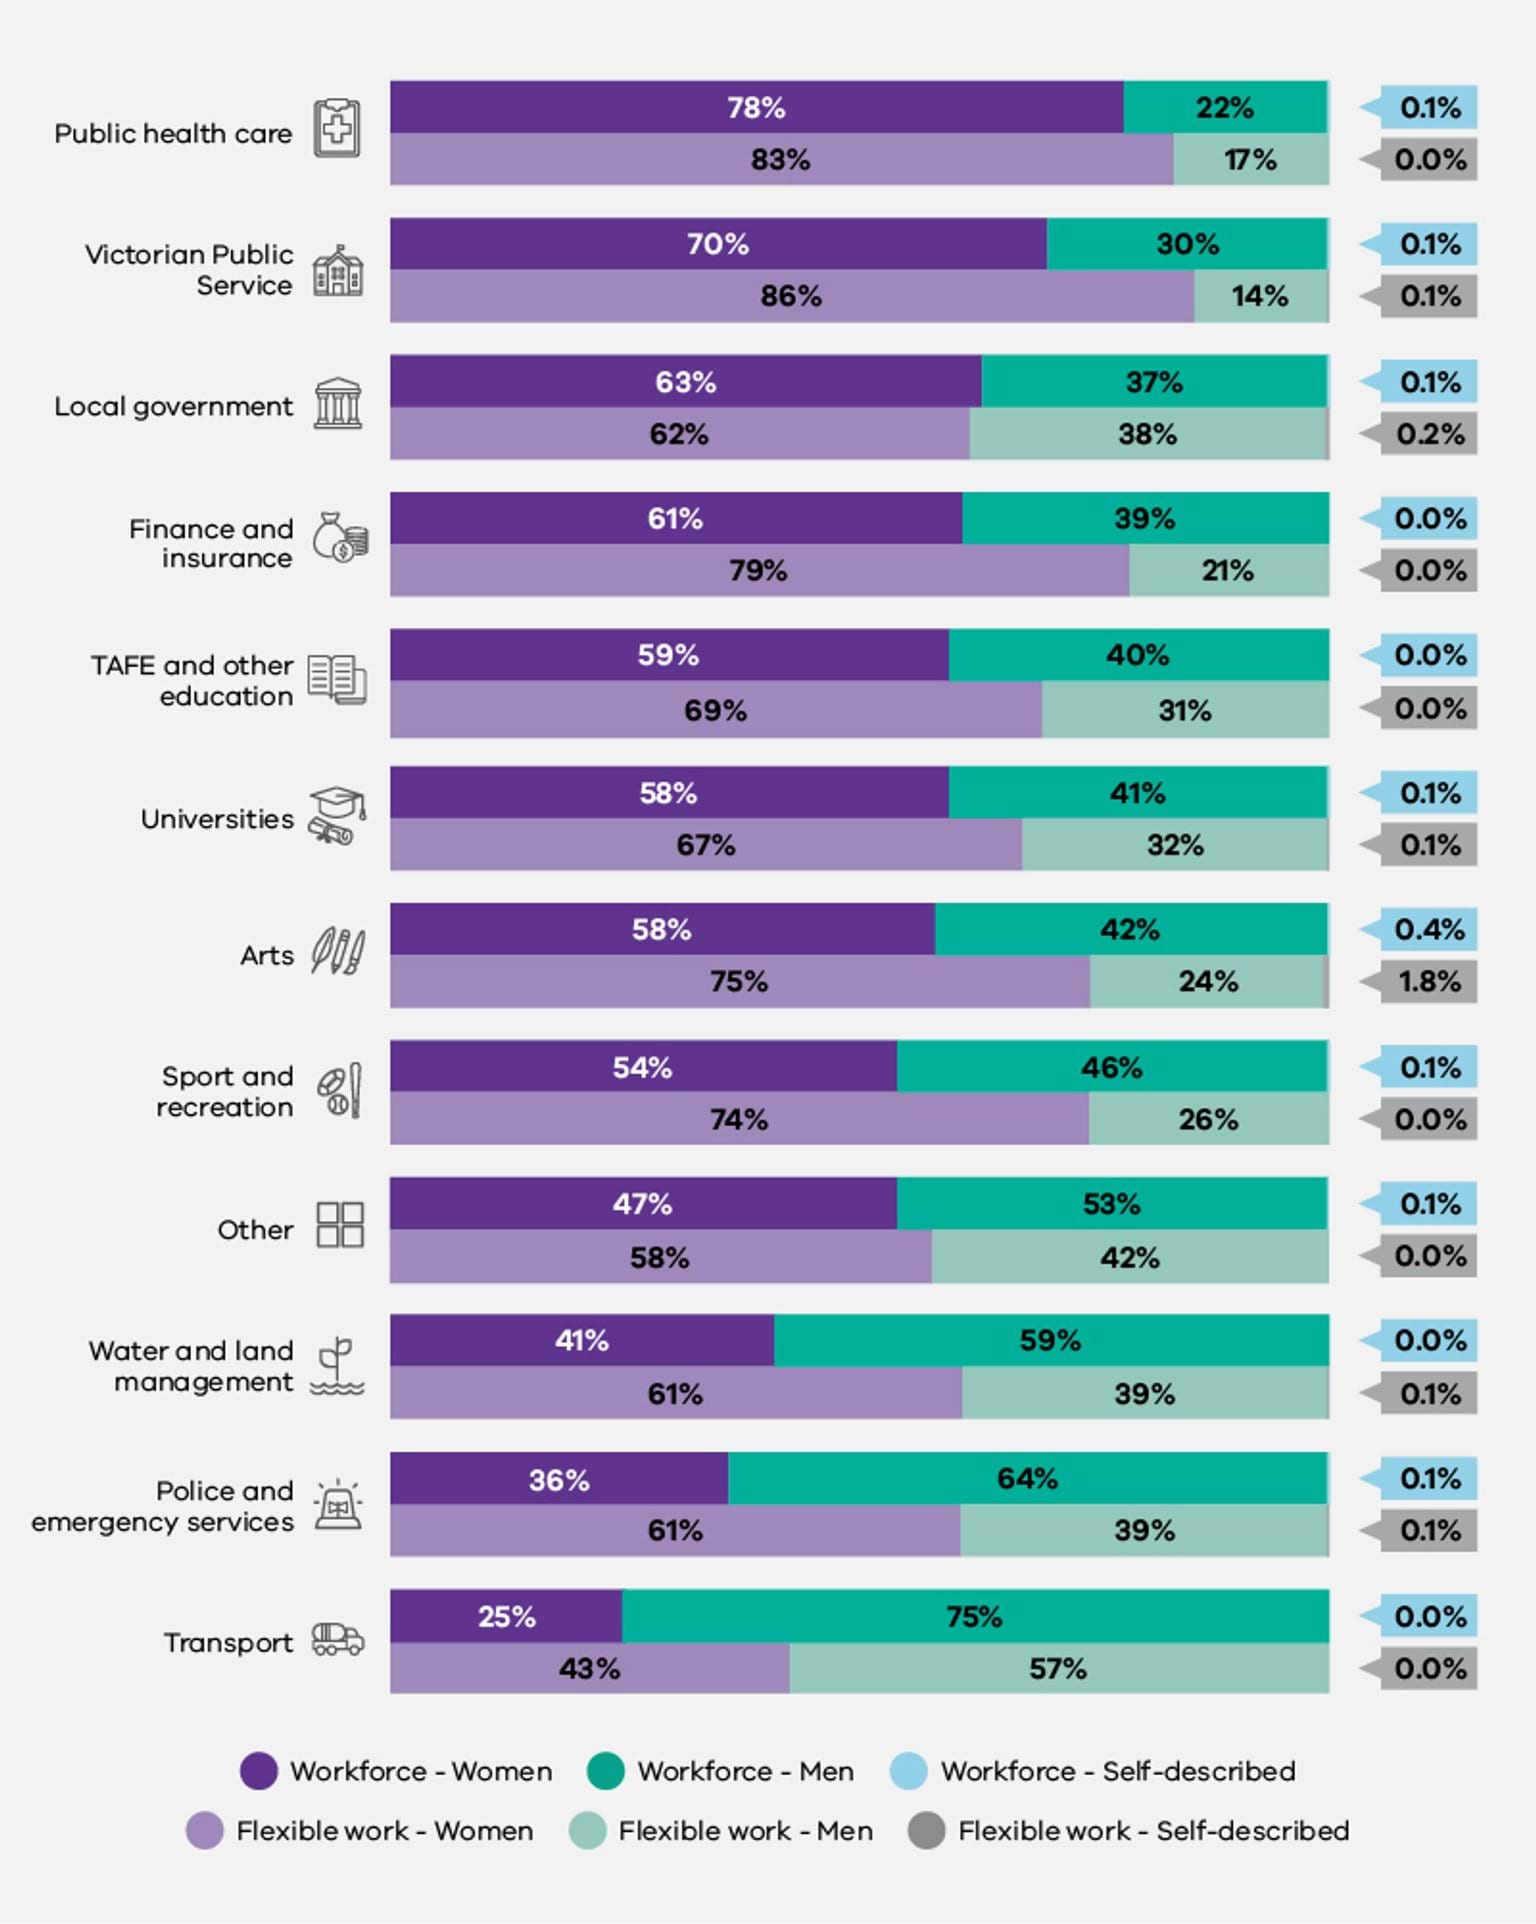
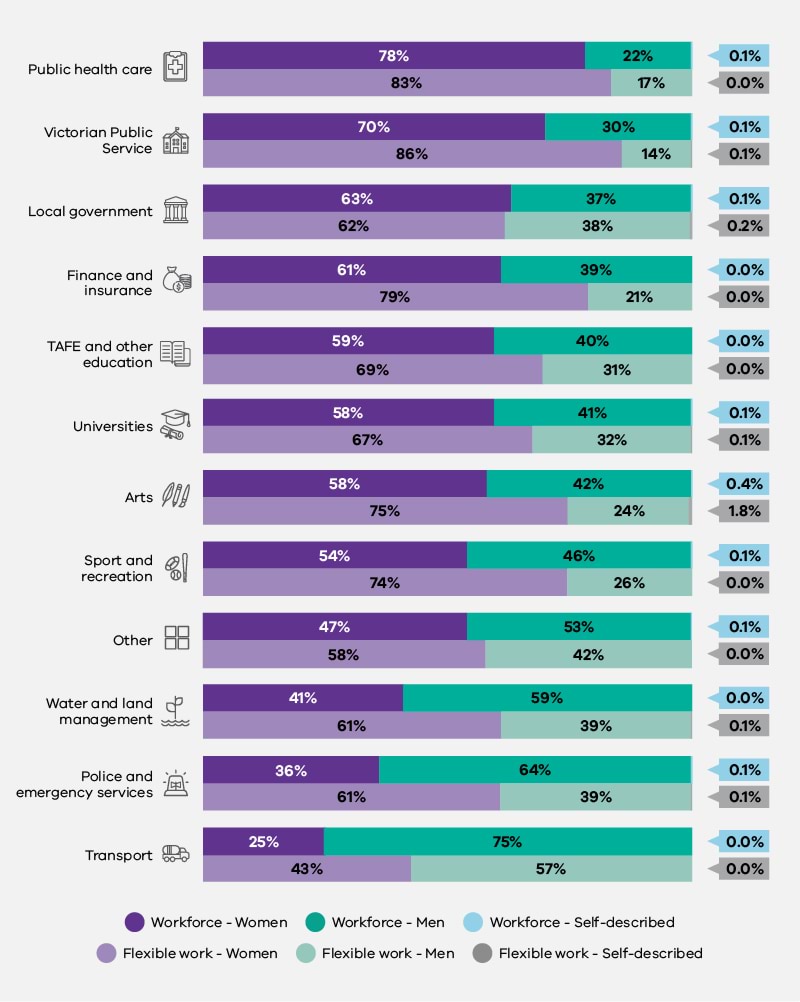
Part-time work and job sharing
As shown in Figure 5.3, among survey respondents, most types of flexible work were accessed fairly evenly by women and men. This included working from home (or an alternative remote work location) and utilising flexible start and finish times, which were the types of flexible work arrangements most frequently accessed by survey respondents. However, women were 3 times more likely to report that they worked part time.
Fig 5.3. Types of flexible work arrangements used by survey participants, by gender
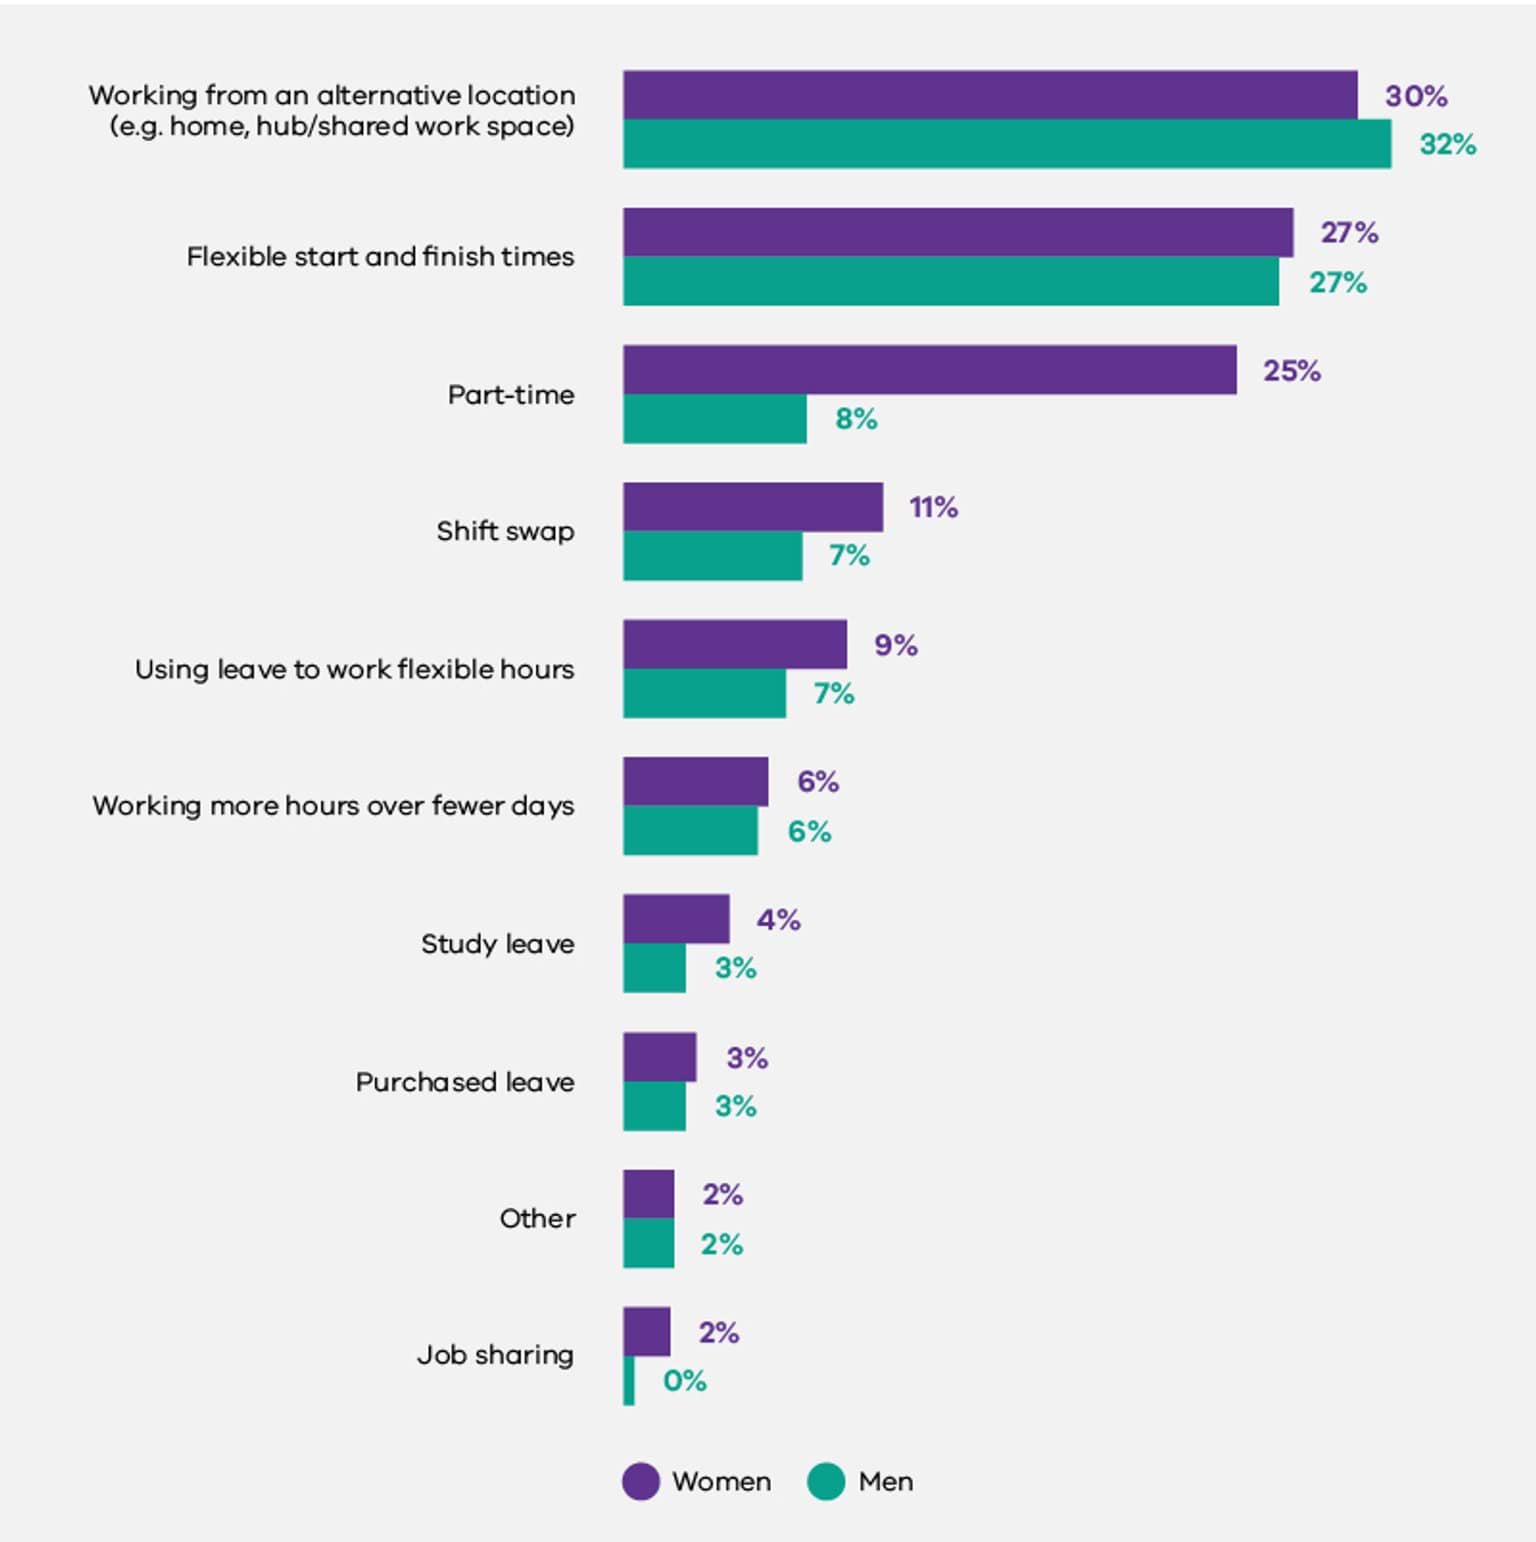
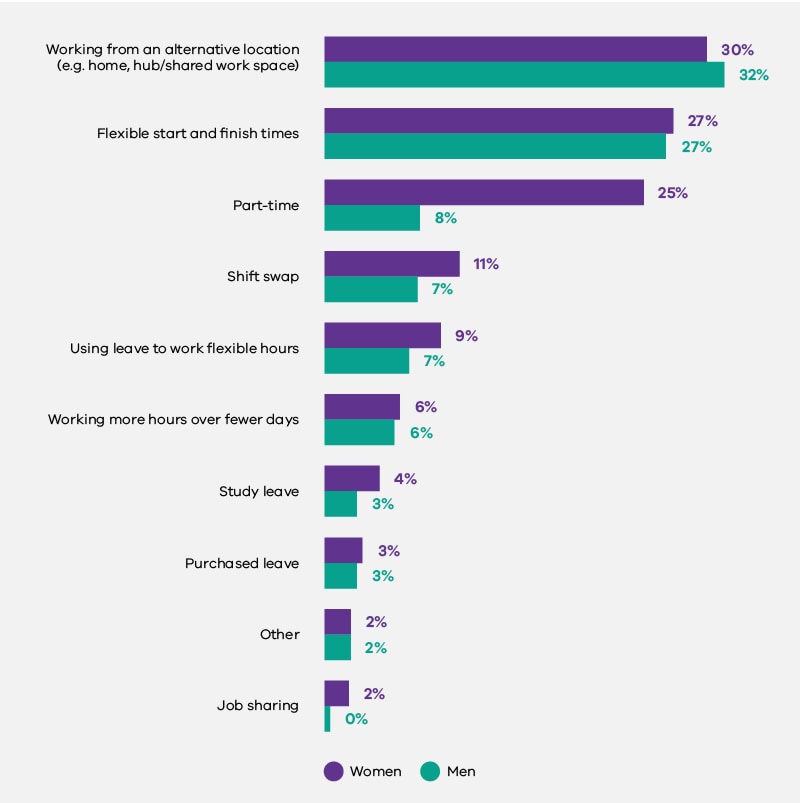
As shown in Figure 5.4, below, the types of flexible work most frequently used by senior leaders were remote work and flexible start or finish times. These were accessed almost equally by women and men. However, two types of flexible work were disproportionately utilised by women in senior leadership roles: part-time work and job sharing. These types of flexible work arrangements are more likely to entail a financial penalty than others and can thus contribute to gender pay gaps.213
Fig 5.4. Types of flexible work utilised by senior leaders, by gender
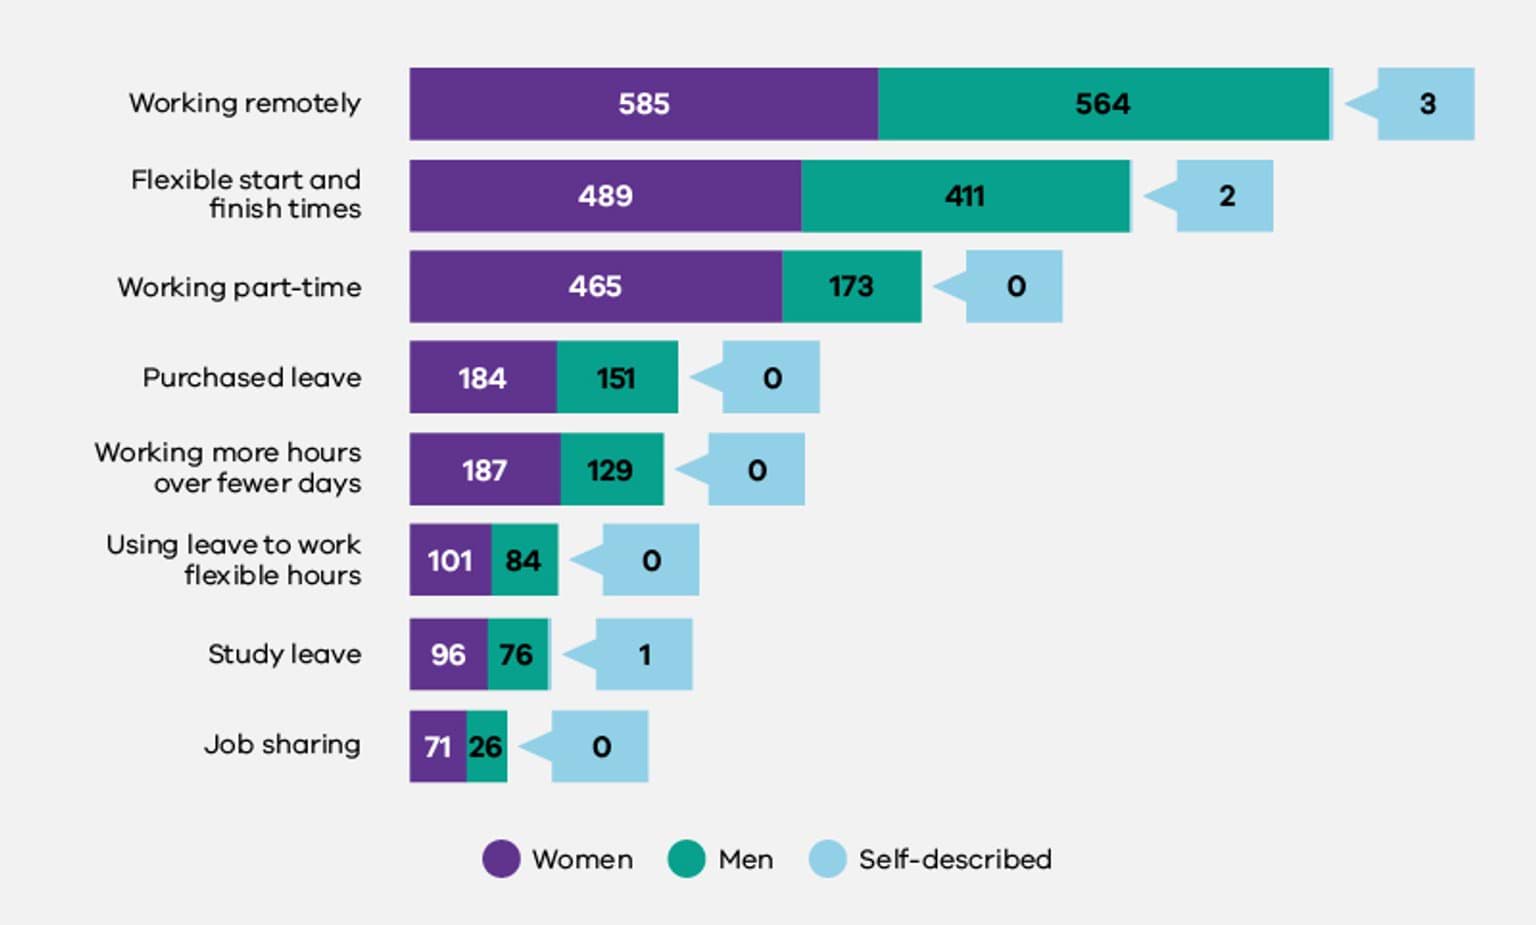
Parental leave
Across all defined entities covered by the Act, women comprised 79% of parental leave takers. People of self-described gender comprised 0.1% of parental leave takers.214
As can be seen in Figure 5.5, below, in 9 of the 11 industry groups, women comprised more than 70% of parental leave takers. Within the public health care and Victorian Public Service industry groups, nearly 9 in 10 parental leave takers were women. The industry groups with the highest proportion of men taking parental leave were police and emergency services (57%) and water and land management (47%).
Fig 5.5. Gender composition of workforce compared with parental leave takers, by industry
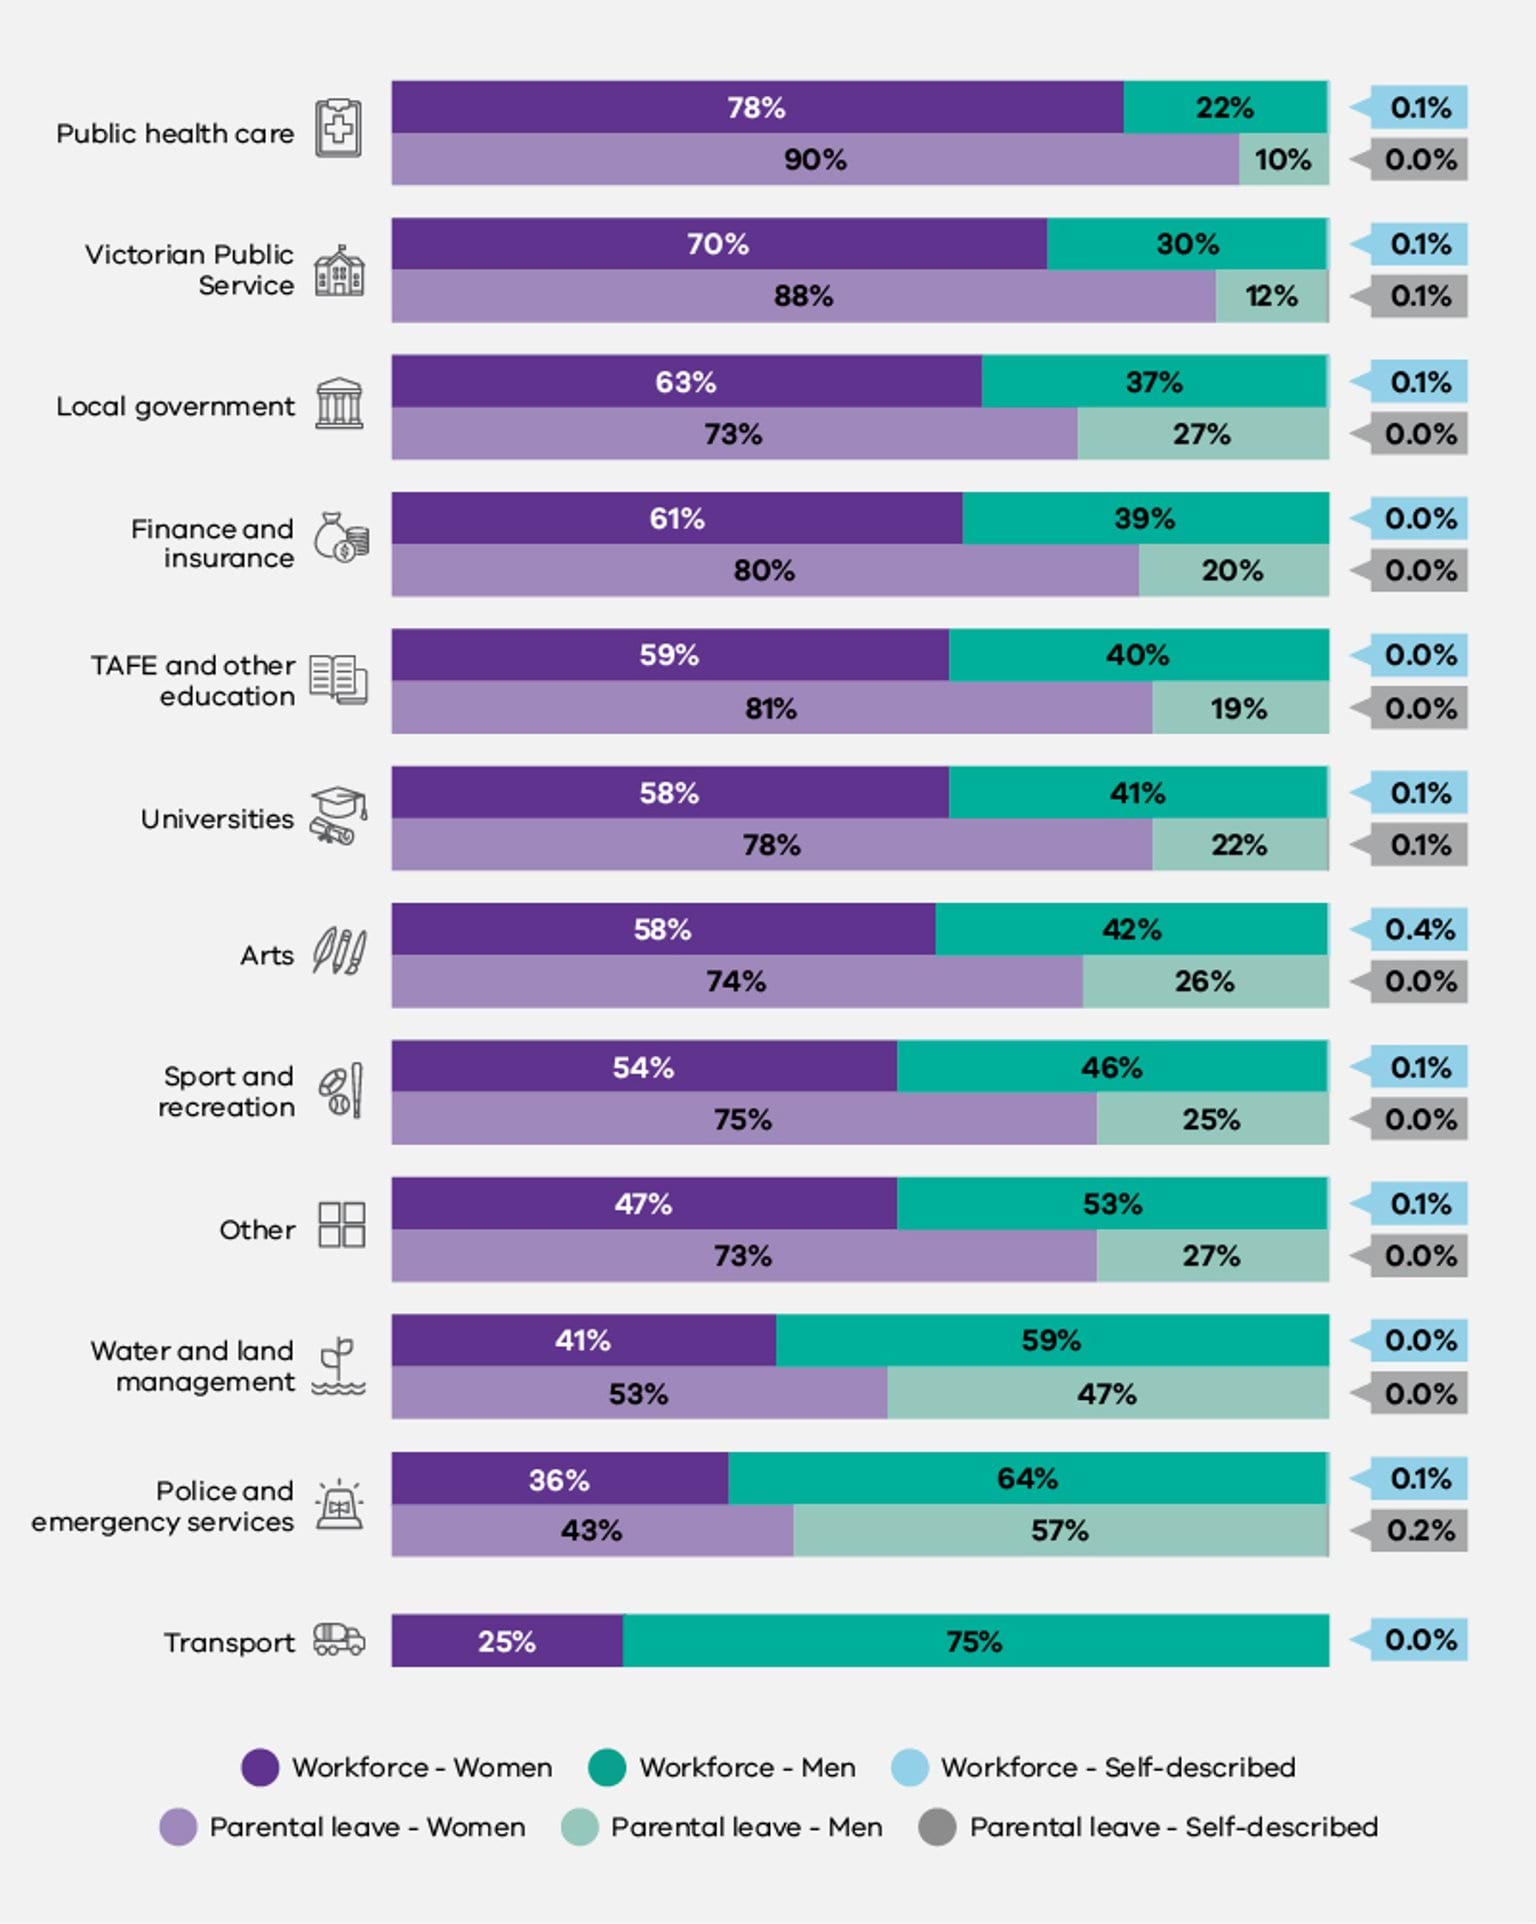
The average woman who took parental leave accessed 20 weeks of paid leave and 22 weeks of unpaid leave, while the average man took 4 weeks of paid and 2 weeks of unpaid parental leave. The average person of self-described gender took 5 weeks of paid parental leave and 6 weeks of unpaid parental leave.
As set out in Figure 5.6, below, at the industry level, durations varied noticeably, with women’s parental leave lasting between 6 and 14 times longer than men’s. Women’s and men’s parental leave durations were closest in the police and emergency services industry group and in local government, while they were farthest apart in the sport and recreation industry group and the TAFE and Other Education industry groups.
Fig 5.6. Average duration of parental leave, by gender and industry
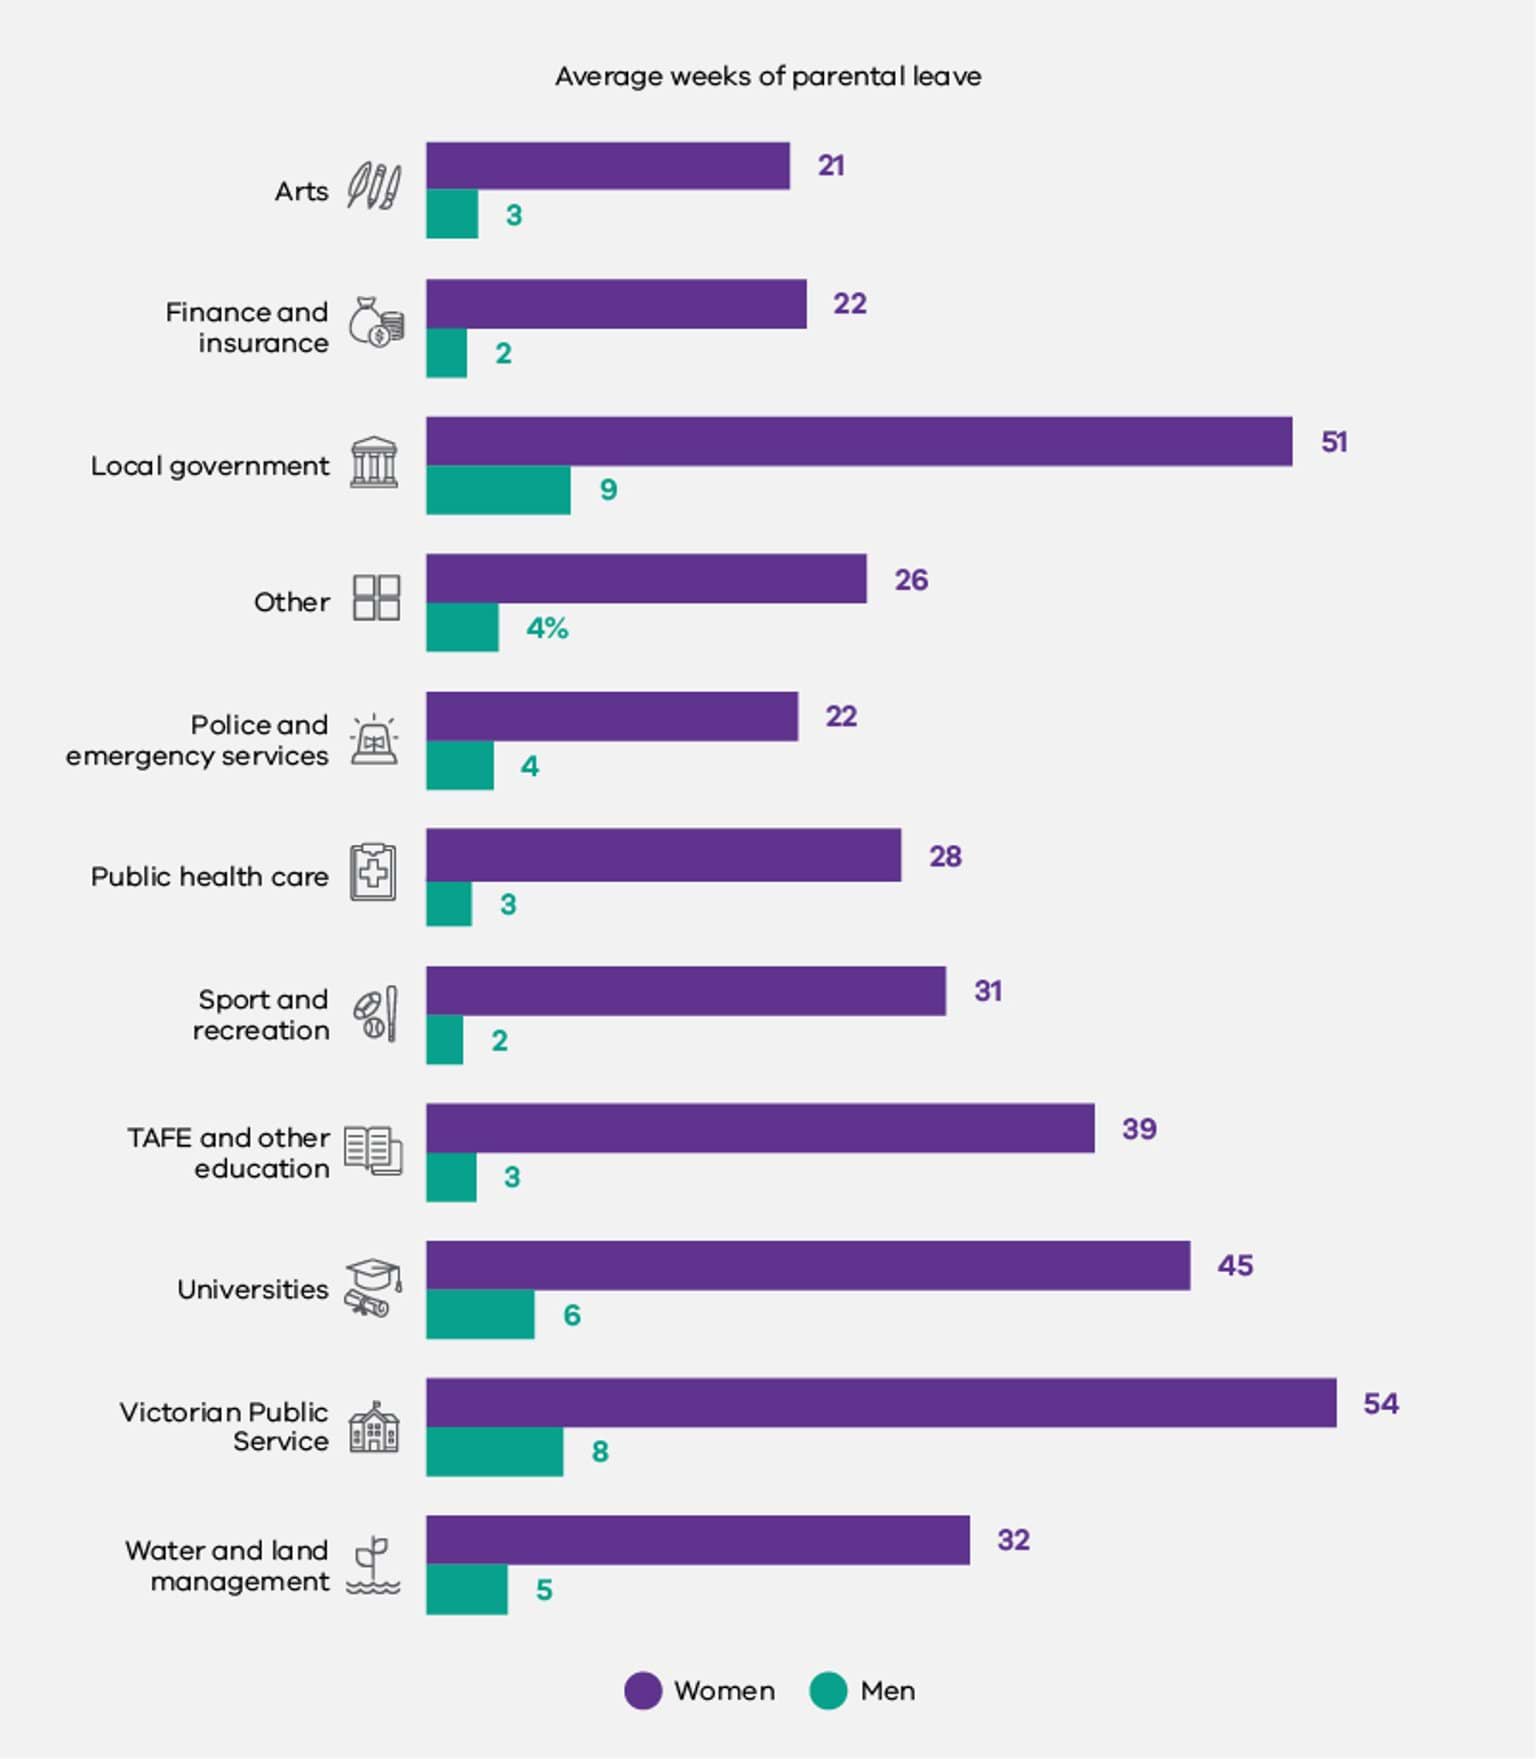
Figure 5.7 shows that across all defined entities, women comprised 94% of exits during parental leave (both voluntary and involuntary). Comparatively, 6% of exits during parental leave were men and 0.2% were people of self-described gender.
Fig 5.7. Exits during parental leave, by gender

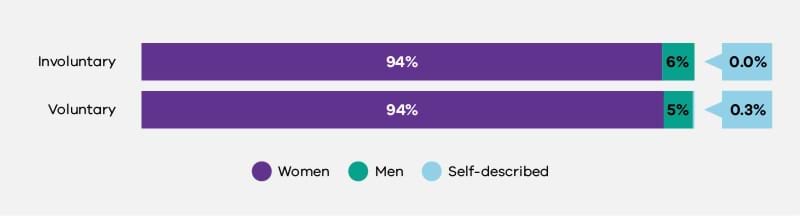
Family violence leave
The vast majority (88%) of those who accessed family violence leave in organisations covered by the Act were women, while 11% were men, and 0.2% were people of self-described gender. Given the gendered nature of family violence these findings are unsurprising.215
Carer's leave
Of those accessing carer’s leave in defined entities, the majority were women, at 68%. Men comprised 32% of those accessing carer’s leave, while 0.1% were people of self-described gender. This unequal distribution of carer’s leave reflects broader evidence that women in the paid workforce remain more likely than men to provide care to others.216
Flexibility and caring as barriers to success
As shown in Figure 5.8 below, the majority of survey participants believed that flexible work, family responsibilities and caring responsibilities were not barriers to success in their workplace, regardless of gender. However, women’s agreement rates were consistently lower than men’s in relation to these questions.
Fig 5.8. Survey participant perceptions about barriers to success, by gender
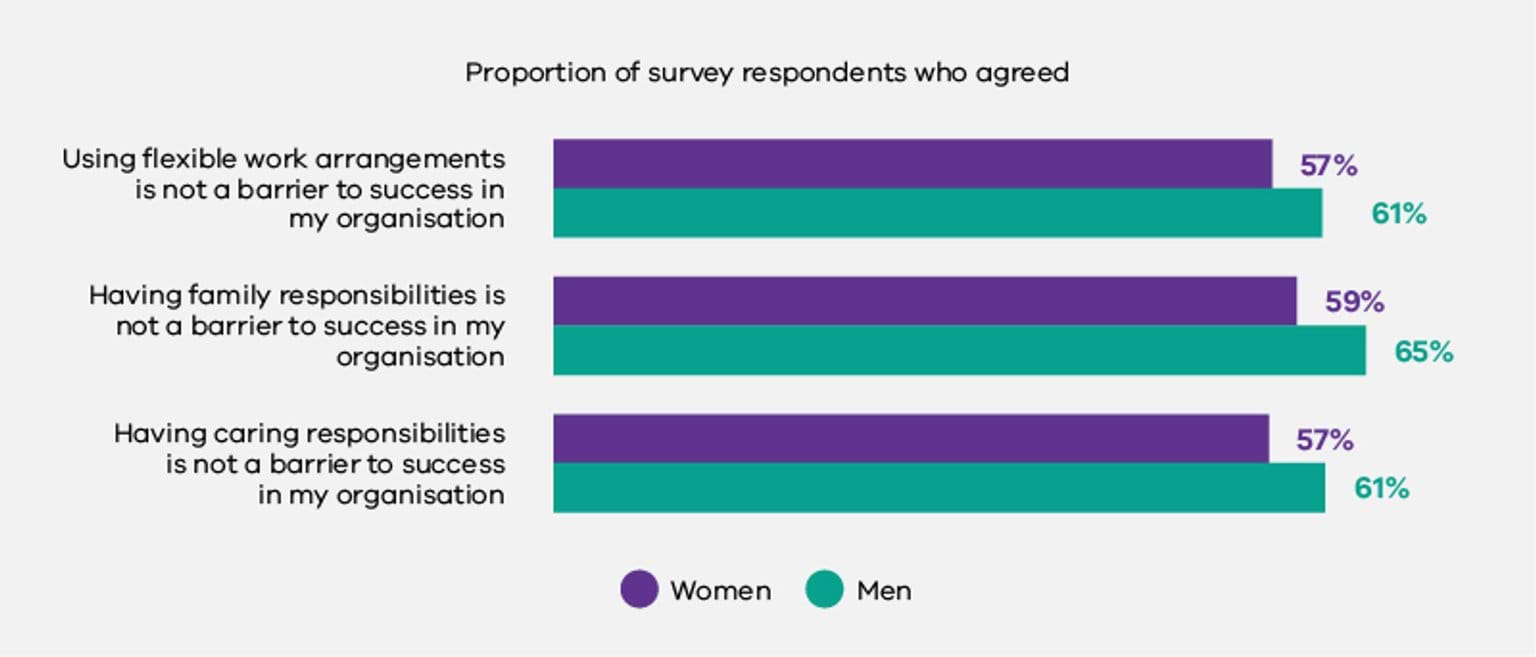
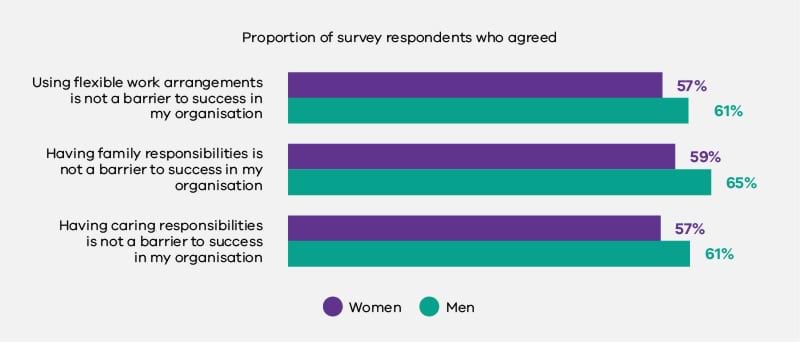
Discussion
The Victorian public sector, local councils and universities are nation-wide leaders in acknowledging the role flexible work and family violence leave policies can play in achieving gender equality.217 In light of this policy leadership across the public sector, the Commission’s focus is on promoting equitable uptake of these entitlements.
The 2021 workplace gender audit data reinforced existing research, which warns that access to flexible work alone does not necessarily result in equitable uptake among employees, nor does it ensure equitable career outcomes for those who adopt flexible working practices.218 Rather, policy implementation and organisational culture are critical to ensuring flexible work does not disadvantage those who access it, nor perpetuate gendered inequalities around both paid work and caring.219
While flexible work arrangements and parental and carers’ leave entitlements are critical for women to manage the competing demands of paid and unpaid work, it is important that uptake of these entitlements is balanced across genders. Not only does an imbalance widen the gender pay gap, but it reinforces gender stereotypes and norms. Therefore, while Victoria’s policy leadership is commendable, the gender imbalance in formal flexible working arrangements visible in the Commission’s data suggests defined entities must continue monitoring the gendered impacts of flexible working arrangements on women’s disproportionate load of unpaid work and care, as well as the associated consequences for women’s career progression.
Over the past decade, family violence leave has been identified as an important support measure to assist victim-survivors of family violence to maintain paid employment and escape harm.220 Collecting and responding to data about the uptake of family violence leave will enable defined entities to ensure they are supporting all employees experiencing family violence. This data will also supplement the limited existing formal data about whether paid family violence leave can enable greater employee wellbeing, as well as retention and progression. Data collection on this indicator may also be useful for other jurisdictions and sectors to consider the value of paid family violence leave.
Paid leave is particularly important to address the acute financial insecurity often faced by victim-survivors. A 2017 report estimated that, in Australia, the average financial cost to the victim-survivor of intimate partner violence, specifically, was $27,000.221 In May 2022, the Fair Work Commission released a provisional decision to include 10 days paid family violence leave in all Australian awards.222 To date, this decision has not yet been finalised; all Australian employees are currently entitled to 5 days unpaid family violence leave per year.223
Recommendations
Organisations covered under the Act should aim to move towards systems and cultures where flexibility is embedded and is not a barrier to progression, and where no value judgements are attached to the flexibility needs of employees.
To enable a workplace to understand whether they are moving towards that future, organisations should ensure they are collecting a holistic range of quantitative, qualitative and evaluation data including:
- formal and informal leave arrangements
- evaluation data relating to programmatic efforts focused on:
- preventing exits during parental and carer’s leave
- supporting more fathers, carers and guardians to take up parental leave and flexible work arrangements
- supporting managers to manage flexible and hybrid teams
- monitoring career progression of leave takers
- feedback from all levels of the organisation about how flexible work practices can be improved.
Workplace gender audits completed under the Act will support this data collection.
References
- Workplace Gender Equality Agency (WGEA), Flexible work, accessed 25 July 2022.
- WGEA, Flexible work.
- KPMG, Enhancing work-life balance: A better system of Paid Parental Leave, KPMG, 2021, accessed 25 July 2025; Australian Human Rights Commission (AHRC) Fact sheet: Domestic and family violence - a workplace issue a discrimination issue, AHRC, 2014, pp 2-4.
- Victorian Equal Opportunity & Human Rights Commission (VEOHRC), Rebuilding flexible workplaces – Lessons for the post-COVID workplace’, May 2021, accessed 25 July 2022.
- PwC, Hopes and Fears 2021, March 2021, accessed 25 July 2022.
- VEOHRC, Rebuilding flexible workplaces.
- Australian Bureau of Statistics (ABS), Household Impacts of COVID-19 Survey, February 2021, accessed 25 July 2022.
- ABS, Household Impacts of COVID-19 Survey.
- A Borgkvist, ‘It Would be Silly to Stop Now and Go Part-Time: Fathers and Flexible Working Arrangements in Australia’, in M Grau Grau et al. (eds) Engaged Fatherhood for Men, Families and Gender Equality. Contributions to Management Science, Springer, Cham, 2022, doi:10.1007/978-3-030-75645-1_13.
- L Jones, Women’s progression in the workplace, Global Institute for Women’s Leadership & Government Equalities Office, UK, October 2019, accessed 25 July 2022.
- Jones, Women’s progression in the workplace.
- J Baxter, Employment characteristics and transitions of mothers in the Longitudinal Study of Australian Children, Australian Institute of Family Studies, Australian Government, 2013, accessed 25 July 2022.
- ABS, Unpaid work and care: Census, 2021, accessed 25 July 2022.
- R Wilkins et al., The Household, Income and Labour Dynamics in Australia Survey: Selected Findings from Waves 1 to 19, Melbourne Institute: Applied Economic & Social Research, the University of Melbourne, accessed 25 July 2022.
- ABS, Disability Ageing and Carers, Australia: Summary of Findings, 2019, accessed 25 July 2022; Department of Health and Human Services, Recognising and supporting Victoria’s carers Victorian carer strategy 2018-22, State of Victoria, 2018, accessed 25 July 2022.
- Australian Institute of Health and Welfare (AIHW), Family, domestic and sexual violence in Australia: Continuing the national story 2019, Australian Government, 2019, accessed 25 July 2022.
- M Segrave et al., Migrant and refugee women in Australia: The safety and security study, Monash University, 2021, accessed 25 July 2022.
- AIHW, Family, domestic and sexual violence in Australia.
- AIHW, Family, domestic and sexual violence in Australia.
- R Weatherall et al., ‘Safeguarding women at work? Lessons from Aotearoa New Zealand on effectively implementing domestic violence policies’, Journal of Industrial Relations, 2021, 63(4):568-590, doi:10.1177/0022185621996766.
- Weatherall et al., Safeguarding women at work?.
- For the first time under Australian gender equality reporting legislation, organisations covered by the Act were required to provide data disaggregated not only by gender, but across a range of attributes. As outlined in the Introduction, the Commission will publish insights from this intersectional data in a companion report on intersectionality, to be released in 2023.
- L Ruppanner and J Meekes, Flexible work arrangements help women, but only if they are also offered to men, The Conversation, 8 March 2021, accessed 25 July 2022; DR Eikhof, ‘A double‐edged sword: twenty‐first century workplace trends and gender equality, Gender in Management: An International Journal, 27(1):7-22, doi:10.1108/17542411211199246.
- The Workplace Gender Equality Agency (WGEA) gathers data from private sector organisations with more than 100 employees. In 2020-2021, its data showed that women accounted for 88% of the total primary parental leave takers, as opposed to men accounting for 12% (WGEA, Australia’s gender equality scorecard: Key results from the Workplace Gender Equality Agency’s 2020-21 employer census, 2022, accessed 25 July 2022). Australia-wide in 2016, the Australian Bureau of Statistics recorded women taking 95% of primary parental leave, with only 1 in 20 fathers accessing this leave type (ABS, One in 20 dads take primary parental leave [media release], 19 September 2017, accessed 25 July 2022.) These statistics do not represent direct comparison with the Commission’s data, as the figures only include primary parental leave, whereas we measure all parental leave. However, in combination, all 3 datasets demonstrate that parental leave in Australia continues to be highly gendered both in the public and private sectors.
- Our Watch, Quick facts, Our Watch, accessed 25 July 2022; AIHW, Family, domestic and sexual violence in Australia, 2018, Australian Government, accessed 25 July 2022.
- Organisation for Economic Cooperation and Development (OECD), Informal carers, OECD, 2021, accessed 25 July 2022.
- In 2021, the Victorian Government made flexible working the default position for all public service employees, including executives. Further, family violence leave has been included in all Victorian public sector enterprise agreements since 2015, meaning public sector employees (including nurses and teachers) have access to 20 days of paid family violence leave, an entitlement reflected (and in some cases exceeded) in almost all Victorian local council and university enterprise agreements (Tim Pallas MP, Victoria leads the way on paid family violence leave [media release], Victorian Government, 11 April 2022, accessed 25 July 2022; Australian Services Union (ASU), Family Violence Leave’, ASU, accessed 25 July 2022.
- Eikhof, A double‐edged sword.
- Eikhof, A double‐edged sword.
- Weatherall et al., Safeguarding women at work?; We Are Union, Understanding family violence as a workplace issue: Your guide, Victorian Trades Hall Council, accessed 25 July 2022.
- PwC, A high price to pay: the economic case for preventing violence against women, 2015, accessed 22 July 2022.
- Fair Work Ombudsman, Paid family and domestic violence leave in awards, Australian Government, 2022, accessed 25 July 2022.
- Fair Work Ombudsman, Paid family and domestic violence leave in awards.
Concluding comments and next steps
This chapter provides some concluding comments about evaluation, Gender Equality Action Plans and resourcing.
This report represents a key part of the culmination of the first round of obligations under the Gender Equality Act 2020. This means almost 300 organisations have implemented the systems and processes to fulfil their workplace gender audit obligations for the first time. As in any new process, there is much learning to be incorporated into future reporting rounds to create greater clarity, efficiency, and impact.
As discussed in the Introduction, there is work to be done to better understand – and build capacity to record, analyse and address – how other forms of disadvantage and discrimination intersect with gender inequality. The Commission is committed to building this evidence base and capability. As part of its broader suite of work on intersectionality, the Commission will produce a companion to this report to be released in the first trimester of 2023. This report will be focused exclusively on intersectionality and present intersectional insights from the audit data along with insights and recommendations from the intersectional research commissioned in 2022.
Undertaking this work will help to address complex inequalities within organisations and the broader Victorian community. It will also position Victoria as a leader in intersectional data collection and analysis, inspiring other jurisdictions to follow.
Informing future workplace gender audits
The Act’s inaugural workplace gender audit was the first time many organisations covered by the Act had been asked to collect and report on data of this nature. The Commission acknowledges that data collection of this scale has been a challenge for some.
The Commission is committed to learning from this first workplace gender audit process. To this end, the Commission sought an external evaluation of the entire workplace gender audit process. A member of our Panel of Expert Providers will advise on the efficiency and effectiveness of the workplace gender audit process, identify any changes that need to be made for the 2023 progress report data collection framework, and help us gauge the level of guidance and support needed to build defined entities’ data collection capabilities. The Commission encourages all defined entities to participate in this evaluation to ensure future workplace gender audits are of high quality, particularly regarding the collection and analysis of intersectional data.
The evaluation outcomes will be delivered in late 2022 and the Commission will use these to evolve future audit specifications, guidance, and other support.
Gender Equality Action Plans and capability development
Undertaking a data-driven audit and analysis of the state and nature of gender equality in their organisations was intended to assist defined entities to develop a meaningful and robust understanding of where improvements need to be made. Developing a Gender Equality Action Plan (GEAP) based on the audit outcomes should, in turn, ensure that defined entities have generated strategies and measures that can address the specific forms of gender inequality that exist in their organisations.
Collecting and publicly reporting audit data at regular intervals then allows organisations, their stakeholders and the Commission to understand whether those strategies are effective.
This cycle of identifying problems through data collection, developing actions to address those problems, and using data collection and analysis again to monitor progress and modify actions as needed, will support defined entities to meet the Act’s obligation to make reasonable and material progress in relation to their gender equality indicators every 2 years.
GEAPs are designed around 6 central pillars:
- Data collection and analysis
- Meaningful consultation with governing body, employees and employee representatives – including relevant trade unions
- A commitment to underlying principles of gender equality and intersectionality
- Development of strategies and measures for improving gender equality
- A commitment to leadership and resourcing of the plan
- Monitoring progress against strategies and measures over time.
The first round of GEAPs were submitted to the Commission between 31 March and 20 June 2022.
The Commission completed a multi-stage review of each entity’s submission – including both the GEAP, as well as any supporting documents – to assess for compliance with the Act.224 A GEAP was considered compliant if it addressed each of the requirements set out in the Act to a minimum standard.
To support the strengthening of GEAPs, where a requirement was found to be non-compliant, the organisation was provided with a detailed description of the requirement and guidance to address the omission and resubmit a revised GEAP. Entities were also given the opportunity to contest a finding of non-compliance.
While most defined entities have already received a report based on the compliance review of their GEAP, the Commission is also committed to building capability within defined entities to develop and implement higher quality GEAPs over time.
To this end, the Commission is undertaking further in-depth qualitative analysis of GEAPs throughout the remainder of 2022. This will involve an analysis of GEAPs that demonstrate leading practice in planning to address gender inequality, as well as GEAPs that may demonstrate common pitfalls, or that have met compliance minimums, but may not be highly effective in progressing gender equality.
The outcomes of this qualitative review of GEAPs will inform a report showcasing high quality examples and recommendations for defined entities to strengthen their current GEAP implementation and future GEAP development. The outcomes will also inform improvements to the Commission’s guidance materials and training offerings.
It is anticipated that the Gender Equality Action Plan Review report will be published toward the end of 2022.
Resourcing workplace gender audits and Gender Equality Action Plan implementation
Recent research undertaken for the Commission has explored the capacity of defined entities to meet their future obligations.226 The research found high levels of support among defined entities for the Act’s objectives as a powerful mechanism for improving gender equality. Many also expressed support for the Commission and Commissioner as critical enablers for success in promoting gender equality and cultural change in Victoria.
However, the research also found a common experience among research participants was that there had been little consideration of the long-term resourcing required to meet their organisation’s obligations under the Act. For some entities, resources allocated to the audit process and development of their GEAPs were short-term, with no commitment from leadership teams to securing ongoing staff to support implementation. There was concern expressed by some staff that their organisations had underestimated the amount of work required to implement their obligations under the Act, and that there was an expectation that ongoing resourcing would not be required after the initial stage of implementation.227
Pressures from under-resourcing were compounded by disruptions from the COVID-19 pandemic, particularly in the health and local government sectors, where staff and resources were diverted to other areas. The COVID-19 pandemic further disrupted implementation of the Act by limiting the opportunity for best-practice consultation in some organisations.228
The research also found that the workforce tasked with implementing the Act within defined entities is highly feminised. The bulk of the work was often delegated to women working in temporary, insecure and often junior positions, and under challenging conditions sometimes without sufficient support from their organisations.229 The highly feminised nature of the Act’s implementation workforce in defined entities also meant that many of these staff were disproportionately impacted by the COVID-19 pandemic creating additional challenges through increased care-giving, home-learning and other unpaid responsibilities.230
While the Commission recognises that some defined entities are operating with limited funding and that for many, these new obligations occurred during a time of significant uncertainty and disruption, it is a requirement under the Act that all defined entities ensure that adequate levels of resourcing are applied to the task of implementing the Act in their workplaces.
Given the volume of ongoing work involved in leading organisation-wide change such as will be required by many organisations under the Act, this important work cannot adequately be delegated to staff in temporary, insecure, and junior positions. In addition to ensuring sufficient staffing resources, most defined entities will need to allocate a separate program budget to implement GEAPs in order to meet the obligation to make reasonable and material process on all the Act’s gender equality indicators in every 2-year period.
Driving gender equality for all Victorians and inspiring change
The Act represents an ambitious step up in equality law in Australia. It imposes a positive duty to consider and promote gender equality on defined entities and is the first piece of Australian legislation to officially acknowledge intersectionality. Importantly, the Act mandates a level of organisational transparency about progress on gender equality that has not previously been required in by organisations in Victoria, or the rest of Australia.
A focus on transparent data reporting is designed to drive progress on gender equality both in organisations covered by the Act and beyond. It does this by facilitating knowledge-sharing and innovation across organisations and creating competitive pressure between them to make material progress. A transparent approach also builds trust between government, organisations and the public by allowing equal access to data and information regarding the state and nature of gender equality in public sector organisations, local councils and universities.
This Baseline report represents an important part of this commitment to transparency. What it has demonstrated is that while organisations covered by the Act are further along the road to gender equality in some areas than the private sector nationally, there is still a long way to go for gender equality to be fully realised. Publicly reporting on the Commission’s workplace gender audit data contributes to an ongoing dialogue around how defined entities are tracking on their journeys toward gender equality, how they can make progress towards this goal and how to measure that progress.
In presenting this data, the Commission also seeks to inspire other jurisdictions on the road towards promoting gender equality in their organisations and communities.
References
- The compliance check review process included:
- an initial compliance check review of all submissions;
- a quality assurance spot check of compliant GEAPs across sectors;
- a second review of all non-compliant GEAPs;
- a Commissioner (or expert delegate) third and final review where there were multiple compliance failures found in a GEAP.
- Gender Equality Act 2020 (Vic), s 10(3).
- Action for Gender Equality Partnership (AGEP), Report for the Commission for Gender Equality in the Public Sector: Defined entity educational strategy for gender impact assessments, AGEP, 2022, accessed 2 August 2022, p. 28; L Ryan, A Blackham, S Ainsworth, L Ruppanner, B Gaze & E Yang, Laying the Foundation for Gender Equality in the Public Sector in Victoria: Final Project Report, University of Melbourne, 2022, doi: 10.26188/19254539, pp 14-15.
- Ryan et al., Laying the Foundation, pp 14-15.
- AGEP, Report for the Commission for Gender Equality in the Public Sector, p 3; Ryan et al., Laying the Foundation, p 15-16.
- AGEP, Report for the Commission for Gender Equality in the Public Sector, p 39; Ryan et al., Laying the Foundation, pp 16-17.
- Ryan et al., Laying the Foundation, pp 16-17.
Glossary
This page provides a glossary of key terms used throughout this baseline report.
Bullying
Repeated unreasonable behaviour directed at an employee that creates a risk to their health and safety.
Career development training
Career development training opportunities assist staff to progress their careers by building on their capacity and skills through specific training. This may include training opportunities that are specifically designed for preparing staff for career progression or promotion within a defined entity.
Complaint/complainant
A complainant is an employee, member of the governing body, or member of the public who made a formal complaint of sexual harassment in a workplace or work-related setting. The complaint may be made internally with an employer or with an external agency. The complaint must have arisen in the workplace or as part of external workplace activities.
Classification (level)
The classification is the grade or level of the employee within a defined entity. For the purposes of this reporting, classification was separated by reporting levels from the most senior level in a defined entity, for example CEO or equivalent.
Defined entities
The Act applies to defined entities that have 50 or more employees, including: public service bodies, public entities, special bodies, local councils, universities, Court Services Victoria and the Office of Public Prosecutions (s5(1)). A full list of defined entities is available at https://www.genderequalitycommission.vic.gov.au/list-defined-entities
Discrimination
When a person treats, or proposes to treat, a person unfavourably because of a personal characteristic or attribute.
Employee
Section 3 of the Act defines an employee as follows: an employee, of a defined entity, means a person employed by the defined entity on a full-time, part-time, casual or fixed term basis (including an apprentice or trainee) but does not include:
- a contractor or subcontractor; or
- an outworker; or
- a person on a vocational placement; or
- a student gaining work experience; or
- a volunteer.
Employment basis
Whether a person is employed on a full-time, part-time, casual, ongoing/permanent or fixed term/contract basis (including an apprentice or trainee).
Exits
People who ceased employment, including both voluntary and involuntary terminations.
Flexible working arrangements
Access to one or more of the following arrangements, as chosen by the employee:
- Working more hours over fewer days
- Flexible start and finish times
- Working remotely (negotiated by the employee – i.e. not as a requirement under COVID-19 restrictions)
- Working part-time (negotiated by the employee only)
- Shift swap
- Job sharing
- Study leave
- Purchased leave
- Using leave to work flexible hours
Part-time or remote working arrangements that were mandated or instigated by the employer or by government requirements related to COVID-19 restrictions are not considered flexible work.
Governing body
A governing body is a group of people governing the operations of a defined entity, such as a board, council, or committee of management. If there are multiple boards or sub-committees of management, the most senior governing body was chosen for the purposes of this reporting. For local government, the governing body of a defined entity was the Councillors of a local government area. Not all defined entities have a governing body.
Higher duties
People who engaged in temporary internal arrangements where an employee moves into a higher classification for a period of more than two weeks.
Intersectionality
Intersectional gender inequality is the recognition that gender inequality may be compounded by other forms of disadvantage or discrimination that a person may experience based on Aboriginality, age, disability, ethnicity, gender identity, race, religion, sexual orientation and other attributes. Consideration of intersectionality is an object of the Act under section 4(c).
Promotions
People who were appointed to a role at a higher classification than their previous role. This includes promotions awarded through competitive recruitment processes as well as those awarded after a fixed period. It does not include lateral transfers (at the same classification) or temporary higher duties opportunities.
Parental leave
Both paid and unpaid leave, which may be classified as primary carer’s / maternity / birth parent leave or partner / secondary carer’s parental leave. This also includes adoption or surrogacy-related leave.
Recruitment
People who have been newly appointed to a role from both internal and external recruitment processes. It doesn’t include people who have been promoted.
Senior leadership
Defined using a combination of classification level data and occupation data (according to the Australian and New Zealand Standard Classification of Occupations (ANZSCO) classification codes). Those in the top two classification levels of an organisation with occupations classified as ‘Managers’ or ‘Professionals’ in accordance with the ANZSCO classification codes were considered to hold senior leadership positions.
Self-described gender
For the purposes of the 2021 workplace gender audit, the Commission collected data within three categories – women, men and self-described gender. Gender is part of how someone understands who they are and how they interact with other people. Many people identify their gender as being ‘woman’ or ‘man’. Some people understand their gender as a combination of these or neither. Gender can be expressed in different ways, such as through behaviour or physical appearance. A person’s gender does not necessarily mean they have particular sex characteristics or a particular sexuality, or vice versa. The Commission recommended allowing an option for self-described gender with a free text option, in addition to ‘woman’ and ‘man’ when collecting gender data. For those people who identify with a self-described gender, their gender should have been recorded in relevant systems using the term(s) provided by the employee.
This report refers to people of self-described gender as a group however, the Commission acknowledges that an individual with a self-described gender may identify as non-binary, trans, gender diverse, agender, qenderqueer, genderfluid or using any other term. For more information on gender-inclusive language, please refer to: https://www.vic.gov.au/inclusive-language-guide.
Sexual harassment
Non-consensual or unwelcome sexual behaviour that could be expected to make a person feel offended, humiliated or intimidated. Sexual harassment may be physical, spoken or written and can be directed at, and perpetrated by, persons of any sex or gender. A single incident can constitute sexual harassment, as can a broader pattern of behaviour.
Secondments
People who engaged in temporary internal arrangements where an employee moves into another role at the same classification for a period of more than two weeks.
Appendix 1
List of entities covered under the Gender Equality Act 2020 and their industry grouping.
|
Organisation |
Industry grouping (baseline report) |
|
Accident Compensation Conciliation Service |
Other |
|
Albury Wodonga Health |
Public health care |
|
Alexandra District Health |
Public health care |
|
Alfred Health |
Public health care |
|
Alpine Health |
Public health care |
|
Alpine Shire Council |
Local government |
|
Ambulance Victoria |
Police and emergency services |
|
AMES Australia |
TAFE and other education |
|
Ararat Rural City Council |
Local government |
|
Austin Health |
Public health care |
|
Australian Catholic University |
Universities |
|
Australian Centre for the Moving Image |
Arts |
|
Australian Grand Prix Corporation |
Sport and recreation |
|
Bairnsdale Regional Health Service |
Public health care |
|
Ballarat City Council |
Local government |
|
Ballarat Health Services |
Public health care |
|
Banyule City Council |
Local government |
|
Barwon Asset Solutions Pty Ltd |
Water and land management |
|
Barwon Coast Committee of Management |
Water and land management |
|
Barwon Health |
Public health care |
|
Barwon Region Water Corporation |
Water and land management |
|
Bass Coast Health |
Public health care |
|
Bass Coast Shire Council |
Local government |
|
Baw Baw Shire Council |
Local government |
|
Bayside City Council |
Local government |
|
Beaufort and Skipton Health Service |
Public health care |
|
Beechworth Health Service |
Public health care |
|
Benalla Health |
Public health care |
|
Benalla Rural City Council |
Local government |
|
Bendigo Health Care Group |
Public health care |
|
Bendigo Kangan Institute |
TAFE and other education |
|
Boort District Health |
Public health care |
|
Boroondara City Council |
Local government |
|
Borough of Queenscliffe |
Local government |
|
Box Hill Institute |
TAFE and other education |
|
BreastScreen Victoria |
Public health care |
|
Brimbank City Council |
Local government |
|
Buloke Shire Council |
Local government |
|
Campaspe Shire Council |
Local government |
|
Cardinia Shire Council |
Local government |
|
Casey City Council |
Local government |
|
Casterton Memorial Hospital |
Public health care |
|
CenITex |
Victorian Public Service |
|
Central Gippsland Health Service |
Public health care |
|
Central Gippsland Region Water Corporation |
Water and land management |
|
Central Goldfields Shire Council |
Local government |
|
Central Highlands Region Water Corporation |
Water and land management |
|
Central Highlands Rural Health |
Public health care |
|
Chisholm Institute |
TAFE and other education |
|
Cladding Safety Victoria |
Victorian Public Service |
|
Cohuna District Hospital |
Public health care |
|
Colac Area Health |
Public health care |
|
Colac Otway Shire Council |
Local government |
|
Coliban Region Water Corporation |
Water and land management |
|
Commercial Passenger Vehicles Victoria |
Victorian Public Service |
|
Commission for Children and Young People |
Victorian Public Service |
|
Corangamite Shire Council |
Local government |
|
Corryong Health |
Public health care |
|
Country Fire Authority |
Police and emergency services |
|
Court Services Victoria |
Victorian Public Service |
|
Darebin City Council |
Local government |
|
Deakin University |
Universities |
|
Dental Health Services Victoria |
Public health care |
|
Department of Education and Training |
Victorian Public Service |
|
Department of Environment, Land, Water and Planning |
Victorian Public Service |
|
Department of Families, Fairness and Housing |
Victorian Public Service |
|
Department of Health |
Victorian Public Service |
|
Department of Jobs, Precincts and Regions |
Victorian Public Service |
|
Department of Justice and Community Safety |
Victorian Public Service |
|
Department of Premier and Cabinet |
Victorian Public Service |
|
Department of Transport |
Victorian Public Service |
|
Department of Treasury and Finance |
Victorian Public Service |
|
Departments of Parliament |
Other |
|
Development Victoria |
Water and land management |
|
East Gippsland Region Water Corporation |
Water and land management |
|
East Gippsland Shire Council |
Local government |
|
East Grampians Health Service |
Public health care |
|
East Wimmera Health Service |
Public health care |
|
Eastern Health |
Public health care |
|
Echuca Regional Health |
Public health care |
|
Edenhope and District Memorial Hospital |
Public health care |
|
Emerald Tourist Railway Board |
Sport and recreation |
|
Emergency Services Superannuation Board |
Victorian Public Service |
|
Emergency Services Telecommunications Authority |
Police and emergency services |
|
Energy Safe Victoria |
Other |
|
Environment Protection Authority |
Victorian Public Service |
|
Essential Services Commission |
Victorian Public Service |
|
Falls Creek Alpine Resort Management Board |
Water and land management |
|
Federation University |
Universities |
|
Fire Rescue Victoria |
Police and emergency services |
|
Frankston City Council |
Local government |
|
Gannawarra Shire Council |
Local government |
|
Geelong Performing Arts Centre Trust |
Arts |
|
Gippsland and Southern Rural Water Corporation |
Water and land management |
|
Gippsland Institute of TAFE |
TAFE and other education |
|
Gippsland Ports Committee of Management |
Water and land management |
|
Gippsland Southern Health Service |
Public health care |
|
Glen Eira City Council |
Local government |
|
Glenelg Shire Council |
Local government |
|
Golden Plains Shire Council |
Local government |
|
Gordon Institute of TAFE |
TAFE and other education |
|
Goulburn Broken Catchment Management Authority |
Water and land management |
|
Goulburn Murray Rural Water Corporation |
Water and land management |
|
Goulburn Ovens Institute of TAFE |
TAFE and other education |
|
Goulburn Valley Health Services |
Public health care |
|
Goulburn Valley Region Water Corporation |
Water and land management |
|
Grampians Wimmera Mallee Water Corporation |
Water and land management |
|
Great Ocean Road Coast and Parks Authority |
Water and land management |
|
Great Ocean Road Health |
Public health care |
|
Greater Bendigo City Council |
Local government |
|
Greater Dandenong City Council |
Local government |
|
Greater Geelong City Council |
Local government |
|
Greater Metropolitan Cemeteries Trust |
Other |
|
Greater Shepparton City Council |
Local government |
|
Greater Western Water |
Water and land management |
|
Greyhound Racing Victoria |
Sport and recreation |
|
Harness Racing Victoria |
Sport and recreation |
|
Health Purchasing Victoria |
Public health care |
|
Heathcote Health |
Public health care |
|
Hepburn Shire Council |
Local government |
|
Hesse Rural Health Service |
Public health care |
|
Heywood Rural Health |
Public health care |
|
Hindmarsh Shire Council |
Local government |
|
Hobsons Bay City Council |
Local government |
|
Holmesglen Institute |
TAFE and other education |
|
Horsham Rural City Council |
Local government |
|
Hume City Council |
Local government |
|
Independent Broad-based Anti-corruption Commission |
Victorian Public Service |
|
Indigo Shire Council |
Local government |
|
Inglewood and Districts Health Service |
Public health care |
|
Kerang District Health |
Public health care |
|
Kilmore District Health |
Public health care |
|
Kingston City Council |
Local government |
|
Knox City Council |
Local government |
|
Kooweerup Regional Health Service |
Public health care |
|
Kyabram and District Health Service |
Public health care |
|
La Trobe University |
Universities |
|
Latrobe City Council |
Local government |
|
Latrobe Regional Hospital |
Public health care |
|
Loddon Shire Council |
Local government |
|
Lower Murray Urban and Rural Water Corporation |
Water and land management |
|
Macedon Ranges Shire Council |
Local government |
|
Major Transport Infrastructure Authority |
Victorian Public Service |
|
Mallee Catchment Management Authority |
Water and land management |
|
Mallee Track Health and Community Service |
Public health care |
|
Manningham City Council |
Local government |
|
Mansfield District Hospital |
Public health care |
|
Mansfield Shire Council |
Local government |
|
Maribyrnong City Council |
Local government |
|
Maroondah City Council |
Local government |
|
Maryborough District Health Service |
Public health care |
|
Melbourne and Olympic Parks Trust |
Sport and recreation |
|
Melbourne City Council |
Local government |
|
Melbourne Convention and Exhibition Trust |
Other |
|
Melbourne Health |
Public health care |
|
Melbourne Polytechnic |
TAFE and other education |
|
Melbourne Recital Centre |
Arts |
|
Melbourne Water Corporation |
Water and land management |
|
Melton City Council |
Local government |
|
Mildura Base Public Hospital |
Public health care |
|
Mildura Rural City Council |
Local government |
|
Mitchell Shire Council |
Local government |
|
Moira Shire Council |
Local government |
|
Monash City Council |
Local government |
|
Monash Health |
Public health care |
|
Monash University |
Universities |
|
Moonee Valley City Council |
Local government |
|
Moorabool Shire Council |
Local government |
|
Moreland City Council |
Local government |
|
Mornington Peninsula Shire Council |
Local government |
|
Mount Alexander Shire Council |
Local government |
|
Mount Buller and Mount Stirling Alpine Resort Management Board |
Water and land management |
|
Mount Hotham Resort Management Board |
Water and land management |
|
Moyne Health Services |
Public health care |
|
Moyne Shire Council |
Local government |
|
Murrindindi Shire Council |
Local government |
|
Museums Victoria |
Arts |
|
National Gallery of Victoria |
Arts |
|
NCN Health |
Public health care |
|
Nillumbik Shire Council |
Local government |
|
North Central Catchment Management Authority |
Water and land management |
|
North East Region Water Corporation |
Water and land management |
|
Northeast Health Wangaratta |
Public health care |
|
Northern Grampians Shire Council |
Local government |
|
Northern Health |
Public health care |
|
Office of Public Prosecutions |
Victorian Public Service |
|
Office of the Legal Services Commissioner |
Victorian Public Service |
|
Office of the Ombudsman Victoria |
Victorian Public Service |
|
Office of the Victorian Electoral Commissioner |
Victorian Public Service |
|
Office of the Victorian Information Commissioner |
Victorian Public Service |
|
Omeo District Health |
Public health care |
|
Orbost Regional Health |
Public health care |
|
Parks Victoria |
Water and land management |
|
Peninsula Health |
Public health care |
|
Peter MacCallum Cancer Centre |
Public health care |
|
Phillip Island Nature Park Board of Management |
Sport and recreation |
|
Port Phillip City Council |
Local government |
|
Portland District Health |
Public health care |
|
Ports Victoria |
Transport |
|
Public Record Office Victoria |
Victorian Public Service |
|
Pyrenees Shire Council |
Local government |
|
RMIT University |
Universities |
|
Robinvale District Health Services |
Public health care |
|
Rochester and Elmore District Health Service |
Public health care |
|
Royal Botanic Gardens Board |
Sport and recreation |
|
Royal Children's Hospital |
Public health care |
|
Royal Victorian Eye and Ear Hospital |
Public health care |
|
Royal Women's Hospital |
Public health care |
|
Rural Northwest Health |
Public health care |
|
Safer Care Victoria |
Victorian Public Service |
|
Service Victoria |
Victorian Public Service |
|
Seymour Health |
Public health care |
|
South East Water Corporation |
Water and land management |
|
South Gippsland Hospital |
Public health care |
|
South Gippsland Region Water Corporation |
Water and land management |
|
South Gippsland Shire Council |
Local government |
|
South West Healthcare |
Public health care |
|
South West Institute of TAFE |
TAFE and other education |
|
Southern Alpine Resort Management Board |
Water and land management |
|
Southern Grampians Shire Council |
Local government |
|
Southern Metropolitan Cemeteries Trust |
Other |
|
State Library of Victoria |
Arts |
|
State Revenue Office |
Victorian Public Service |
|
State Sport Centres Trust |
Sport and recreation |
|
State Trustees Limited |
Finance and insurance |
|
Stawell Regional Health |
Public health care |
|
Stonnington City Council |
Local government |
|
Strathbogie Shire Council |
Local government |
|
Suburban Rail Loop Authority |
Victorian Public Service |
|
Sunraysia Institute of TAFE |
TAFE and other education |
|
Surf Coast Shire Council |
Local government |
|
Sustainability Victoria |
Victorian Public Service |
|
Swan Hill District Health |
Public health care |
|
Swan Hill Rural City Council |
Local government |
|
Swinburne University of Technology |
Universities |
|
Tallangatta Health Service |
Public health care |
|
Terang and Mortlake Health Service |
Public health care |
|
The Queen Elizabeth Centre |
Public health care |
|
Timboon and District Healthcare Service |
Public health care |
|
Towong Shire Council |
Local government |
|
Transport Accident Commission |
Finance and insurance |
|
Treasury Corporation of Victoria |
Finance and insurance |
|
Trust for Nature (Victoria) |
Water and land management |
|
Tweddle Child and Family Health Service |
Public health care |
|
University of Melbourne |
Universities |
|
VicForests |
Water and land management |
|
Victoria Legal Aid |
Other |
|
Victoria Police |
Police and emergency services |
|
Victoria State Emergency Service |
Police and emergency services |
|
Victoria University |
Universities |
|
Victorian Arts Centre Trust |
Arts |
|
Victorian Auditor-General's Office |
Victorian Public Service |
|
Victorian Building Authority |
Other |
|
Victorian Commission for Gambling and Liquor Regulation |
Victorian Public Service |
|
Victorian Equal Opportunity and Human Rights Commission |
Victorian Public Service |
|
Victorian Fisheries Authority |
Victorian Public Service |
|
Victorian Funds Management Corporation |
Finance and insurance |
|
Victorian Government Solicitor's Office |
Victorian Public Service |
|
Victorian Health Promotion Foundation |
Public health care |
|
Victorian Institute of Forensic Medicine |
Victorian Public Service |
|
Victorian Institute of Forensic Mental Health |
Public health care |
|
Victorian Institute of Sport |
Sport and recreation |
|
Victorian Institute of Teaching |
TAFE and other education |
|
Victorian Managed Insurance Authority |
Finance and insurance |
|
Victorian Planning Authority |
Water and land management |
|
Victorian Public Sector Commission |
Victorian Public Service |
|
Victorian Rail Track Corporation |
Transport |
|
Victorian Responsible Gambling Foundation |
Victorian Public Service |
|
Victorian WorkCover Authority |
Finance and insurance |
|
Visit Victoria |
Sport and recreation |
|
VLine Corporation |
Transport |
|
Wangaratta Rural City Council |
Local government |
|
Wannon Region Water Corporation |
Water and land management |
|
Warrnambool City Council |
Local government |
|
Wellington Shire Council |
Local government |
|
West Gippsland Healthcare Group |
Public health care |
|
West Wimmera Health Service |
Public health care |
|
West Wimmera Shire Council |
Local government |
|
Western District Health Service |
Public health care |
|
Western Health |
Public health care |
|
Westernport Region Water Corporation |
Water and land management |
|
Whitehorse City Council |
Local government |
|
Whittlesea City Council |
Local government |
|
William Angliss Institute of TAFE |
TAFE and other education |
|
Wimmera Health Care Group |
Public health care |
|
Wodonga City Council |
Local government |
|
Wodonga Institute of TAFE |
TAFE and other education |
|
Wyndham City Council |
Local government |
|
Yarra City Council |
Local government |
|
Yarra Ranges Shire Council |
Local government |
|
Yarra Valley Water Corporation |
Water and land management |
|
Yarram and District Health Service |
Public health care |
|
Yarrawonga Health |
Public health care |
|
Yarriambiack Shire Council |
Local government |
|
Yea and District Memorial Hospital |
Public health care |
|
Zoological Parks and Gardens Board |
Sport and recreation |