

Introduction
Established internationally as a measure of women’s position within the paid economy compared to men’s, a gender pay gap is the difference between the average earnings of women and men who are in the paid workforce.66 Historically, gender pay gap data has only been collected and reported in a binary way, recognising only men and women and excluding gender diverse individuals.
Pay gaps are measured for a country’s workforce as a whole and for particular jurisdictions. They are also measured at an industry, occupational and organisational level, as well as at various levels and employment types within an organisation.
While ‘like-for-like’ gender pay gaps can reflect unlawful unequal pay – that is, when people of different genders are paid differently when performing the same or comparable work – most jurisdiction-wide and organisation-wide gender pay gaps reflect a complex mix of economic and social factors that disadvantage women. These factors include conscious and unconscious discrimination in recruitment and pay decisions, interruptions to women’s careers, higher rates of part-time work for women, the unequal distribution of unpaid caring and domestic work, and gendered industrial and occupational segregation.67
Key issues: Why was this measured?
The gender pay gap in Victoria has risen
In 1972, the principle of ‘equal pay for equal work’ was established in Australia and in 1986 it was first enshrined in federal legislation. Despite this and other efforts to address the drivers of gender pay gaps, persistent gaps remain.
Victoria’s state-wide pay gap has generally been one of the lowest among Australian jurisdictions in recent years. For example, in November 2017, November 2018 and August 2019, Victoria’s gender pay gap was at 12.4%, 9.3% and 9.6% respectively, less than in Queensland (17.9% in 2017, 17.3% in 2018 and 16.6% in 2019), Western Australia (22.5% in 2017, 23.1% in 2018, and 21.8% in 2019) and the Northern Territory (20.6% in 2017, 15.5% in 2018 and 13.4% in 2019).69 However Victoria’s pay gap rose from 11.2% in November 2020 to 14.3% in 2021.70 This means that Victorian men earn $265.80 more per week on average than Victorian women, who earn on average $1,596.60 per week.71 As discussed in more detail below, this gap narrows across organisations covered under the Act.
Gender pay gaps have many contributing factors
As noted above, gender pay gaps contribute to, and are also driven by, many other forms of inequality. In Australia, conscious and unconscious gender discrimination remains the leading driver of gender pay gaps, accounting for 36% of the gap (down from 39% in 2017). This includes the undervaluation of women’s work, and bias in recruitment, promotion, and salary decisions. Career breaks (such as taking time out to have children or for other caring responsibilities) are an important contributor to the pay gap at 20%, as is part-time employment at 11%. Importantly, gender discrimination and stereotyped gender norms also influence other significant factors that drive the gender pay gap, such as industrial and occupational segregation, which together contribute 24%.72
Pay inequity impacts retirement savings
Pay inequity results in reduced earning capacity and economic insecurity for women over their lifetime, as well as reduced employee retention and productivity in the workplace. At the national level, women at the start of their careers experience a pay gap of 6% but as they progress through their careers to top management levels, the pay gap increases to a high of 18%.73
Despite women’s increasing participation in the workforce over generations, there is now a well-documented superannuation gender gap in Australia. Women approaching their retirement years, aged 60-64, have 28% less super than men, depending on how much time a woman has spent out of the workforce to care for children or other dependents.74 This gap is greatest in a woman’s peak earning years of 45-49 (when it reaches 35%) and in the pre-retirement years of 55-59 (when it is at 33%).75 While these gaps are expected to narrow substantially as the superannuation system matures, despite women making higher voluntary contributions,76 they are not likely to close while women continue to have lower workforce participation and earnings than men.77
More information on intersectionality is needed
It is important to acknowledge that, while a growing body of research has explored the relationship between age and pay inequality,78 there is a persistent lack of data on the impact of other intersectional attributes, such as Aboriginality, disability, ethnicity, gender identity, race, religion, and sexual orientation, on gender pay gaps in Australia. Greater understanding of how the intersections between diverse identities impact experiences of employment, economic security and leadership is crucial to a more sophisticated understanding of how to resolve gender pay gaps.79
What we do know is that in Australia, women with disability are less likely to be in paid employment and are paid less than men with disability and women without disability.80 We also know that women from culturally and linguistically diverse backgrounds are over-represented in low paid and insecure work, and that migrant women are 7% less likely to be employed than those born in Australia.81 It is also well established that older women and Aboriginal women are at greater risk of homelessness than older men, due to income inequality.82
How was this indicator measured?
The Act requires defined entities to report on their progress towards achieving equal remuneration for work of equal or comparable value across all levels of the workforce, irrespective of gender. 83 To meet this obligation, the Commission asked organisations to compile a dataset containing each employee's gender, their pay, and their level within the organisation. The level assignment process was left as open-ended as possible, in recognition that a strictly hierarchical approach is a poor fit for many organisations. The Commission asked that organisations assign the same classification to employees with similar seniority, levels of responsibility and reporting lines. From this, the workforce reporting template calculated the gender pay gap for the entire organisation, as well as by-level pay gaps for up to 30 levels defined by each organisation.
As defined entities share more about what makes a by-level classification scheme meaningful, the Commission plans to test new ways to harmonise these classifications across industry groups and, ultimately, the sector as a whole. While challenging to implement well, harmonised reporting is a win-win – organisations gain the ability to benchmark their performance against their peers, and the Commission gains a more robust dataset for future research and analysis.
Achieving gender pay equity within an organisation requires pay data analysis to uncover, understand and address the drivers of pay gaps. There are several ways to measure a pay gap. To improve consistency and comparability across defined entities, the Commission published audit guidance and data specifications in which organisations covered under the Act were asked to provide:
- base salary data on an annualised84 full-time equivalent basis.85 Base salary data includes salary payments, any packaged or salary sacrificed component, annual leave, leave loading, long service leave, workers compensation payments and penalty rates that are part of an employee’s ordinary working hours.
- total remuneration data, which combines base salary plus any additional benefits, such as fixed bonus payments (including performance pay), superannuation, fixed discretionary pay, overtime and penalty rates that are not part of an employee’s ordinary working hours, other allowances (such as first aid, clothing, meal, and study allowances) and other benefits (such as share allocations).
Collecting both sets of data allows for analysis of the impact of the unequal distribution of employment benefits beyond base salary.86
The mean is the ‘average’ value, found by adding all the amounts in a dataset and dividing the total by the number of values in the set.
The median is the ‘middle’ value when a dataset is ordered from least to greatest.
The Commission also calculated both mean and median pay gaps for each gender group. The mean (average) is more sensitive to outliers/extremes in the dataset (a few extremely high or low salaries). The median is the middle value when a dataset is ordered from lowest to highest. It is less sensitive to outliers or extremes in the dataset. The Commission used both the mean and the median so that it could compare workplace gender audit data with the data from other jurisdictions and sectors.
Fig. 2.1 Comparison of key oversight organisations’ gender pay gap calculation methods
| CGEPS data | VPSC data |
WGEA data |
|
|---|---|---|---|
| Which employers are included | Victorian public sector organisations, universities, and local councils – with 50 or more employees | Victorian public sector organisations (no size threshold) | Australian non-public sector organisations (including universities) with 100 or more employees |
| Type of pay data used to calculate published GPG | Full-time equivalent base salary and total remuneration for all employees |
Full-time equivalent base salary for non-executive employees, total remuneration for executive employees |
Full-time equivalent base salary and total remuneration for all employees |
| Type of average used to calculate published GPG | Mean and median | Median | Mean |
| Employees excluded from calculation of published GPG | None |
Casual employees (data is collected but not used in published GPG calculation) |
Remuneration data for CEOs and Heads of Business not required to be included |
It is also important to note that the pay gap results reported below are influenced by gender composition imbalances within an industry. For example, the overall gender pay gap will be higher in industries with a higher proportion of women at lower levels. Further, while pay gaps are calculated on the basis of annualised full-time equivalent remuneration, if fewer part-time roles are available at senior levels, and women are more likely to work on a part-time basis (due to their higher unpaid caring load 87 and because of a lack of workplace flexibility)88 this may contribute to a higher gender pay gap.
What was found: Key data insights
Sector-wide gender pay gaps
As at 30 June 2021, the median gender pay gap across all Victorian organisations covered by the Act was 6.1% (women’s median base salary was $87,200, compared to men’s median base salary of $92,900 - a difference of $5,700). This means that the typical woman working in the organisations covered by the Act would need to work an extra 22 days per year to earn the same base salary as a typical man working in the same organisations.
The overall median gender pay gap in defined entities was lower than that of most Organisation for Economic Co-operation and Development (OECD) nations with gender equality legislation, with a median gender pay gap of 16.1% for Canada, 14.3% for the United Kingdom, 12.9% for Iceland and 7.4% for Sweden. New Zealand however, has a 4.6% pay gap.89 It was also lower than the 9.3% median pay gap for 2021 calculated by the Victorian Public Sector Commission (VPSC).90 Public sector organisations covered by the VPSC differ slightly from defined entities under the Act, most notably because universities and local councils are not included, and because the VPSC includes public sector organisations with fewer than 50 employees. However, the overall pay gap in defined entities was almost triple that of the NSW public sector, where the gap between the median annual base remuneration of men and women was 2.2% ($2,053). It is noted however, that the NSW dataset does not include local councils or universities, so is not directly comparable.91
The gender pay gap widens when we consider total remuneration (which includes additional benefits such as superannuation and bonuses). As at 30 June 2021, the total remuneration gender pay gap across organisations covered by the Act was 8.1%, with women receiving $8,500 less per year in remuneration compared to men.
While there was a 14.3% average gender pay gap in terms of base salary, the average (mean) annualised pay gap in total remuneration was greater – being 15.6% or $19,000. In comparison, the total remuneration gender pay gap for non‑public sector organisations that report to Australia's Workplace Gender Equality Agency was 22.8%, or $25,792 per year.92
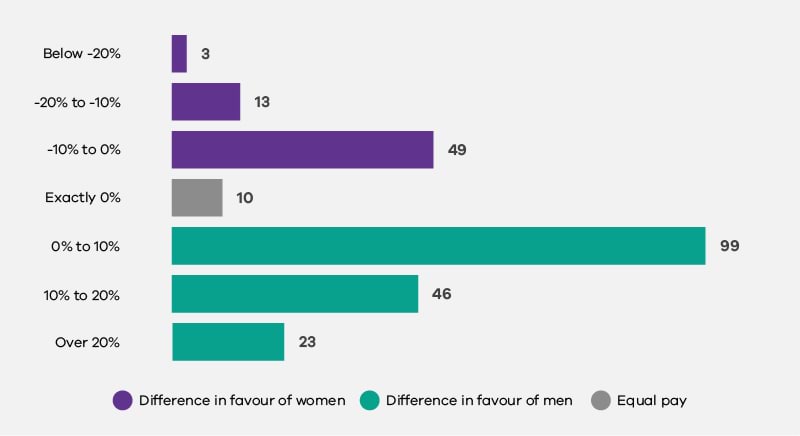
As set out in Figure 2.2, of the 243 defined entities that submitted remuneration data that met the Commission’s specifications, 69% had a median base salary pay gap in favour of men and 28% of organisations had a median base salary gender pay gap favouring men by 10% or more.
Only 7% of organisations had a median base salary gap wider than 10% in favour of women. The vast majority of pay gaps in favour of women (20% of all organisations) were between 0 and 10%.
Fig 2.2. Distribution of organisations' median base salary pay gaps

Pay gaps by occupation
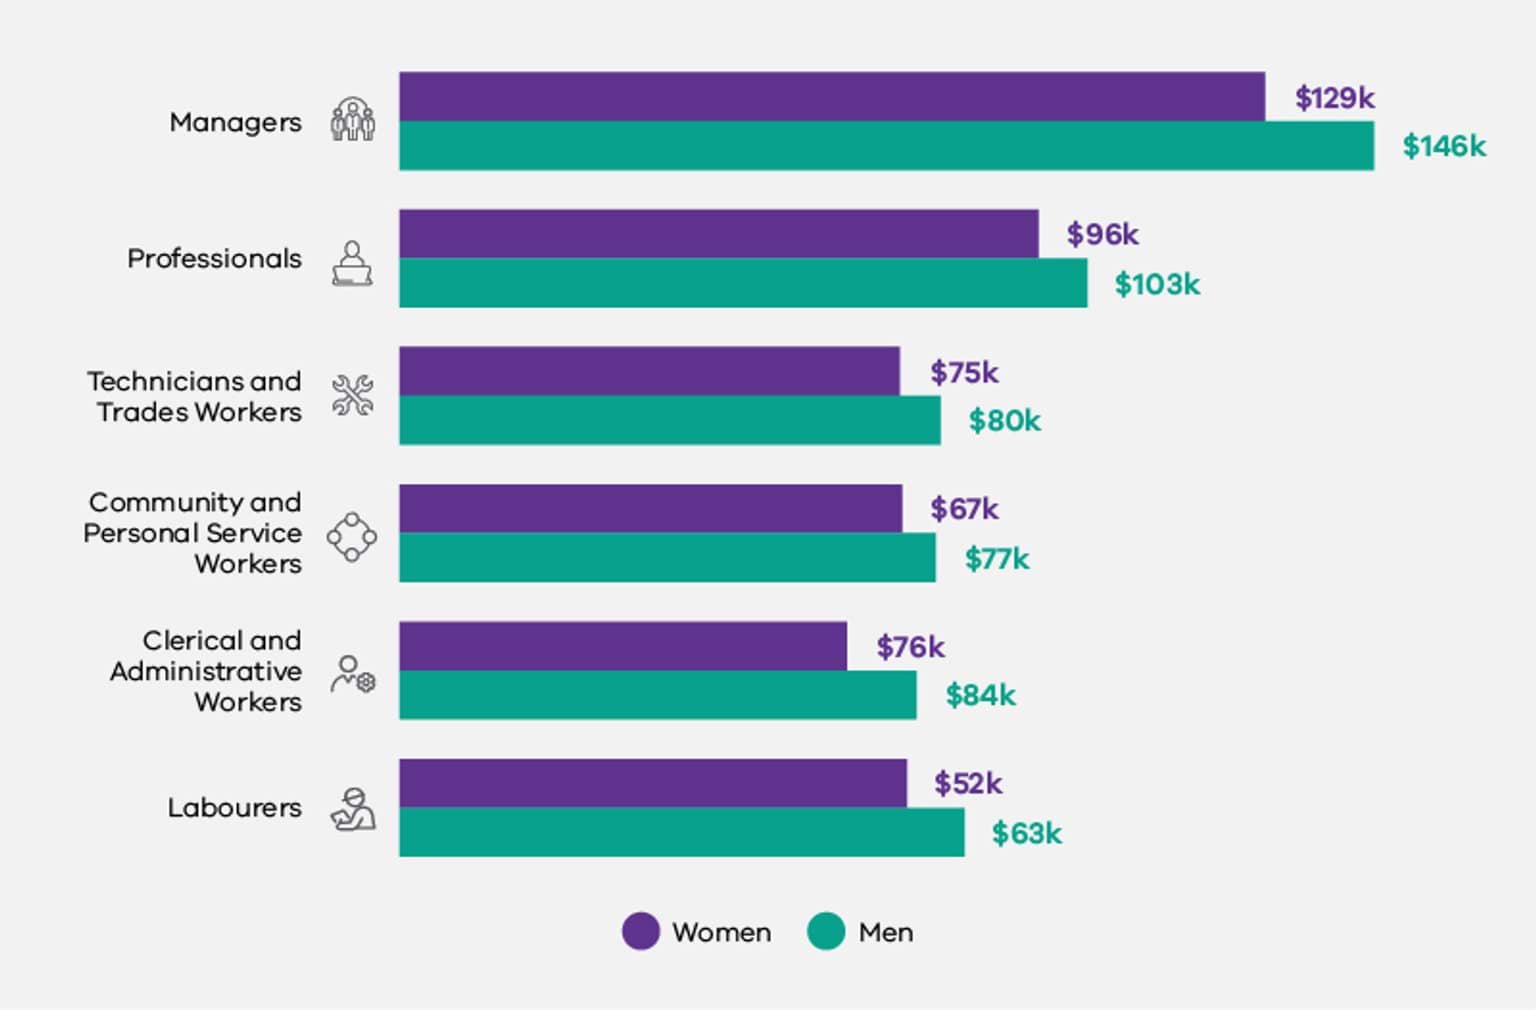
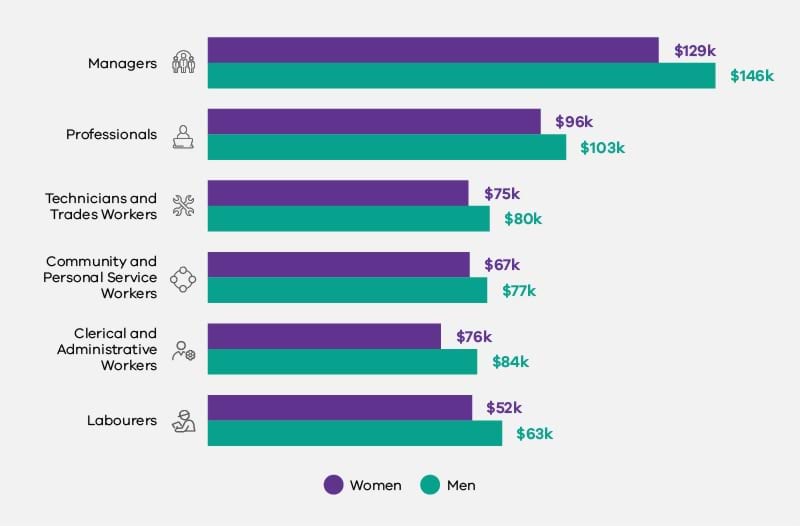
As shown in Figures 2.3 and 2.4, below, men were paid more than women within every occupation group, including Professionals and Managers, with median base salary gaps ranging from $5,100 to $16,700. This was the case even in those traditionally majority-women occupations such as Community and Personal Service Workers. The median base salary for women working in the latter occupation was 13.3% lower than for men – a difference of $10,200.
Fig 2.3. Median annualised base salary, by occupation group and gender
Fig. 2.4. Median base salary pay gap by occupation group
|
Occupation group* |
Median base salary pay gap |
|
|
Labourers |
17.7% |
$11,200 |
|
Community and Personal Service Workers |
13.3% |
$10,200 |
|
Managers |
11.6% |
$16,900 |
|
Clerical and Administrative Workers |
10.0% |
$8,500 |
|
Professionals |
6.9% |
$7,100 |
|
Technicians and Trades Workers |
6.4% |
$5,100 |
Notes: 1. Bolded figures represent the highest figures. 2. Occupation groups with small headcounts were not reported here (i.e., ‘Sales Workers’ and ‘Machine Operators and Drivers’) nor were individuals who were not assigned an occupation code by their employer.
As can be seen in Figure 2.4 above, the largest percentage pay gap was observed within the Labourers occupation. The median base salary for women working as labourers was 17.7% lower than for men – a difference of $11,200.
The largest pay gap in dollars was observed within the Managers occupation. The median base salary for women working as managers was 11.6% lower than for men – a difference of $16,900.
Interestingly, these findings do not align with occupational pay gaps in the private sector, where the largest percentage pay gaps were reflected in the Technicians and Trades Workers (27.7%) and Professional (18.2%) occupations.93 Notably, occupational full-time gender pay gaps are calculated across the WGEA dataset by management and non-management categories, with the widest pay gap in dollar amounts across both categories observed within the top three tiers of Manager categories.94
Pay gaps by industry
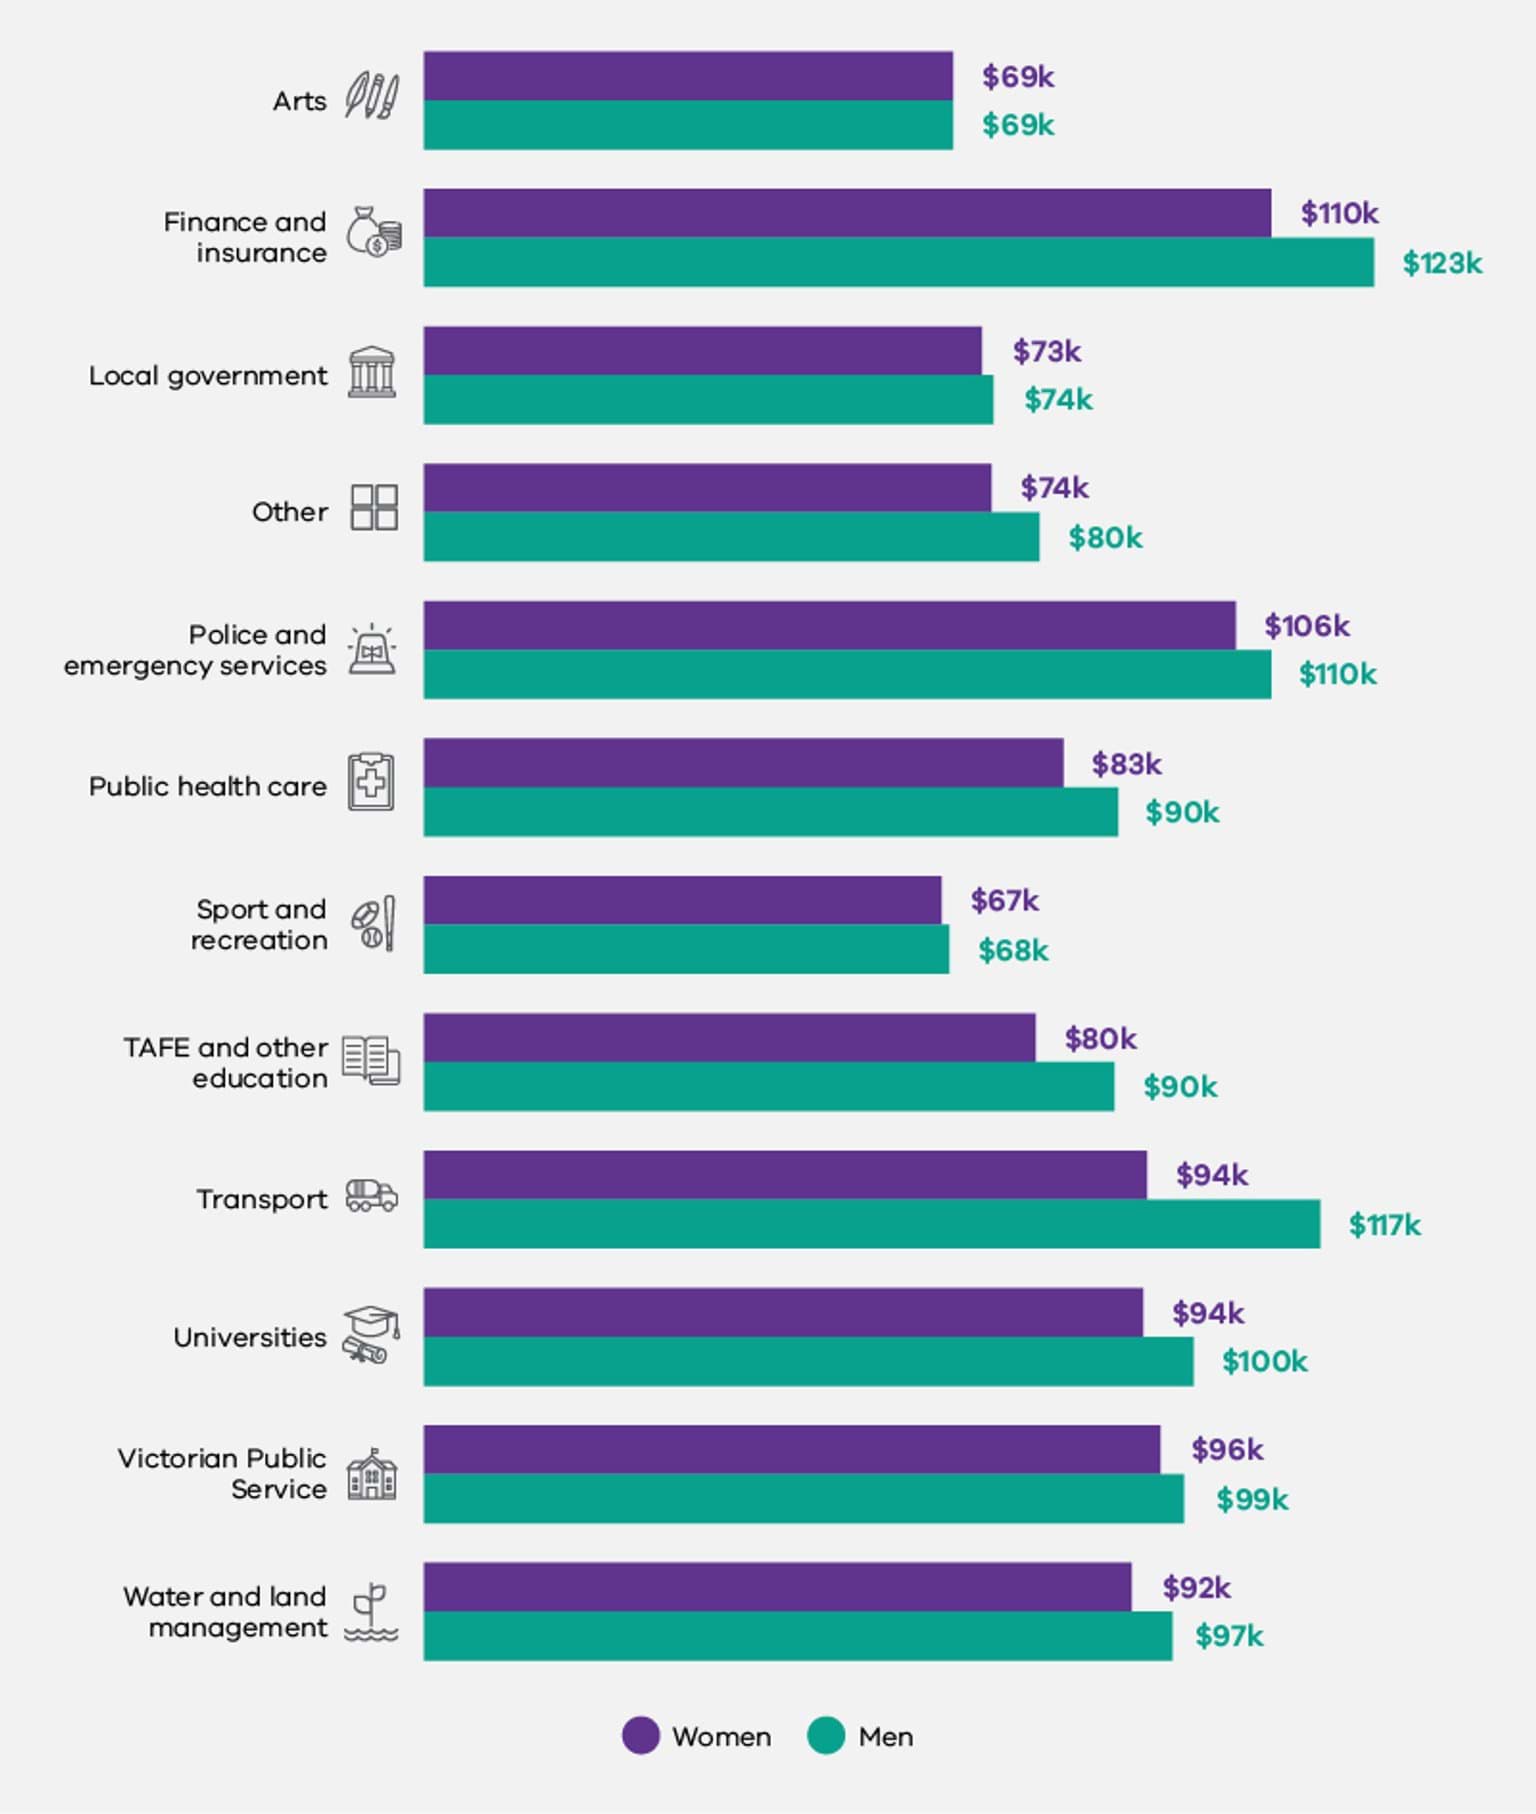
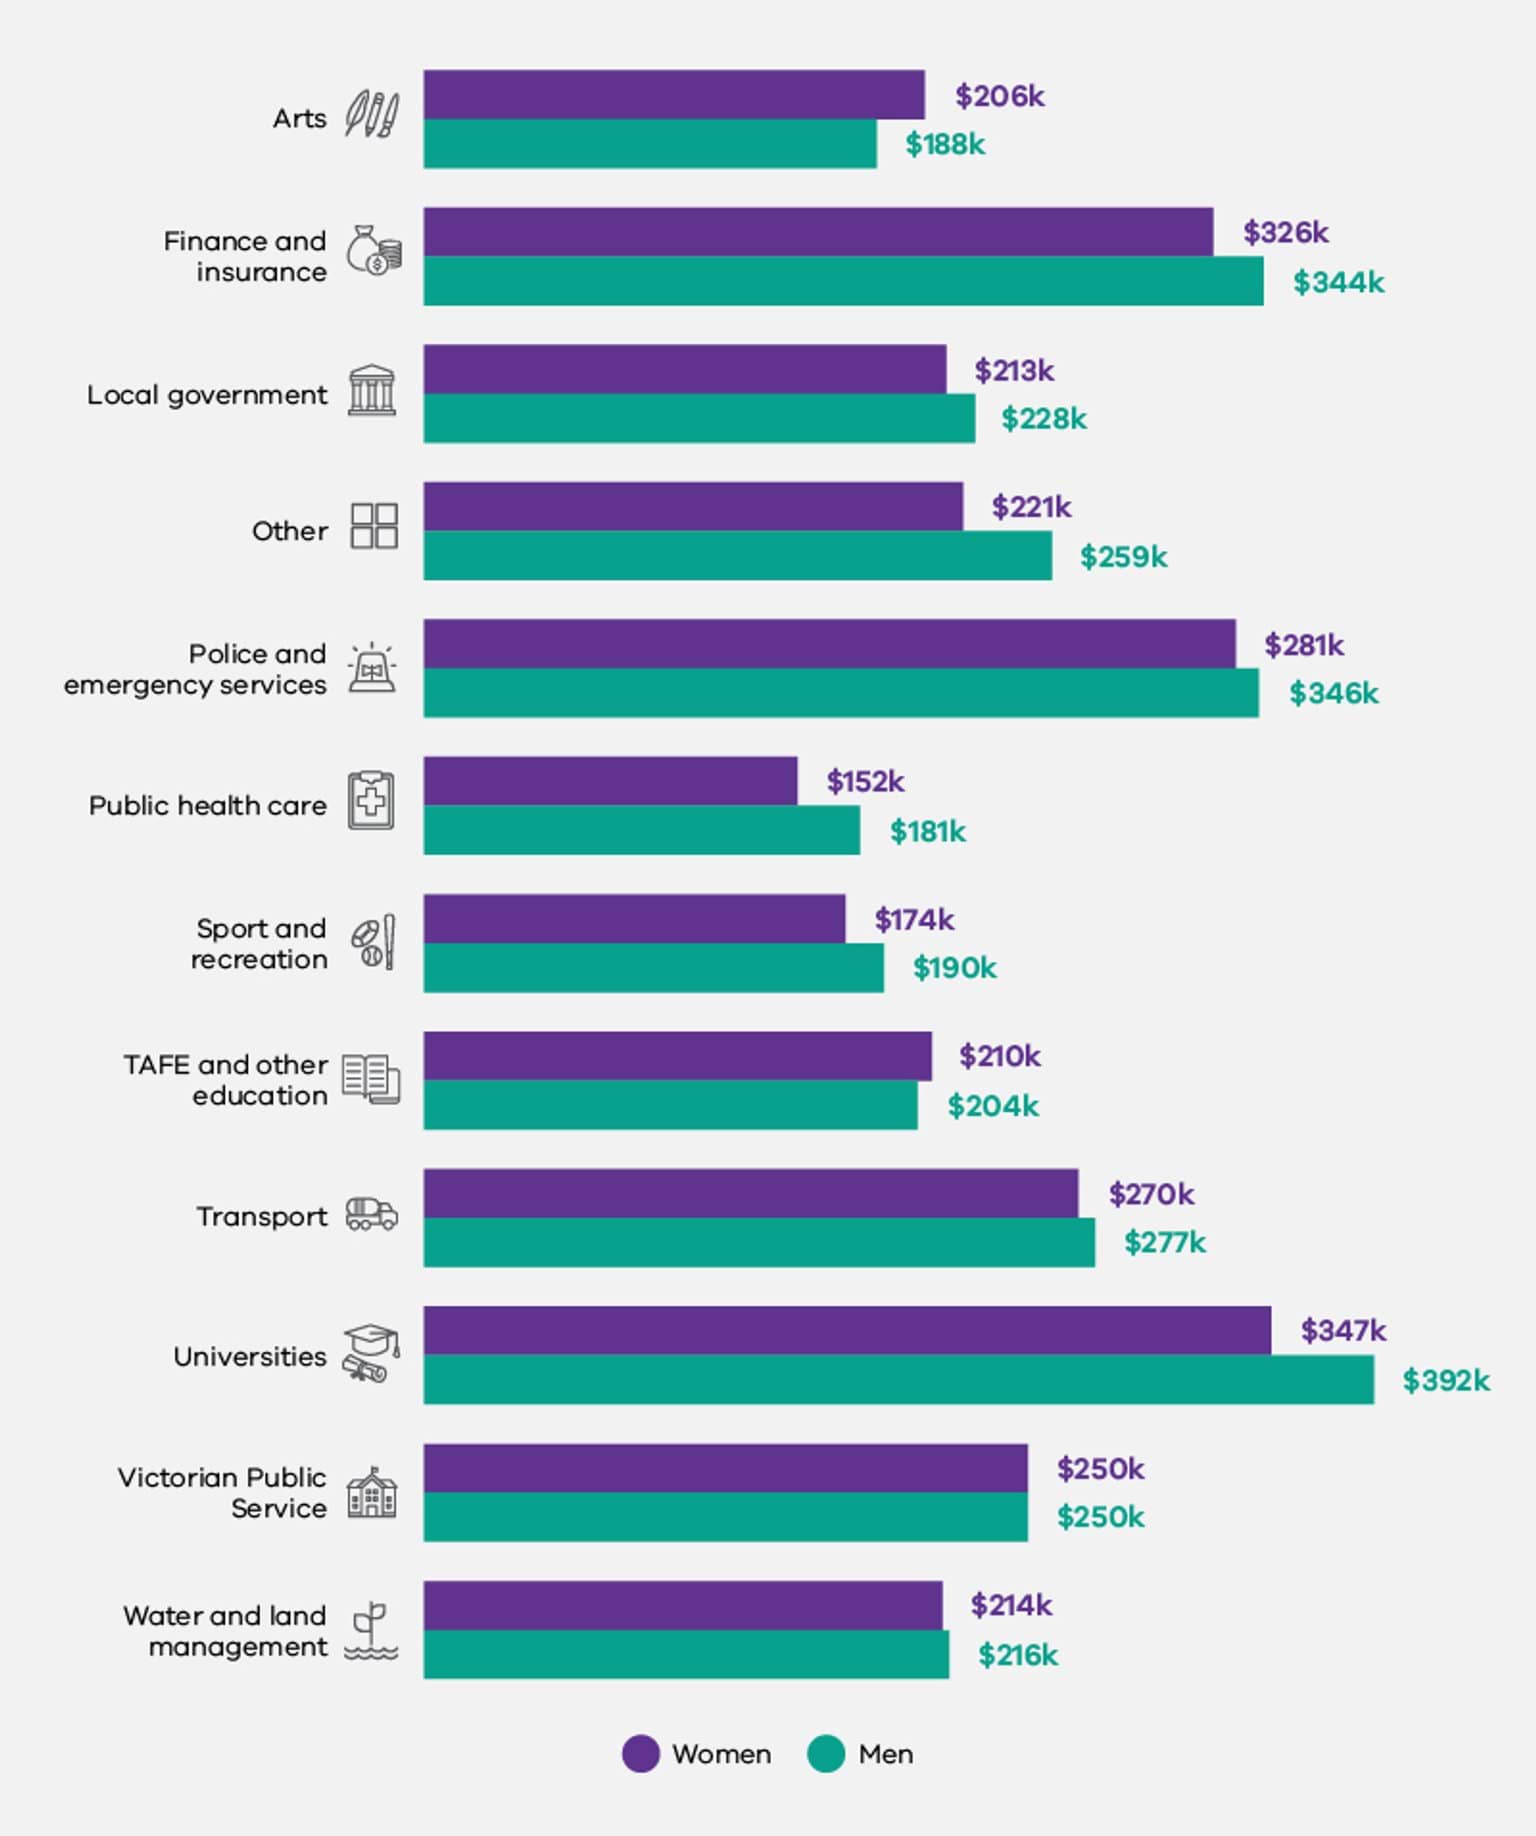
As shown in Figure 2.5 below, 11 out of 12 industry groups in the dataset had a pay gap in favour of men.
Fig 2.5. Median annualised base salary, by industry and gender
Significant and consistent pay gaps in favour of men were observed within organisations in 3 key industry groups: Transport, TAFE and Other Education, and Finance and Insurance (Figures 2.5 and 2.6). Significant but less consistent pay gaps were observed in the Public Health Care industry group. Consistent but less significant pay gaps were also observed in Universities and in the Police and Emergency Services industry group (Figures 2.5 and 2.6).
Fig. 2.6 Median base salary pay gap by industry group
|
Industry |
Median base salary pay gap |
Organisations with pay gaps in favour of men |
|
|
Transport |
19.4% |
$22,700 |
100% |
|
TAFE and other education |
11.2% |
$10,100 |
100% |
|
Finance and insurance |
11.1% |
$13,600 |
100% |
|
Public health care |
8.1% |
$7,300 |
61% |
|
Other |
7.6% |
$6,000 |
100% |
|
Universities |
6.6% |
$6,600 |
100% |
|
All industries |
6.1% |
$5,700 |
73% |
|
Water and land management |
5.4% |
$5,300 |
76% |
|
Police and emergency services |
3.7% |
$4,100 |
100% |
|
Victorian Public Service |
3.3% |
$3,300 |
91% |
|
Local government |
2.0% |
$1,500 |
58% |
|
Sport and recreation |
0.7% |
$500 |
91% |
|
Arts |
-0.2% |
-$200 |
57% |
Notes: 1. Bolded figures represent the highest figures. 2. Occupation groups with small headcounts were not reported here (i.e., ‘Sales Workers’ and ‘Machine Operators and Drivers’) nor were individuals who were not assigned an occupation code by their employer.
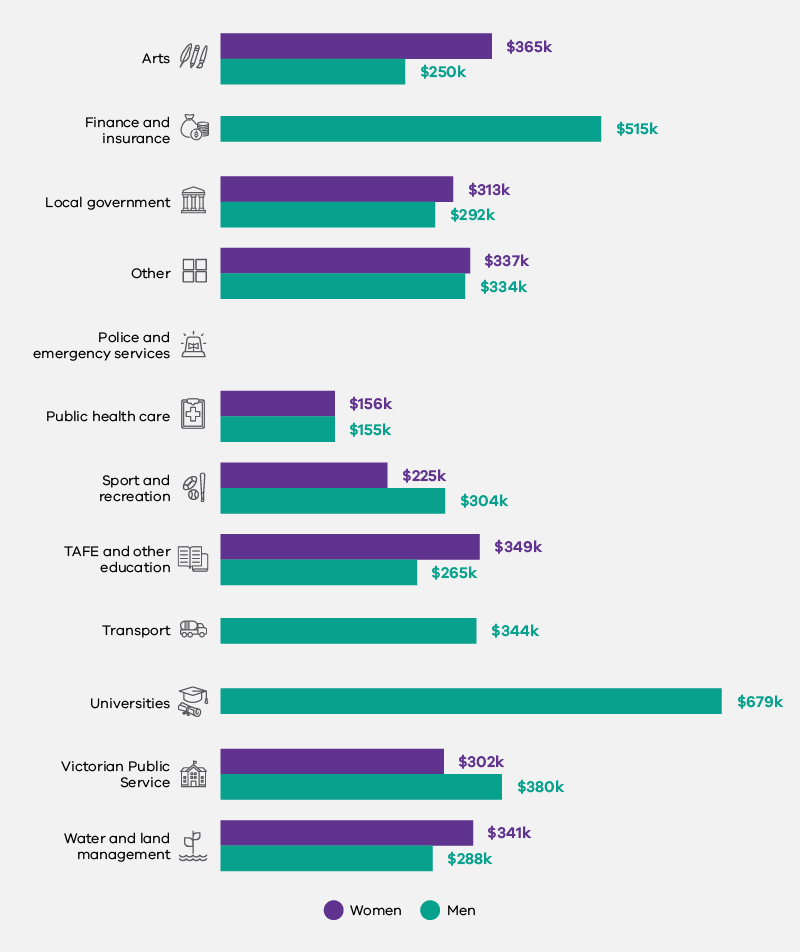
As Figure 2.7 shows, 9 out of the 12 industry groups had a pay gap in favour of men at the senior leadership level. Significant pay gaps were observed within four key industry groups: Police and Emergency Services (18.8%), Public Health Care (16.1%), Other (14.8%) and Universities (11.5%). When considering the gender pay gap found across the entire workforce within these industry groups (see Figure 2.5 above), this data reveals that the gender pay gap within industry groups widens significantly as women climb the leadership ladder. There were less significant pay gaps in favour of men at the senior leadership level in the Sport and Recreation, Local Government, Finance and Insurance, Transport and Water and Land Management industry groups.
There was a gender pay gap in favour of women in 2 out of the 12 industry groups: Arts (9.3%) and TAFE and Other Education (3%). Interestingly, there was also a narrow (0.2%) gender pay gap in favour of women across the entire workforce within the Arts industry group, however there was a significant (11.2%) and consistent gender pay gap in favour of men across the entire workforce within the TAFE and Other Education, where 100% of organisations in this industry group had a pay gap in favour of men (see Figure 2.6 above).
There was no gender pay gap at the senior leadership level in the Victorian Public Service.
Fig 2.7. Median annualised base salary for senior leaders, by industry and gender
There was a significant gender pay gap at the CEO level in favour of men observed in 2 of the 8 industry groups at Figure 2.8 below: Sport and Recreation (25.9%) and Victorian Public Service (20.5%). In all other industry groups, there was a gender pay gap at the CEO level in favour of women, this was widest in the Arts (46.3%), TAFE and Other Education (31.6%) and Water and Land Management (18.4%) industry groups, and narrowest in the Local Government (7.2%), Other (1%) and Public Health Care (0.5%) industry groups.
Fig 2.8. Median annualised base salary for people in CEO roles, by industry and gender

Pay scale representation
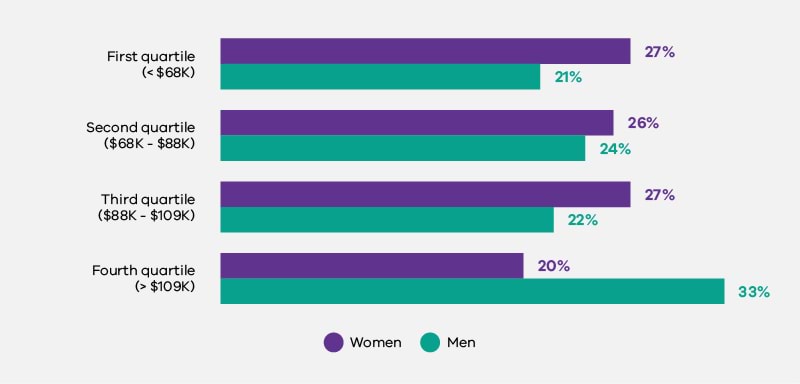
One in 3 men working in organisations reporting under the Act had a base salary above $109,000, compared to just one in 5 women (Figure 2.9). This means that only 20% of women in defined entities have a base salary in the top 25% of salaries, compared to 33% of men.
At the other end of the pay scale, one in 4 women had a base salary below $68,000, compared to just one in 5 men. This means that 27% of women working in the organisations comprising the Commission’s dataset had a base salary in the bottom 25% of salaries, compared to 21% of men.
This finding is consistent with the gender distributions across the Australian private sector and NSW public sector, which reflect a higher proportion of women in lower pay grades and a lower proportion in higher pay grades.96
Fig 2.9. Base salary pay quartiles, by gender

Gender pay gap and age
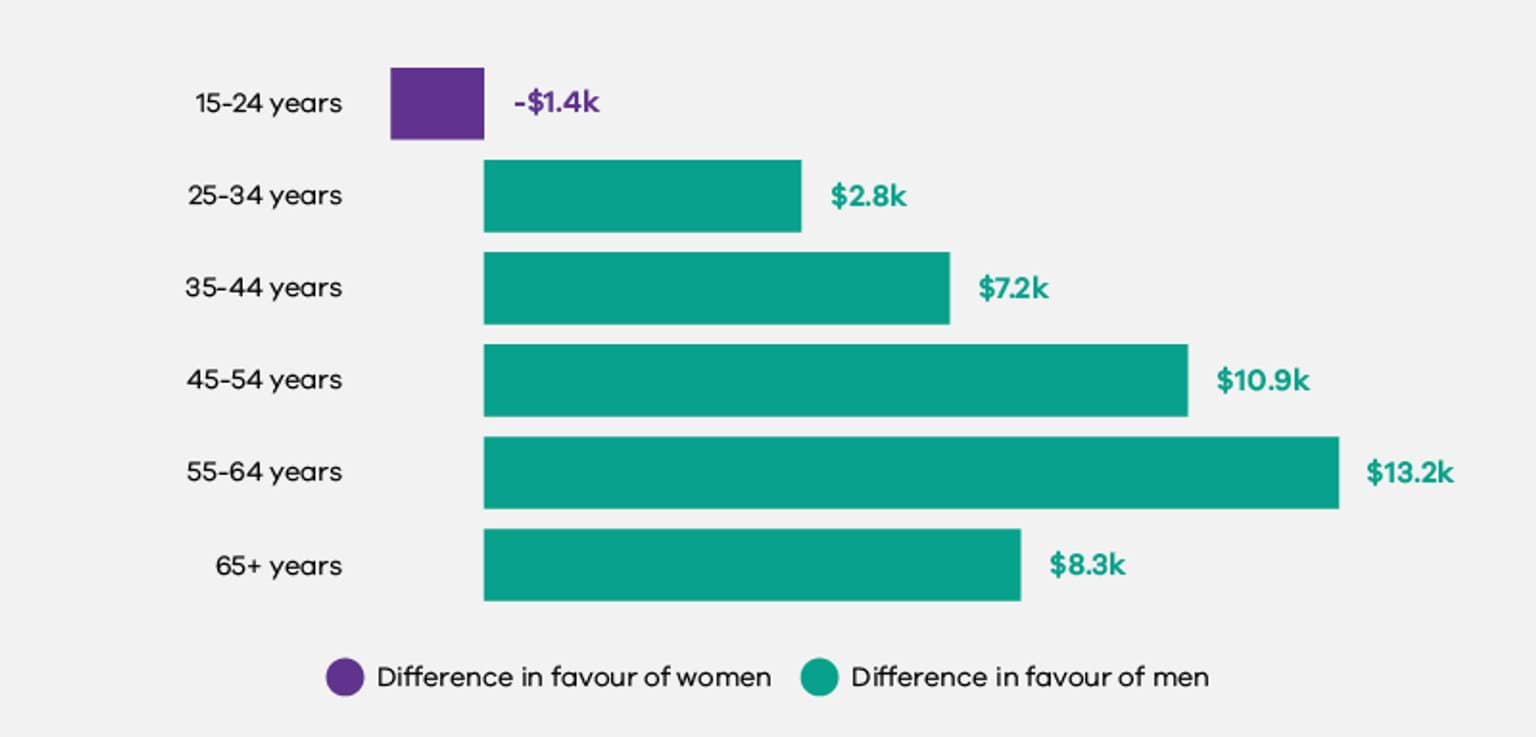
The gender pay gap between women and men working full time in organisations in this dataset increases with age.
As Figure 2.10 shows in the Commission’s dataset, the gender pay gap favouring men is smallest for employees aged between 25 and 34 years, with women in this age bracket earning a median base salary $2,800 lower than men in the same age group. This is a pay gap of 3.3%.
This gap begins to widen significantly for women in the 35 to 44 years age bracket (7.2%) and continues to widen for women in the next age bracket, 45 to 54 years (10.8%). The gender pay gap increases to its highest point (13.7%) for women aged 55 to 64 years. Women in this age bracket have median base salaries $13,200 lower than their male counterparts.
Fig 2.10. Difference between men's and women's median base salaries, by age
Discussion
Gender pay gaps are driven by a range of intersecting systemic and structural factors which must be tackled separately and collectively. In some cases, the gender pay gaps revealed through defined entities’ workplace gender audit data were lower than Victoria’s overall gender pay gap of 14.3%.97 Despite this, the 2021 workplace gender audit data still align firmly with existing research about the drivers of pay inequity.
The audit data revealed that across defined entities, the gender pay gap widened when considering total remuneration as compared to base salary. This finding demonstrates that men received the majority of additional paid benefits such as superannuation, bonuses and allowances.
The Commission’s data further indicates that men received the majority of salaries in the top 25%, while women received the majority of salaries in the bottom 25%. In certain industries, the pay gap widened even further, reflecting the industrial gender segregation that is pervasive across Australia.98 Higher gender pay gaps also correlate to other factors such as a reduced likelihood of offering paid parental leave.99
Data from Australia100 and around the world101 frequently indicates that the gender pay gap increases with age. This finding is reinforced by the Commission's gender audit data. Across defined entities, the pay gap increased with age, peaking in the 55-64 age group. Larger pay gaps in older age brackets can be attributed to a number of compounding inequalities across a woman’s career. These include women’s overrepresentation in part-time and casual employment, women’s reduced workforce participation due to caring responsibilities, women’s delayed or reduced promotion opportunities as a result of career interruptions and ongoing caring responsibilities, and compounded discrimination against older women.102
It is important to acknowledge the significance of the wage-setting context for the organisations covered by the Act. That is, notwithstanding the finding that public sector occupations and classifications generally have a narrow pay gap when women and men perform similar roles, defined entities are not the only actors determining pay and pay practices. Rather, wage-setting in individual defined entities may be directly influenced by personnel budget constraints, salary caps, and overall funding cuts that may restrict the pursuit of pay equity. As identified by Sojo et al., narrowing gender pay gaps across all defined entities will therefore require a unified approach, as well as the ‘co-operation and commitment of unions, industry bodies and professional associations – which all play varying roles in establishing rates of pay for different groups of workers’.103
Addressing gender pay gaps certainly requires looking at policies and processes around the allocation of salaries and other paid benefits. However, it is also essential to address systems and cultures around workplace flexibility and safety, stereotypes and norms about what roles and industries are seen as suitable for men and women, and the uneven distribution of unpaid caring work – among other contributing factors.104 While individual defined entities do not hold all of these levers, the collective focus and action spurred by the Gender Equality Act provides a unique opportunity to create change.
Recommendations
Research has shown that Australian organisations that are leading in relation to gender equality regularly measure and monitor their gender equality data.105 In these workplaces, organisation-wide, by-level and like-for-like pay parity analyses are undertaken at least annually, with gaps investigated and targeted for attention. Metrics are applied to both base salary and total remuneration.106
Research suggests that even though pay accounting techniques are perceived as impartial and objective, processes and systems of quantification (such as the processes applied to determine the gender pay gap in an organisation), and the decisions made about what and how to measure value and work-impact, can introduce bias into the outcomes.107 In fact, failure to identify and remedy gender bias in organisational processes, including those designed to support pay equity (such as job evaluations), is a key barrier to equal pay.108
It is therefore important that a gender lens is applied not only to pay practices within a defined entity, but also to the pay gap assessment process. This helps to identify any potential for bias in pay practices and pay audit results and avoids embedding gender bias in the relevant processes and systems.109 One way to consider bias in the gender pay audit process itself is to assess all the factors identified as legitimate causes of pay variation for potential bias – this may involve analysing employee performance measurement, promotion, recruitment and appointment systems.
Research has shown that if pay audits are not linked to pay-related decision-making and pay information systems, they often become purely analytical exercises, without any real impact on gender pay inequities.110 Defined entities should consider working towards embedding pay audit systems with pay-setting systems and human resources information systems to support ongoing monitoring of pay equity in the workplace.
Building internal capacity in relation to statistical literacy and pay practices can have impacts long after the data has been first collected. In fact, research suggests that statistical literacy designed to assist individuals to understand and interpret pay audits may also generate engagement with audit results and increase scrutiny of the audit methodology.111 This, in turn, helps ensure the quality of the data collected.112 Further, linking pay audits to pay system planning and pay-related decisions (for example, by creating strategic partnerships between those responsible for handing pay audit data and remuneration managers or line managers making pay-related decisions) provides greater opportunity for pay audit findings to be actioned.113
Investing in training and resources to support the development and use of high-quality pay equity data, can help develop this linkage between pay audits and broader pay-related processes. Presenting pay audit results in non-expert language can also support the translation of pay audit information into outcomes, by supporting employees’ ability to use pay gap disclosure to inform their pay and employment decisions.114
The Commission understands that many defined entities have experienced challenges in collating intersectional pay gap data, including due to a lack of data collection system capacity. However, research suggests that the gender pay gaps identified across defined entities are likely to be wider for employees who experience multiple forms of disadvantage and discrimination based on their individual characteristics.115 It is therefore critical that organisations covered by the Act actively improve their data collection systems to enable intersectional analyses.
References
- KPMG, She’s Price(d)less: The economics of the gender pay gap, KPMG, 13 July 2022, accessed 13 July 2022.
- KPMG, She’s Price(d)less.
- Workplace Gender Equality Agency (WGEA), Australia’s Gender Pay Gap Statistics, WGEA, 8 March 2022, accessed 22 July 2022.
- WGEA, Australia’s Gender Pay Gap Statistics 2019 [PDF 1.01 MB], WGEA, February 2019, accessed 22 July 2022.
- Victoria’s full-time average weekly base salary gender pay gap was 11.2% in November 2020 compared to 14.3% in November 2021. Australian Bureau of Statistics (ABS), Average Weekly Earnings, Australia, ABS Website, November 2021, accessed 12 July 2022.
- ABS, Average Weekly Earnings, Australia.
- KPMG, She’s Price(d)less.
- KPMG, She’s Price(d)less.
- KPMG, Towards a more equal sharing of work, KPMG, May 2021; The Treasury, Retirement Income Review: Final Report, Australian Government, July 2020, pp 262–263.
- KPMG, Towards a more equal sharing of work, p.14. Voluntary contributions play a role in closing the superannuation gap at retirement age as, on average, women aged 55-64 make significantly larger voluntary contributions to their super than men: The Treasury, Retirement Income Review: Final Report, p. 272.
- The Treasury, Retirement Income Review: Final Report, p. 257.
- The Treasury, Retirement Income Review: Final Report, p. 257.
- KPMG, Towards a more equal sharing of work; WGEA, Wages and Ages: Mapping the Gender Pay Gap by Age, WGEA, 27 June 2022, accessed 22 July 2022.
- Victorian Government, ‘Intersectionality in gender inequality’, Gender Equality Baseline Report, Victorian Government, 2019, accessed 22 July 2022.
- Department of Premier and Cabinet, Safe and Strong: A Victorian gender equality strategy, Victorian Government, 2016, accessed 22 July 2022.
- Victorian Government, ‘Intersectionality in gender inequality’
- Department of Premier and Cabinet, Safe and Strong; Australian Institute for Health and Wellbeing (AIHW), Homelessness among indigenous Australians, AIHW, 2014, accessed 22 July 2022.
- For the first time under Australian gender equality reporting legislation, organisations covered by the Act were required to provide data disaggregated not only by gender, but across a range of attributes. As outlined in the Introduction, we will publish insights from this intersectional data in our companion report on intersectionality, to be released in 2023.
- That is, how much each employee was paid over the course of the year.
- That is, how much each employee would be paid if they worked full-time hours.
- It should be noted that the Commission did not publish specific guidance on how to report casual remuneration. As a result, there was some variation between data provided by defined entities. This omission will be corrected in future audit guidance materials for defined entities.
- This is consistent across Australia. WGEA found that Australian women are 3 times more likely to be working part time than men, primarily because of their higher unpaid caring load. WGEA, Removing the motherhood penalty, WGEA, May 2018, accessed 22 July 2022.
- T Fitzsimmons, et al., Employer of Choice for Gender Equality: Leading practices in strategy, policy and implementation, AIBE Centre for Gender Equality in the Workplace, 2020, p. 18.
- Organisation for Economic Co-operation and Development (OECD), Gender wage gap (indicator), OECD, 2022, accessed 22 July 2022.
- Victorian Public Sector Commission (VPSC), Employee pay and gender pay, VPSC, 2022, accessed 25 July 2022. Note: See Figure 2.1 for specifications of VPSC gender pay gap calculation.
- NSW Public Service Commission, ‘Gender’, Workforce Profile Report 2020, State of New South Wales, 2020, accessed 22 July 2022.
- WGEA, Australia's gender equality scorecard: Key results from the Workplace Gender Equality Agency’s 2020-21 employer census, WGEA website, February 2022, accessed 25 July 2022. Note: see Figure 2.1 for specifications of WGEA gender pay gap calculation.
- WGEA, Australia’s Gender Pay Gap Statistics, WGEA website, February 2022, accessed 25 July.
- In 2020-21, WGEA’s full-time total remuneration gender pay gap was 23.1% for key management personnel, 22.5% for other executives and general managers, 17.7% for senior managers and 19.8% for other managers: WGEA, Australia’s gender equality scorecard: Key results from the Workplace Gender Equality Agency’s 2020-21 employer census [PDF 1.00 MB] WGEA, February 2022, p. 12, accessed 25 July 2022.
- Note: Results have not been reported for cohorts composed of one individual. In particular, we have not included the gender pay gap data at the CEO level for the Finance and Insurance, Police and Emergency Services, Transport, and Universities industry groups, in these findings
- WGEA, Australia's gender equality scorecard, p. 11; NSW Public Service Commission, ‘Gender’, Workforce Profile Report 2020, State of New South Wales, 2020, accessed 22 July 2022.
- ABS, Average Weekly Earnings, Australia.
- KPMG, She’s Price(d)less, p 24.
- KPMG, She’s Price(d)less, p 24.
- WGEA, Australia’s Gender Pay Gap Statistics.
- UK Office for National Statistics, ‘Gender pay gap in the UK’, Census 2021, UK Office for National Statistics website, October 2021, accessed 25 July 2022; Statistics Canada, Employee wages by industry, annual, Statistics Canada website, July 2022, accessed 25 July 2022; Statistics Iceland, Unadjusted gender pay gap 2019, Statistics Iceland website, January 2021, accessed 25 July 2022; Te Kawa Mataaho Public Service Commission,, Pay gaps, Te Kawa Mataaho Public Service Commission, New Zealand, , December 2021, accessed 25 July 2022.
- WGEA, Wages and Ages.
- V Sojo, et al., What works, what’s fair? Using systematic reviews to build the evidence base on strategies to increase gender equality in the public sector, The University of Melbourne, The Australian National University, and Swinburne University of Technology, 2022, doi: 10.6084/m9.figshare.19243536, p.78.
- KPMG, She’s Price(d)less.
- Fitzsimmons et al., Employer of Choice for Gender Equality.
- Fitzsimmons et al., Employer of Choice for Gender Equality.
- Sojo et al., What works, what’s fair?, p.73.
- Sojo et al., What works, what’s fair?, p. 82; J Rubery, ‘Joan Acker and Doing Comparable Worth’, Gender, Work and Organization, 2019, 26(12):1786-1793, doi:/10.1111/gwao.12242.
- Sojo et al., What works, what’s fair?, pp. 76, 82.
- Sojo et al., What works, what’s fair?, pp. 73-74, 77.
- Sojo et al., What works, what’s fair?, p. 78.
- Sojo et al., What works, what’s fair?, p. 78.
- Sojo et al., What works, what’s fair?, p. 84.
- Sojo et al., What works, what’s fair? p. 84.
- A Hegewisch and E Mefferd, Gender Wage Gaps Remain Wide in Year Two of the Pandemic, Institute for Women’s Policy Research website, March 2022, accessed 25 July 2022; L Hopkins and V Salvestrini, Caught at the Crossroads? An Intersectional Approach to Gender and Ethnicity Pay Gaps in the HE Universities & Colleges Employers Association website, November 2018, accessed 25 July 2022.
Updated