

Introduction
Women’s participation in the paid Victorian workforce has increased substantially over the past five decades, rising from 43.8% in February 1978 to 62.3% in June 2022.8 In contrast, men’s participation has fallen slightly from 80% to 72.1%.9 More recently, the Victorian Public Sector Commission has begun to measure the labour force participation of gender diverse Victorians, with an estimated 0.7% of Victorian public sector employees identifying as trans, non-binary or gender diverse, and 0.3% identifying as intersex in 2021.10
Despite these important shifts, the Victorian labour market remains highly segregated by gender, a persistent but repairable feature of labour markets around the world.11 This is because women’s increased workforce participation has not been consistent across industries and occupations.12
Unequal gender representation occurs vertically within organisations, with women often being overrepresented in lower-level occupations, classifications and pay grades. It also occurs horizontally across industries, as women constitute the majority of workers in lower-paid industries, such as community care and social assistance. This causes women to be disproportionately featured in the lower quartile of the earnings spectrum across the Victorian workforce.
Key issues: Why was this measured?
Women are underrepresented in management roles
Women are often concentrated in lower-paid administrative roles and have slower rates of career progression due to a number of cultural and structural factors, such as stereotypes about the types of work different genders may be interested in or can perform, unconscious and conscious biases in hiring, promotion and performance development, expectations around overtime, travel or time spent in the physical office, as well as attitudes towards flexible work.13
Women are overrepresented in lower-paid areas
Traditionally ‘masculinised’ sectors and industries (both those that are disproportionately majority-men industries, but also those industries and roles that are traditionally regarded as ‘men’s work’) tend to be better remunerated and respected within society. Conversely, traditionally feminised sectors and industries (which are majority-women industries and associated with feminine stereotypes related to caring) are less respected and lower paid.14
Collectively, women employed in the Health Care and Social Assistance industry and the Education and Training industry represent over one-third of all employed women in Victoria.15 These industries have lower salaries than majority-men industries,16 pay the lowest proportion of superannuation and discretionary payments,17 and have higher than average part-time and casual role rates.
Data on intersectional inequality is sparse
Research has shown that migrant and refugee women are more likely to be engaged in low-income, low-skill and insecure work,18 facing intersecting barriers to employment and promotion, such as lower English proficiency, insufficient work rights, lack of recognition of international qualifications and social exclusion.19
Similarly, we know that Aboriginal and Torres Strait Islander women are less likely to hold executive and management positions compared to Aboriginal and Torres Strait Islander men,20 and that women with disability are often given marginal jobs far below their capacity and are more concentrated in precarious and informal employment.21
Those who fall outside of the gender binary – including those who are non-binary, trans, gender diverse, agender, genderfluid or use any other term, as well as individuals who may identify as women or men but who do not conform to societal norms ascribed to these groups – may experience complex forms of discrimination or disadvantage (such as microaggressions and transphobia) in sectors seen as ‘masculine’ or ‘feminine’ because they do not conform to these narrow gender stereotypes.22
Insufficient data collection and research has been undertaken on the specific experiences of these groups in workplace settings across different industries.
How was this indicator measured?
Workforce composition
Defined entities were asked to provide data in relation to the composition of their workforce (by classification level to CEO), disaggregated by gender, employment basis and (where possible) intersectional data.23
As the gender composition of a workforce changes substantially depending on who is working full-time, part-time and casually, the Commission has measured this indicator:
- based on total headcount rather than FTE, meaning full-time, part-time, and casual workers were all counted the same way, and
- within each of the organisation’s full-time, part-time and casual workforces separately, relative to the organisation’s total workforce.
Given we know that unequal workforce composition is driven by a range of organisational, cultural and structural factors, such as leadership views on flexible working arrangements, the Commission also considered employee experience responses in relation to discrimination and flexible working arrangements.
Governing body composition
Defined entities were asked to provide data in relation to the composition of their governing body (such as a board of directors, or elected councillors in the case of local government) disaggregated by employment basis, gender, and intersectionality attributes.
Gender segregation
This indicator was measured by considering the gender composition of employees by occupation according to the ANZSCO classification codes, as assigned by defined entities, both across industries (for example, by calculating the gender composition of workers employed in a ‘Manager’ classification across organisations within a particular sector) and within defined entities (for example, by calculating the gender composition of workers employed in ‘Clerical and Administrative’ classifications within a particular defined entity).
Further detail about how each aspect of the measures was defined can be found in the glossary at the end of this report.
What was found: Key data insights
Total workforce and industry composition
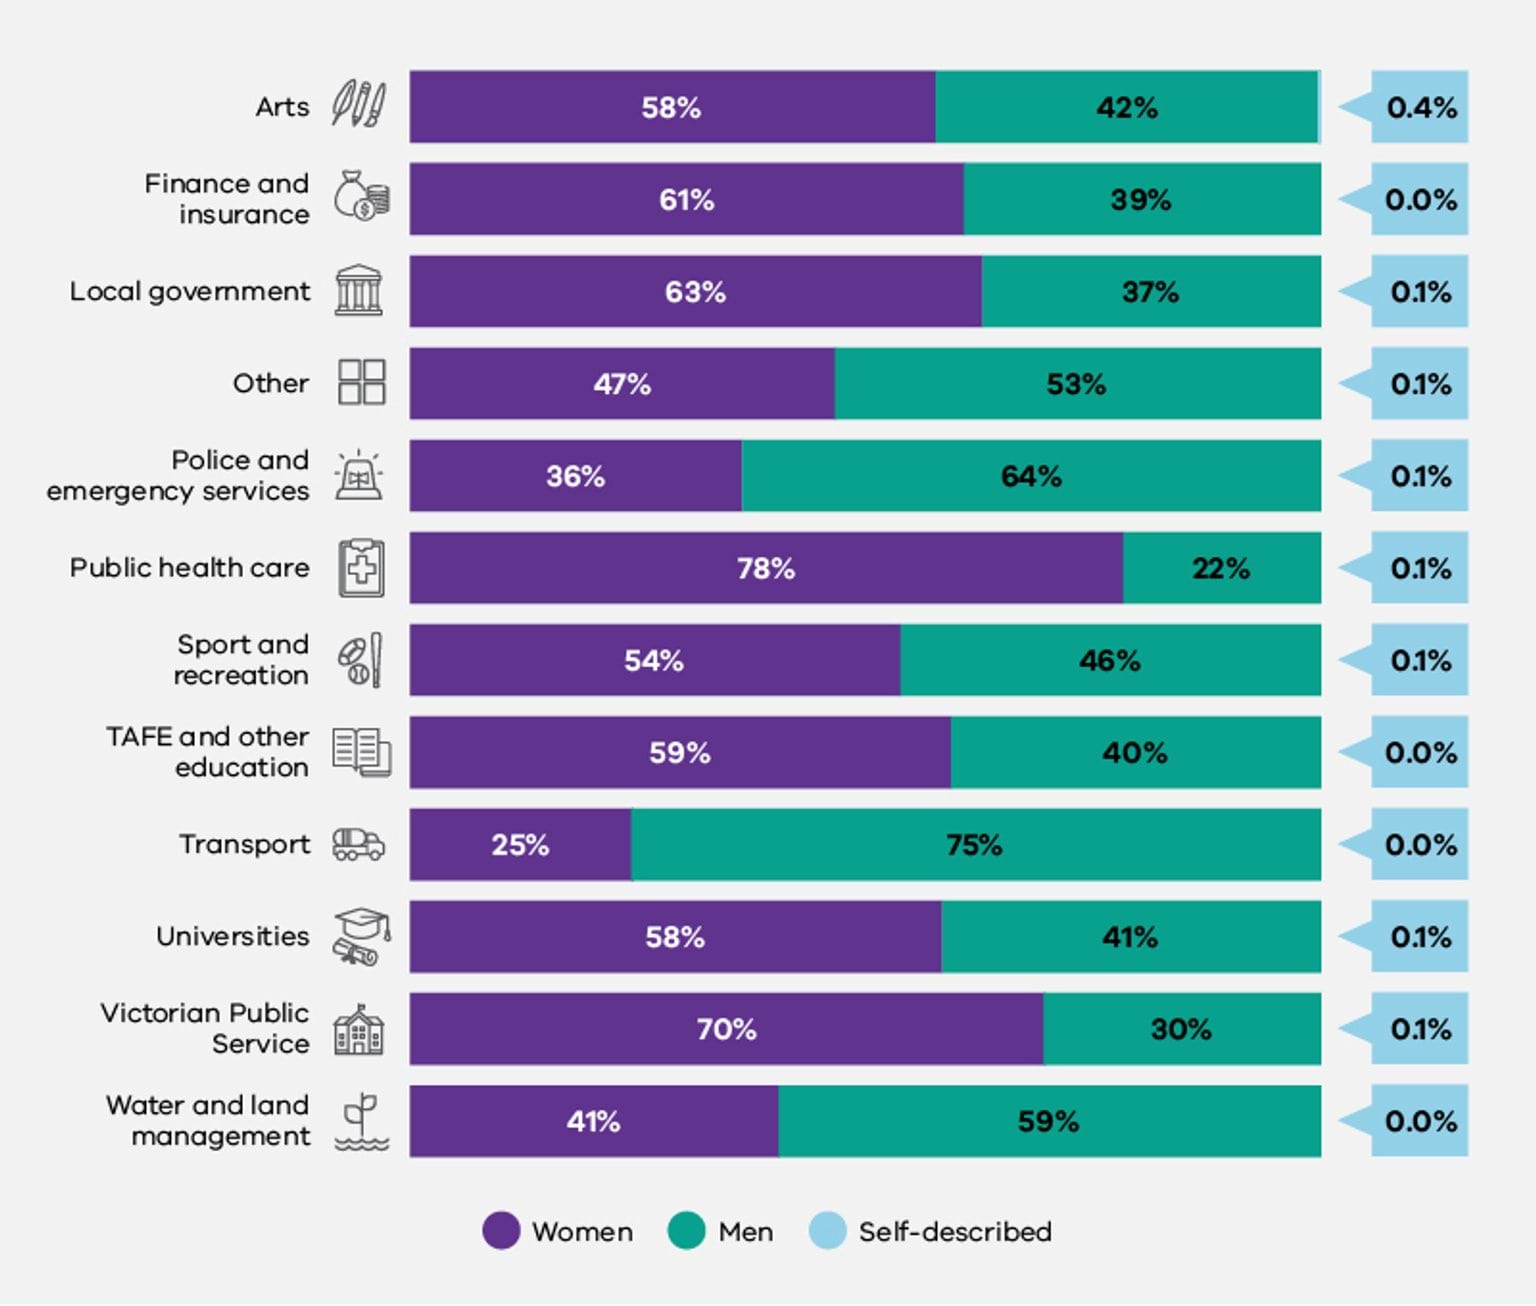
The total workforce of defined entities comprised 66% women, 34% men, and at least 0.1% people of self-described gender.24
As can be seen in Figure 1.1, women outnumbered men in 8 of the 12 industry groups, including the Arts, Universities, TAFE and Other Education, Local Government and Finance and Insurance industry groups. The Public Health Care industry group had the highest proportion of women (78%), followed by the Victorian Public Service (70%). In contrast, the Transport industry group had the highest proportion of men (75%), followed by Police and Emergency Services (64%). Note that there are slight differences in how the Commission for Gender Equality in the Public Sector and the Victorian Public Sector Commission define industries within the public sector. As the workplace gender audit required defined entities to submit their data at an organisational level, different types of workforces within a single organisation are included within the same industry grouping. For example, in this Baseline report, all schools and school staff (including cleaners, teachers, administrative clerks and others) are classified as belonging to the Victorian Public Service industry, as they are employed by the Department of Education and Training. However, the VPSC splits these workforces into different industry groups as relevant.
These findings are consistent with others across the world25 where women are estimated to make up 70% of the global health sector workforce26 and over 75% of workers in the health and social care sector in most OECD countries27 but represent only 18.6% of the transport sector across the European Union,28 18% in Sweden,29 and 23% in Canada.30
Fig 1.1. Public sector workforce, by industry and gender
Gender composition by employment type
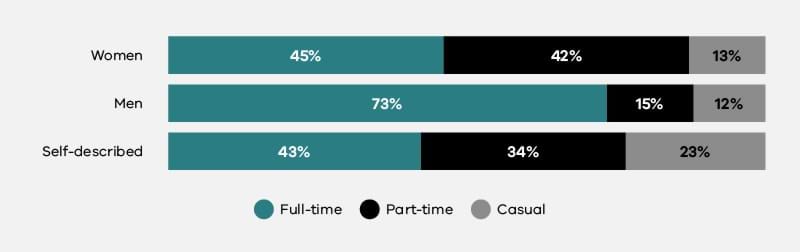
Women and individuals of self-described gender were more than twice as likely to work in part-time roles than men – with only 15% of men working in part-time roles, compared to 42% of women and 34% of individuals of self-described gender.
In comparison, 45% of women worked in full-time roles, compared to 73% of men and 43% of people of self-described gender. The imbalance in the proportion of women and men working in full-time roles is similar to that in the private sector in Australia (where 41% of women work on a full-time basis, compared to 67% of men).31 However, the imbalance is significantly greater than in the New South Wales public sector (where 58.1% of women work on a full-time basis, compared to 41.9% of men),32 and in countries such as Canada (where 75.6% of women and 81.8% of men were in full-time roles in 2021)33 and the UK (where 62% of women and 87% of men were working full time as at May 2022).34
Fig 1.2. Employment type by gender

As can be seen in Figure 1.2, while the gender composition of casual employment in defined entities was relatively balanced between women and men (13% and 12% respectively), people of self-described gender were almost twice as likely (23%) to be in casual employment (see boxed section for further information).
Gender composition in leadership roles
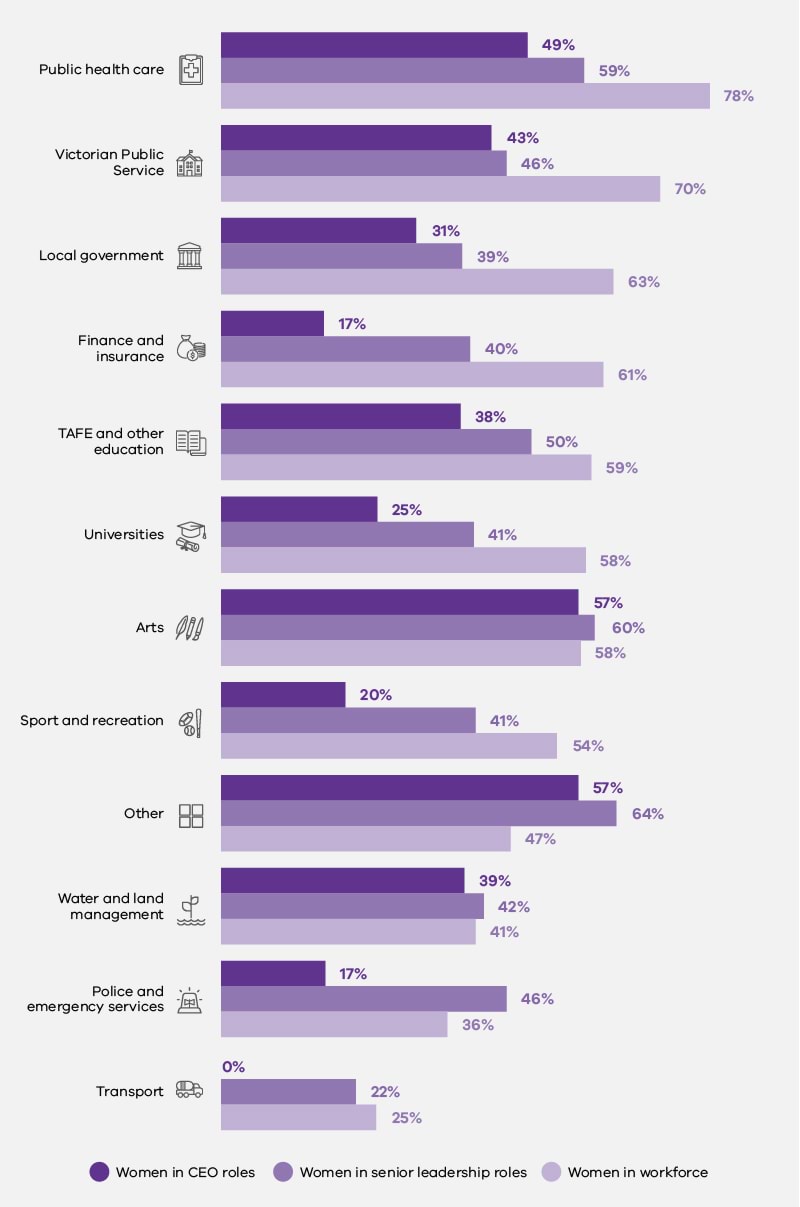
Women were underrepresented in senior leadership positions across defined entities reporting under the Act, with women comprising 66% of the workforce, but only 46% of senior leadership roles.
In 8 of the 12 industry groups identified in Figure 1.3, women were less represented in senior leadership roles than in the underlying workforce.
Across the industry groups, the largest differences in proportions were found in the Victorian Public Service, where women made up 70% of the workforce but only 46% of senior leadership positions, and the Local Government industry group, where women made up 63% of the workforce and only 39% of senior leadership positions (amounting to a 24% difference in each industry group). This is followed by the Finance and Insurance industry group where women made up 61% of the workforce but held only 40% of senior leadership positions and 17% of CEO positions.
This underrepresentation is consistent with imbalances found in the NSW public sector, where women make up over 65% of the public sector workforce, but only 40% of senior executive level roles.37 However, it is more pronounced than in the public service in the UK, where women make up 54.2% of the civil service and 46.7% of the senior civil service.38 Similarly, in New Zealand, women made up 61.8% of the public service workforce as of 30 June 2021 but only 53.5% of the top 3 tiers of senior management.39
Organisations covered by the Act fared only marginally better than the private sector. According to the Workplace Gender Equality Agency, in 2021 women made up over 50% of private sector employees, however they comprised only 32.5% of key management positions and only 19.4% of CEOs.40
This situation is also reflected internationally. For example, a survey of 69 organisations (470,000 employees) in Canada found that while, on average, 45% of all entry-level employees were women, only 39% of Managers, 25% of C-suite employees and 15% of CEOs were women.41
Across defined entities, 61% of CEO-level roles were filled by men, despite men comprising only 34% of the workforce. In contrast, while women comprised 66% of the workforce, they held only 38% of CEO-level roles. As noted above, this is just under double the percentage of female CEOs in the Australian private sector, which is 19.4%.42
When we consider how this operates across particular industry groups in the Commission’s data, men were disproportionately represented in CEO roles in 10 of the 12 (83%) industry groups. Women were most likely to hold CEO positions within the Arts, Other, Public Health Care and Victorian Public Service industry groups, and least likely to hold CEO positions within the Transport, Finance and Insurance, Police and Emergency Services and Sport and Recreation industry groups.
Fig 1.3. Proportion of women in CEO roles, in senior leadership roles and in the workforce, by industry

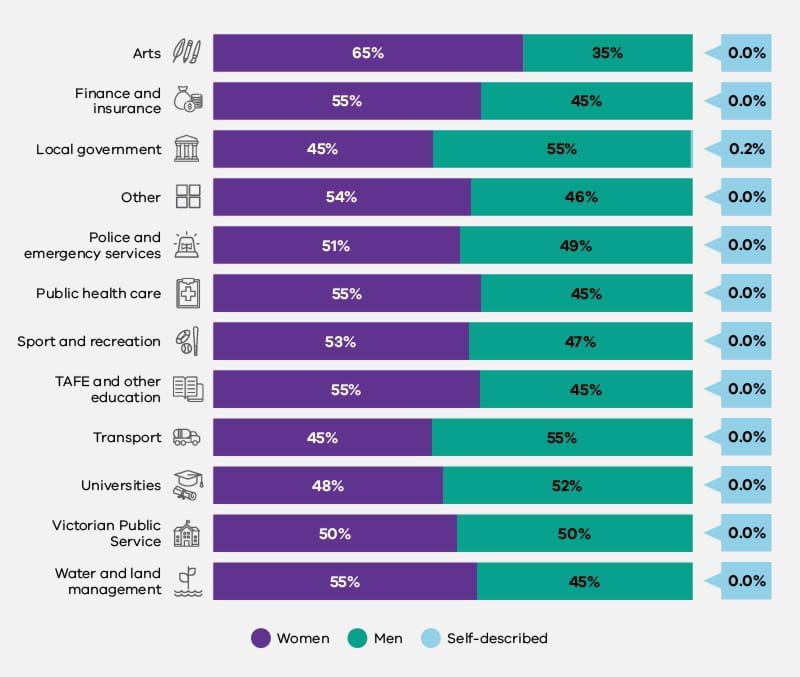
Gender composition of governing bodies
Boards, councils, committees of management and other governing bodies have a powerful role in strategic, financial and risk oversight and decision-making. Equal governing body representation is therefore critical to ensure decisions made at this level reflect the diversity of the workforce and the community more broadly.
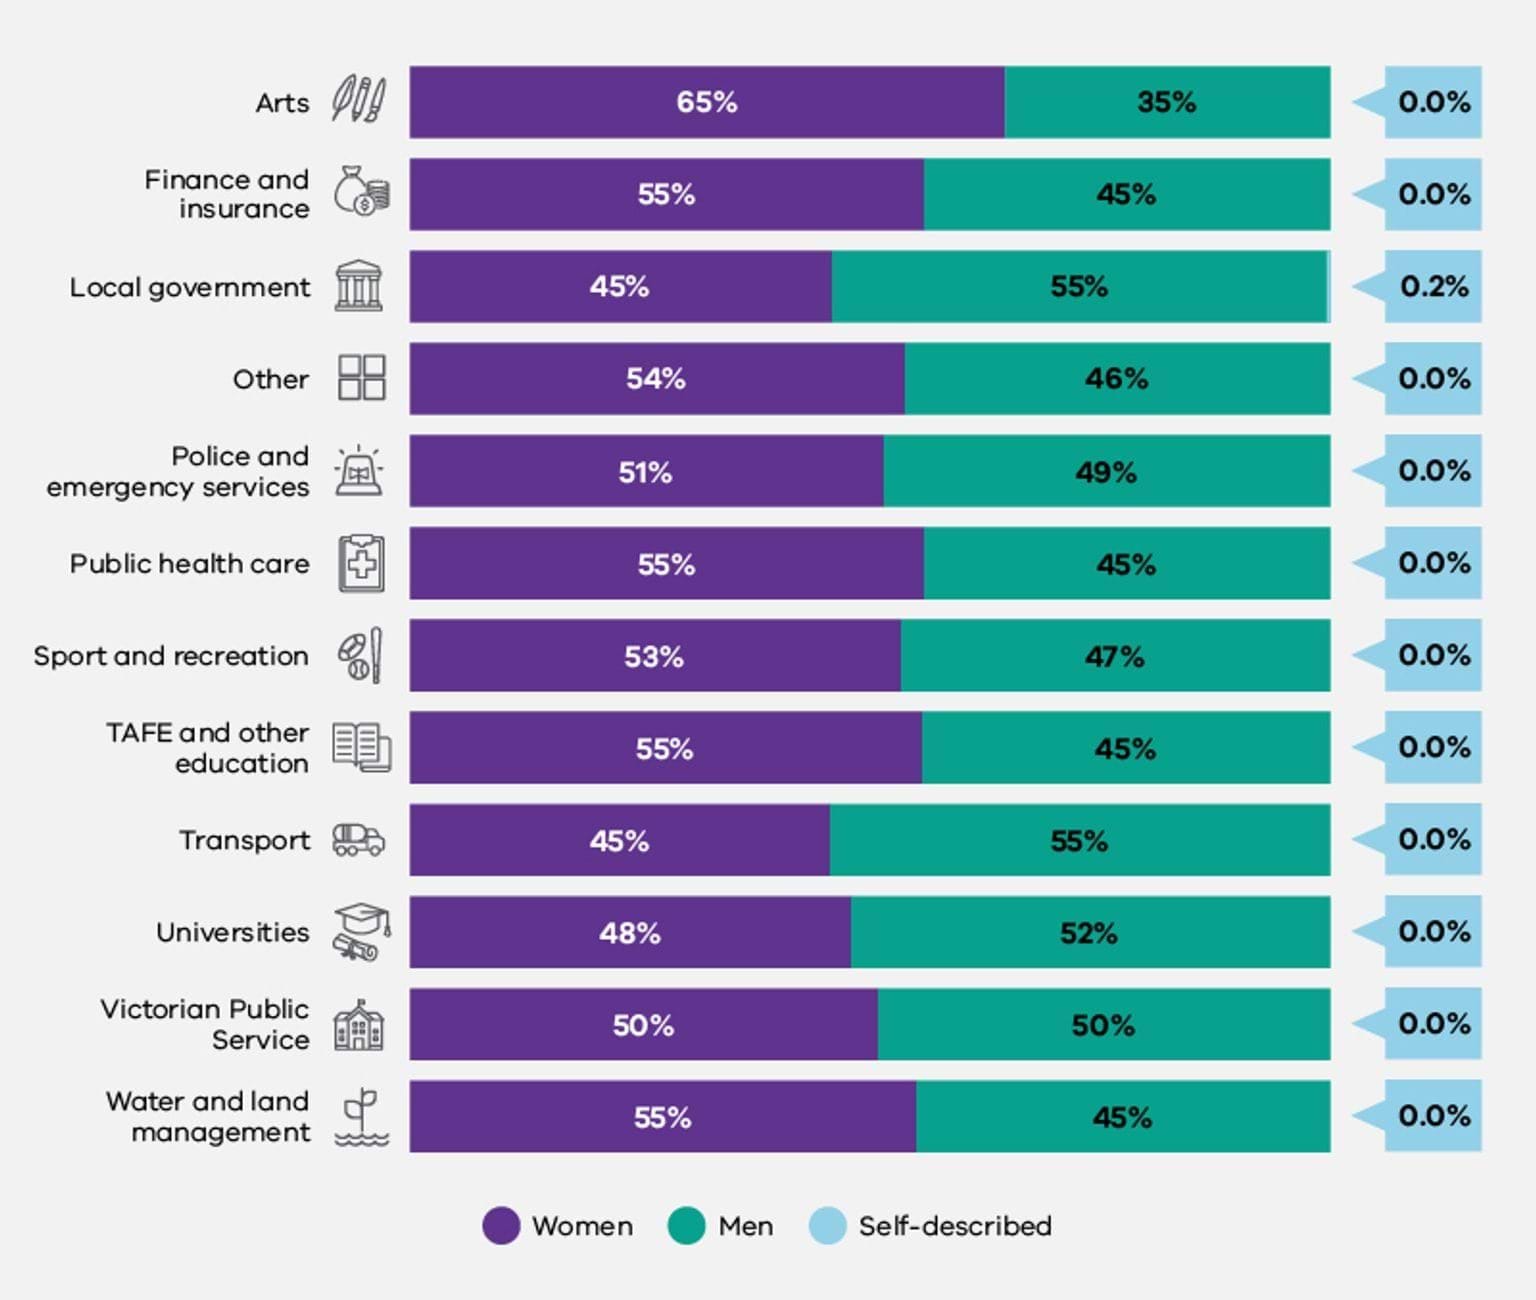
The gender composition of governing bodies across defined entities overall was largely balanced between women and men (with 1,226 women and 1,128 men serving on governing bodies). Only one person of self-described gender was reported to serve on a public sector governing body.
Fig 1.4. Governing body members, by industry and gender
National and international reports suggest that defined entity boards therefore have better representation of women than federal Australian Government boards (where, as of 30 June 2021, women held 49.6% of positions across all Australian Government board appointments and 39.1% of chair and deputy chair positions).43 Similarly, the board of organisations covered under the Act also fared better than the boards of private sector organisations across Australia more broadly (where women hold only 29.9% of board seats and 11.7% of board chair positions) as well as in Canada (where the average percentage of women on boards is 30% and in chair positions is 9%) and the European Union (where 30.7% of board seats are held by women and only 10% of board chairs are women).44
Victorian Government targets in place since 2015 requiring 50% of new government board appointments to be women have clearly been successful in generating greater gender balance in public boards in Victoria.45
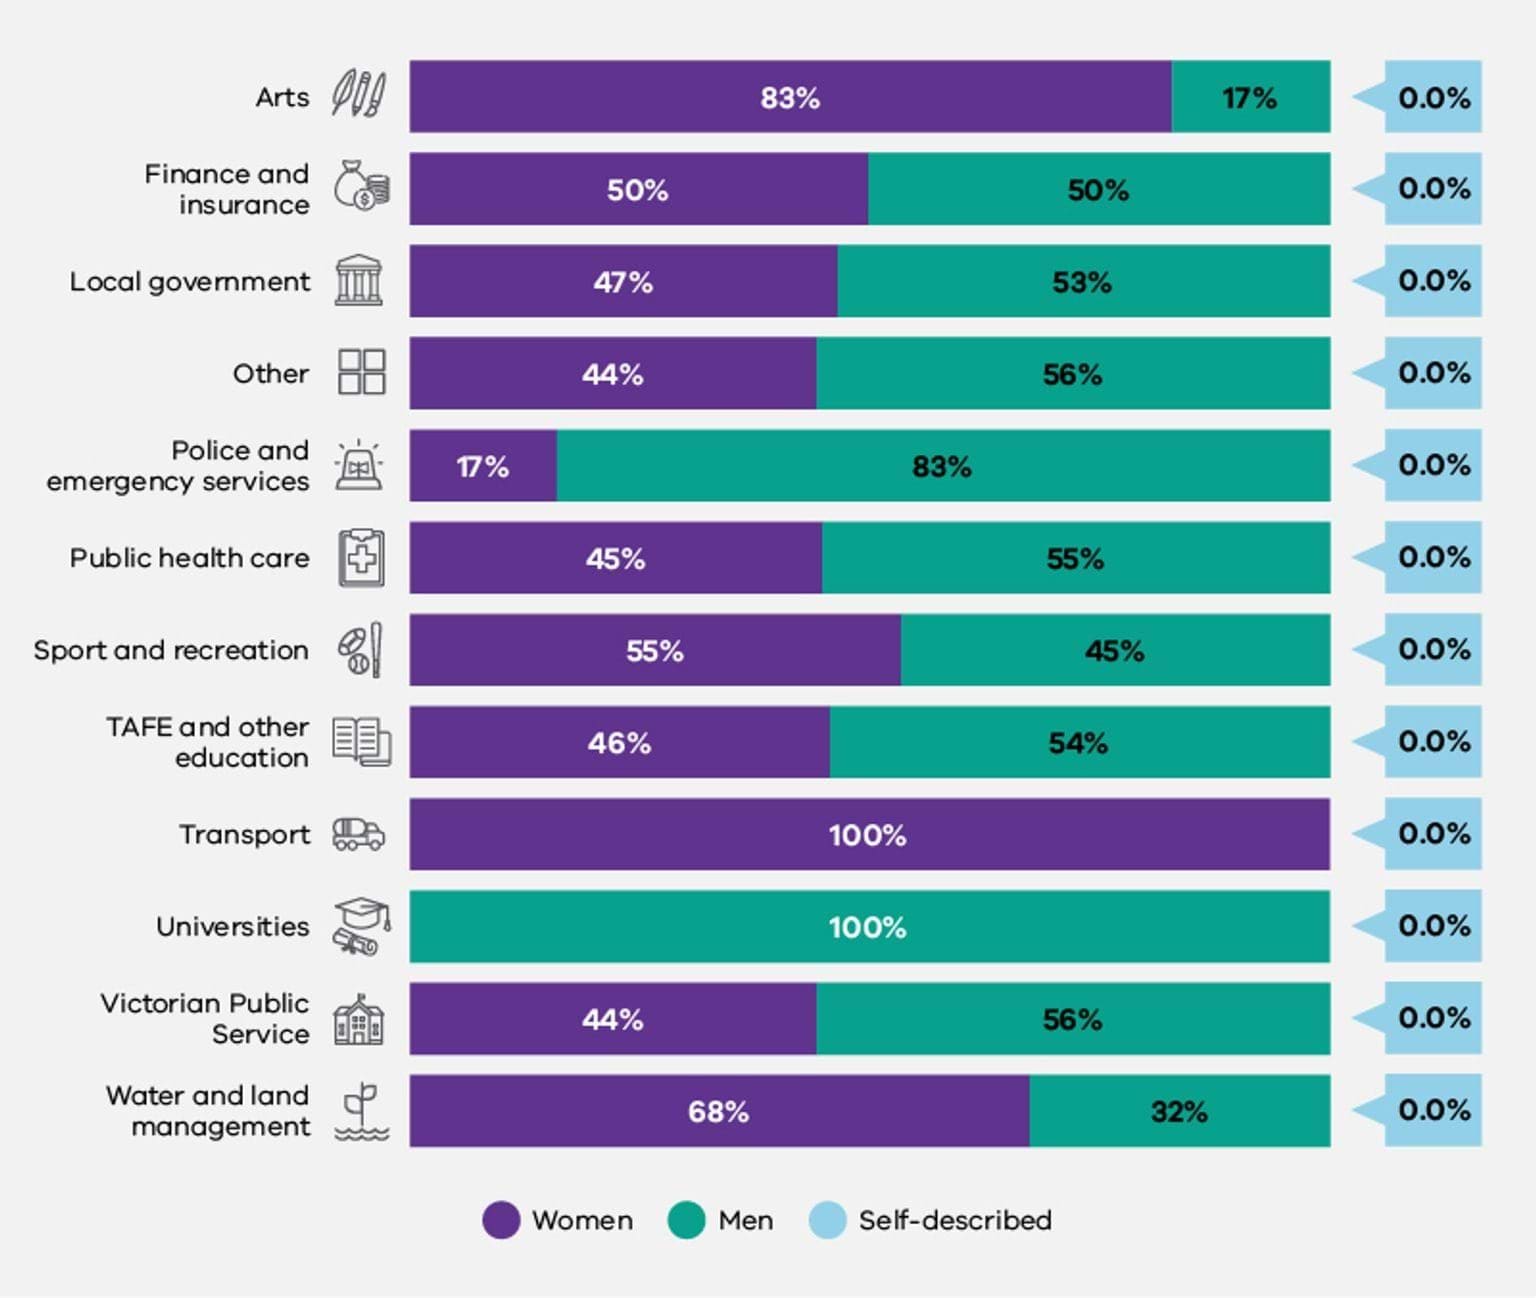
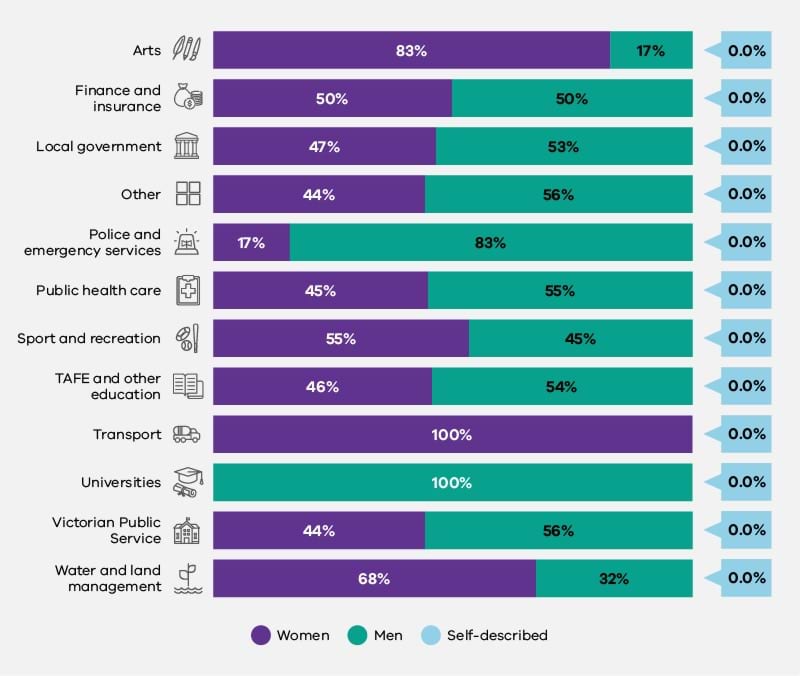
Fig 1.5. Governing body chairs, by industry and gender
While there was a reasonable balance between the total number of women (128) and men (140) serving as governing body chairs across the data as a whole, this balance was not maintained at the industry group level (Figure 1.5). All University governing body chair positions were occupied by men, while all Transport industry governing body chair positions were held by women. The data also shows a significant gender imbalance in the Arts industry group, in which women occupied 83% of chair positions, and in the Police and Emergency Services industry group, in which they held only 17% of chair positions.
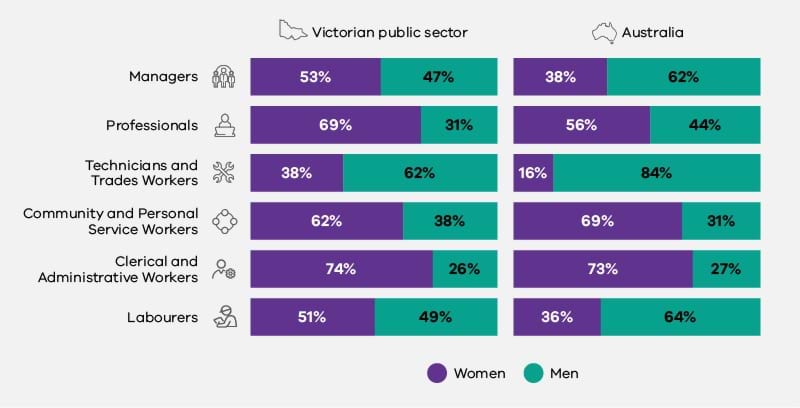
Occupational gender imbalances
The 2021 workplace gender audit data shows the occupational gender imbalances present in defined entities compared to those in the broader Australian workforce. Defined entities were closer to gender balance than the broader Australian workforce in 4 of 6 occupation groups, and further away from gender balance in 2 of the occupation groups.
Fig 1.6. Victorian public sector and Australian workforces, by occupation and gender

Across both 2021 workplace gender audit data and national data, women held almost three-quarters of Clerical and Administrative roles and over half of Professional roles. Men held the majority of Technician and Trade positions in both datasets (62% within defined entities and 84% within the Australian workforce). These findings are also reflected internationally. For example, in Canada women are most concentrated in occupations in health (79.6%), education, law, and social, community and government services (68.9%), whereas men occupy 93% of trades and transport and equipment operation occupations and 73.5% of occupations in manufacturing and utilities.46 Similarly, men in the UK have the highest employment share in skilled trade occupations (92%), while women are most concentrated in ‘caring, leisure and other service’ occupations (75.6%), and administrative and secretarial occupations (67.7%).47
Reports of workplace discrimination
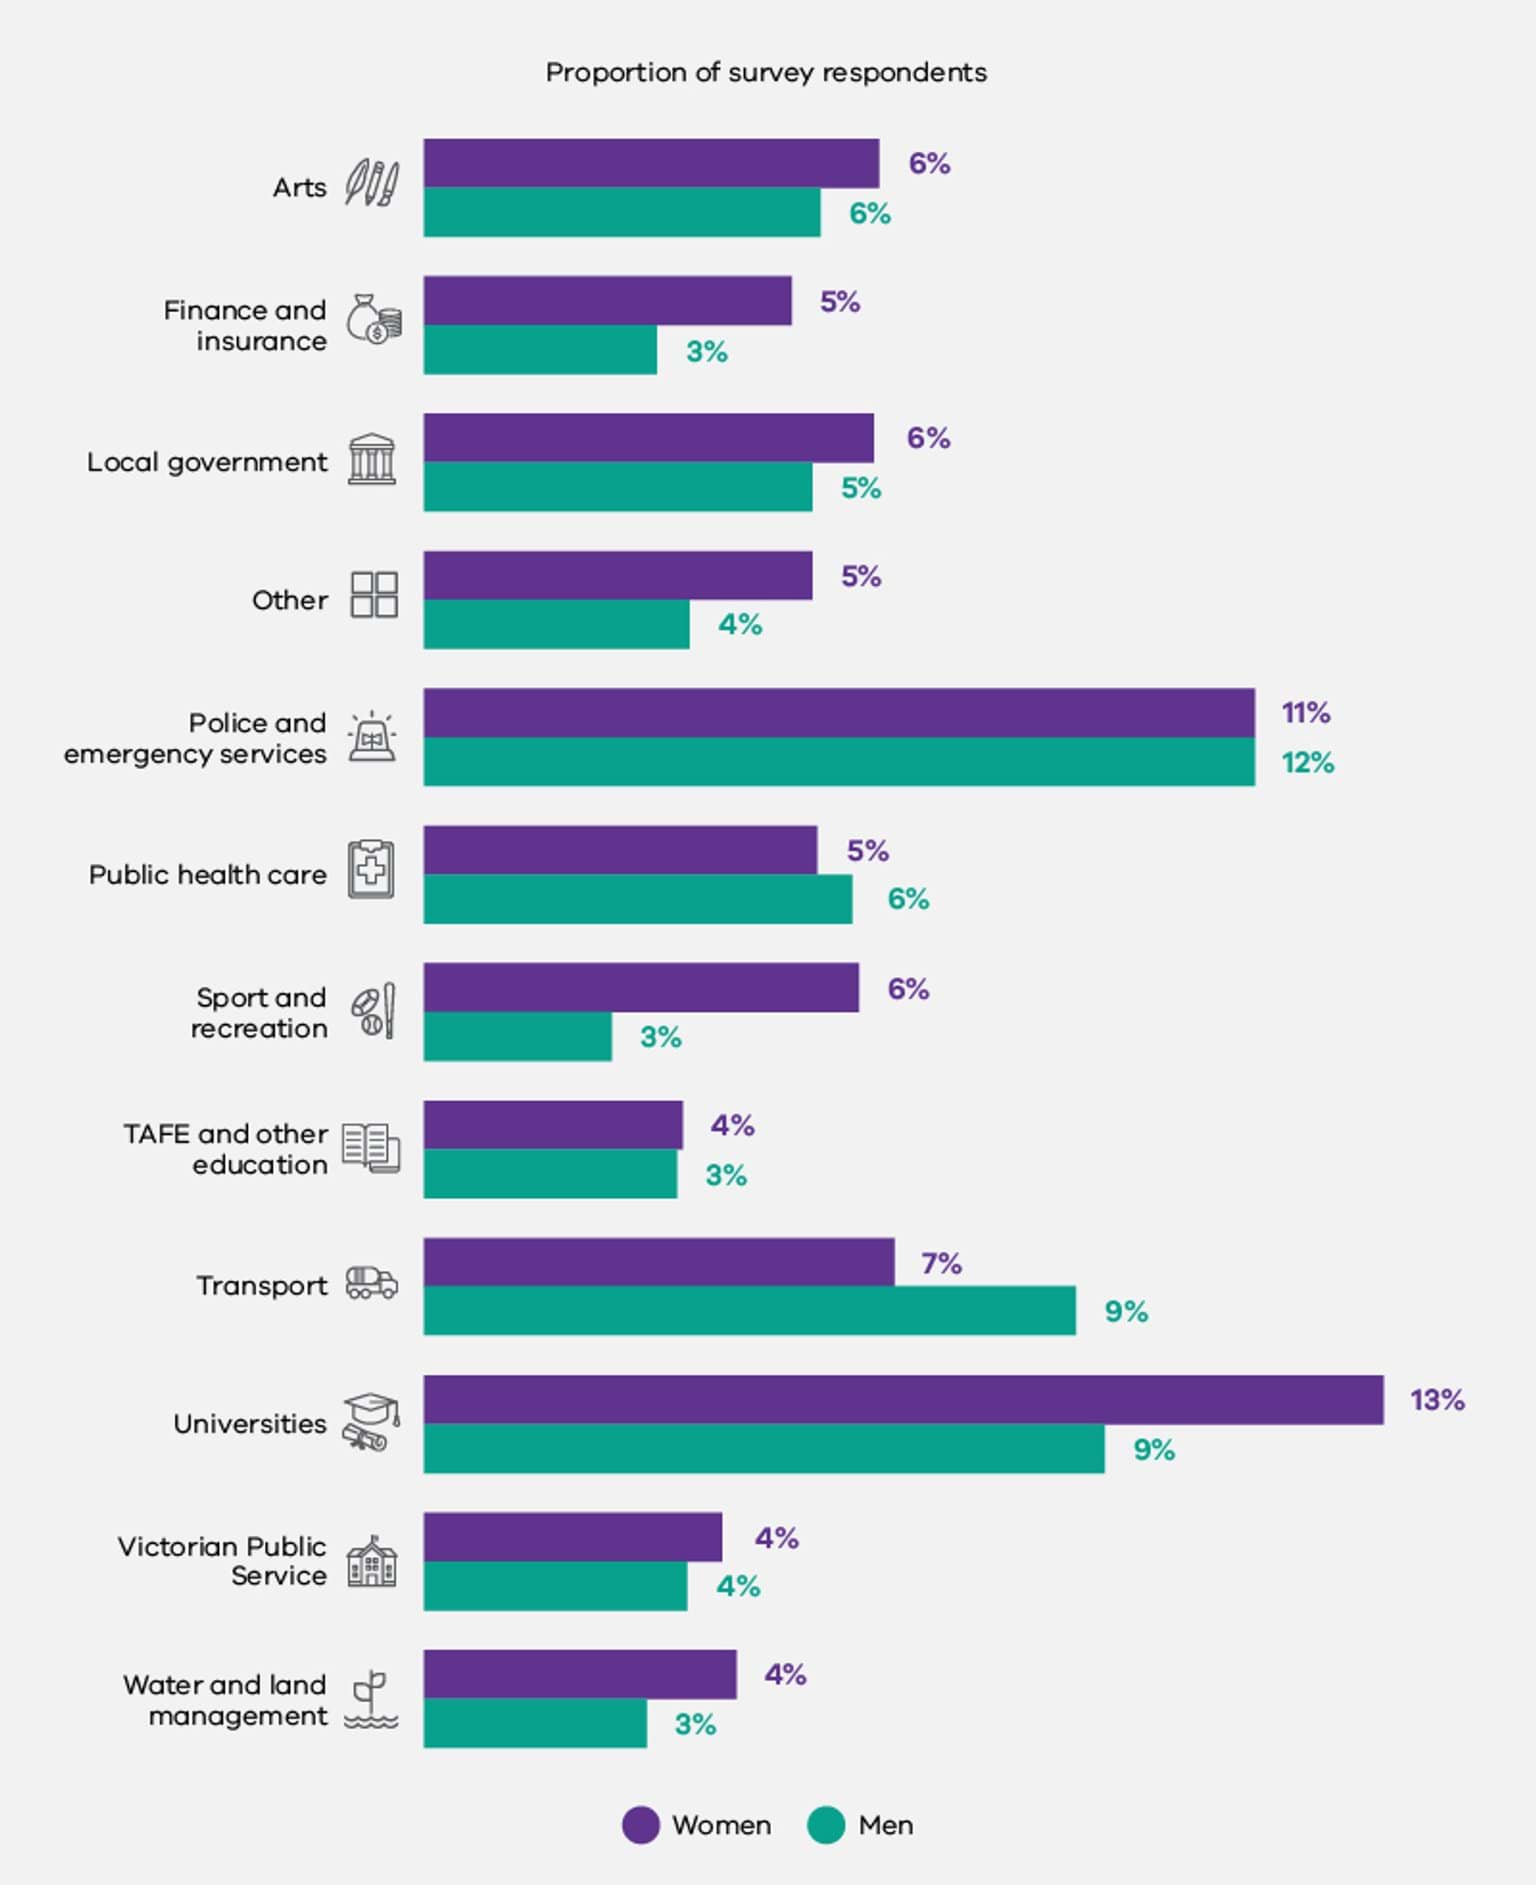
Among survey respondents, women and men reported experiencing workplace discrimination48 at similar rates (Figure 1.7, below). About 6% of men and women said they had experienced discrimination at work in the previous 12 months.
Reports of discrimination were most common for women working in the University industry group (13%) and for men working in the Police and Emergency Services industry group (12%).
Fig 1.7. Proportion of survey respondents who reported experiencing discrimination, by industry and gender
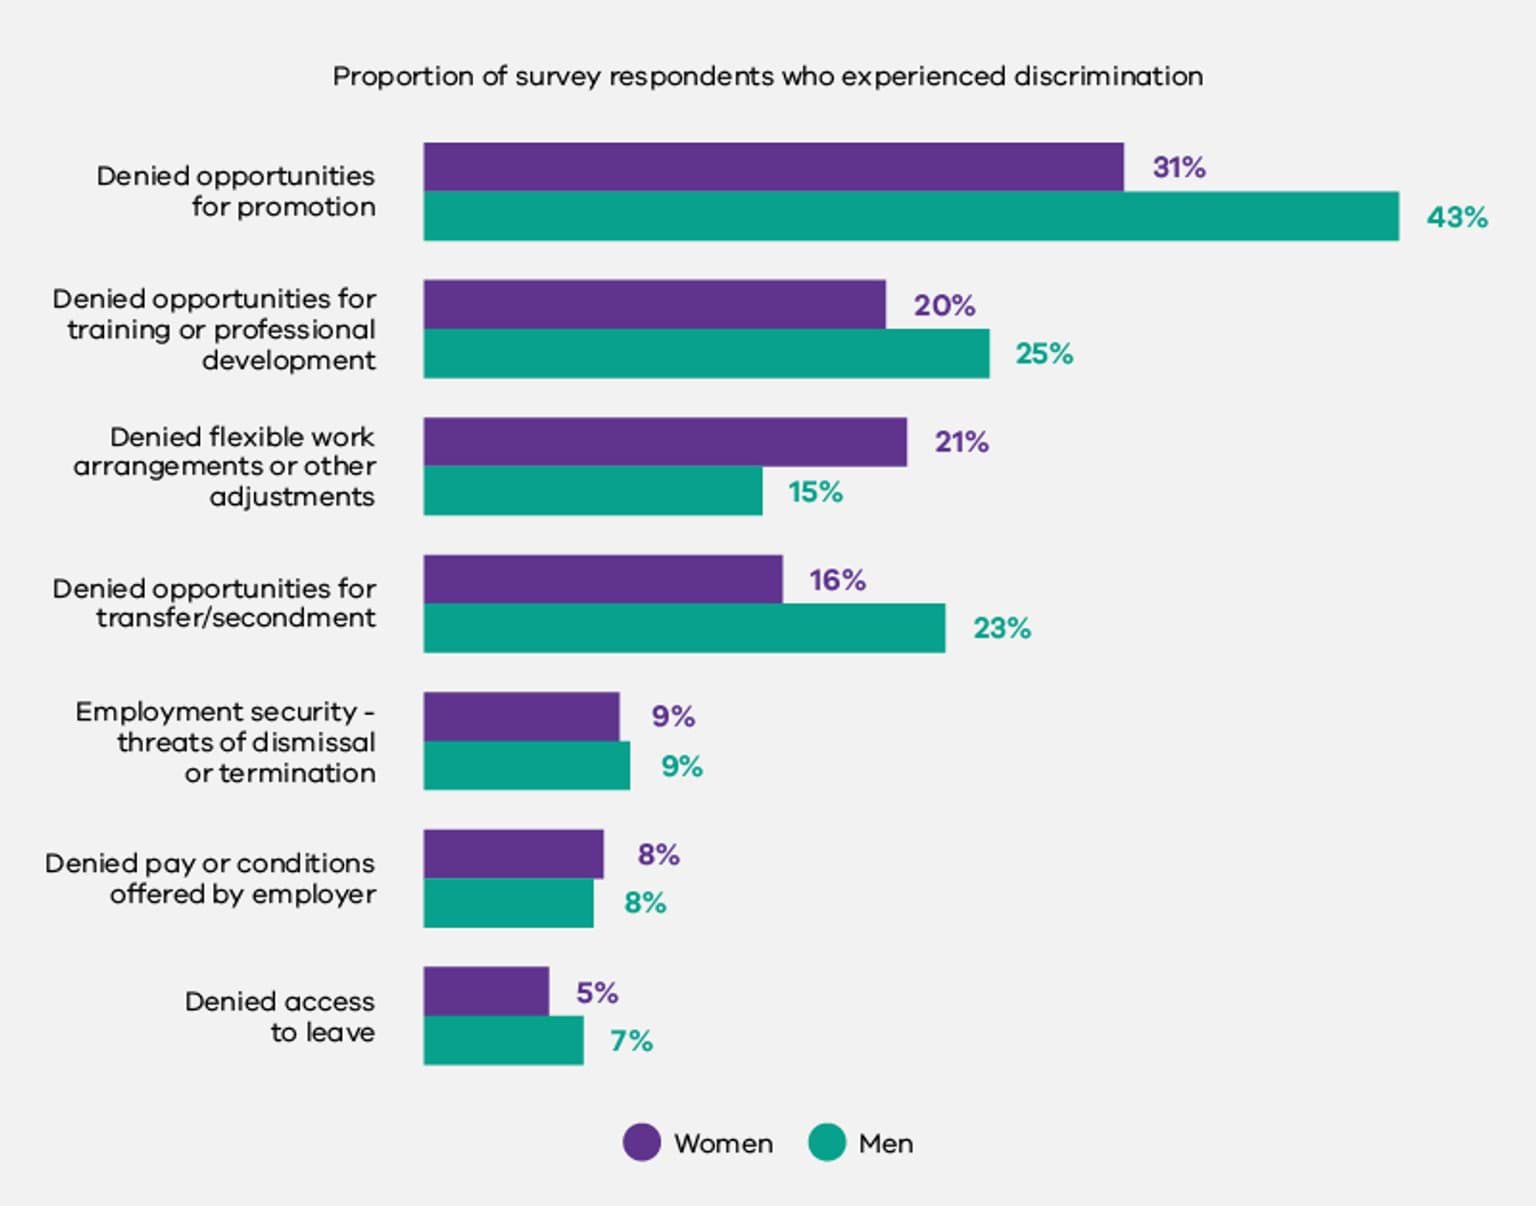
As can be seen in Figure 1.8 below, for both women and men, the most common type of discrimination reported was being denied opportunities for promotion.49 This was reported by nearly half of those men who said they had experienced discrimination compared to less than one-third of women.
The only form of reported discrimination that was more common for women than for men was being denied flexible work arrangements or other adjustments. This affected 21% of women who said they had experienced discrimination and 15% of men.
Fig 1.8. Types of discrimination reported by survey participants, by gender
Discussion
Increasing the representation of women and gender diverse people in traditionally majority-men industries and occupations – including leadership roles, as well as increasing the representation of men in traditionally majority-women occupations and industries, can lead to a range of positive outcomes. This may include a decrease in organisational and industry-specific pay gaps, improved organisational performance and workplace productivity, as well as increased safety.50
The Commission’s data revealed an imbalance in the proportion of women and men working in full-time roles (with 42% of women working part time, compared to 15% of men). This imbalance is greater than in countries such as Canada and the UK.
It is important to acknowledge the possible connection between the availability and accessibility of flexible working arrangements (or lack thereof) in Australian workplaces and the higher proportion of women working on a part-time basis.51 It has been hypothesised that an overrepresentation of women in part-time work may ‘reflect the fact that a lack of flexibility often drives women out of the full-time workforce, either into part-time or casual roles, or away from the workforce altogether’.52 This explanation is reinforced by the significant amount of support offered to workers in Canada and the UK to work flexibly, and the comparatively high proportion of women working on a full-time basis in these countries. It is also supported by a study of leading practice organisations in gender equality strategy, policy, and implementation in Australia.53
While the Commission’s data identified several industry groups with strong women’s workforce representation, these industries did not demonstrate a proportionate number of women in management positions. For example, women comprised 61% of the workforce in the Finance and Insurance industry group, yet only 40% of senior management positions and 17% of CEO positions. Similar findings in the private sector have been linked to a ‘Glass Elevator’ effect experienced by some men in majority-women industries – which propels them into leadership positions at a quicker pace than their colleagues who are women.54
Interestingly, the data shows that while women comprised only 36% of the Police and Emergency Services industry group, they held 46% of senior leadership positions. Similarly, while women comprised only 25% of the Transport industry group, they held 22% of senior leadership positions. Given women’s overall underrepresentation in these industry groups, this may suggest that some majority-men industry groups are successfully engaging in deliberate strategies to increase women in leadership (although this has not yet flowed through to CEO positions in these industries).
Research has found that having women in CEO positions can create a ‘trickle-down effect’ (whereby increasing the number of women at the top of an organisation increases women’s representation in the level immediately below).55 Certainly, in this dataset, the industry groups with the highest proportion of women CEOs also have the highest proportion of women in senior leadership positions. For example, the Arts and ‘Other’ industry groupings have the highest proportion of women CEOs (with 57% of CEO positions held by women) and the two highest proportions of women in senior leadership positions (60% and 64% respectively). Trend analyses within the Commission’s dataset over coming years will allow investigation into whether this ‘trickle-down’ effect of increasing women in leadership can be identified.
Data from the first workplace gender audit under the Act shows that defined entities achieved greater gender balance on their governing bodies than both private boards and government-appointed boards Australia-wide. This success can, at least in part, be attributed to Victorian Government targets for government board appointments. In place since 2015, these targets require 50% of new government board appointments to be women.56 The success of this gender target framework in Victoria reflects existing research demonstrating that targets and quotas for women in leadership are effective in accelerating women’s representation at the top of organisations.57
Forms of workplace discrimination can contribute to gender inequality in workforce composition, occupational distribution, and organisational leadership.58 For example, denial of career development opportunities as a result of discrimination on the basis of gender or other attributes can contribute to a lack of diverse leaders in an organisation.
Discrimination may be a contributing factor to imbalances in workforce gender distribution across different levels among defined entities. Notably, industry groups with majority-women workforces do not demonstrate commensurate numbers of women in leadership roles. Discriminatory views or practices within organisations may be implicated in this failure to translate strong women’s representation into strong women’s leadership.
Forms of discrimination can be both direct and indirect, and may relate to gendered expectations, such as rewarding presenteeism and overwork.59 However, it must be noted that a lack of women’s leadership in these industries is likely due to a constellation of factors, including issues related to career development practices, caring responsibilities, leave and flexible work, which are covered in subsequent chapters of this report.
Reports of discrimination within employee survey data can also be shaped by resistance to gender equality, or perceptions of ‘reverse discrimination’. It is notable that the majority of men who reported experiencing discrimination in the survey data from defined entities indicated that they had been denied opportunities for promotion. This may reflect existing data and research on resistance to proactive strategies to increase the representation of women, particularly in majority-men organisations and industries, where men interpret these strategies as a form of gender-based discrimination against them.
The recent review undertaken by the Victorian Equal Opportunity and Human Rights Commission (VEOHRC) into sex discrimination and sexual harassment in Victoria Police showed evidence of this. VEOHRC’s report noted the existence of ‘widespread perceptions among some male employees and a small number of female employees of “reverse discrimination”’, while finding no evidence of actual systemic discrimination against men.60 That survey respondents who were men identified promotion as a key arena where they experienced discrimination could potentially reflect resistance to moves towards greater gender equality in promotion practices.
Recommendations
Regular collection, analysis and reporting of accurate trend data on workforce composition across all levels of an organisational hierarchy (including on boards and decision-making committees), in all occupations and across employment types (full time, part time and casual), and across all business units, divisions and geographical locations, is essential to addressing inequalities in workforce composition and gendered segregation in organisations. Collecting analysing and reporting this data will allow defined entities to understand whether strategies to improve gender equality included in their Gender Equality Action Plans (GEAPs) are working, and if not, where attention may need to be focussed.
The Act requires that defined entities have regard to the disadvantage or discrimination that a person may experience on the basis of Aboriginality, age, disability, ethnicity, gender identity, race, religion and sexual orientation, in addition to gender inequality. In order to do this, organisations need to break down or ’disaggregate’ their workforce data in an intersectional way.
In collecting, analysing and reporting on this data, organisations need to be sensitive to employee safety and privacy considerations and allow employees the discretion to self-identify.61
If an organisation does not currently have access to intersectional data, it is important to plan for how to collect this in future, including how to ensure employees with different attributes feel safe to disclose personal information. Engaging with your workforce – and ensuring diverse participation in this engagement – can help build a culture of safety.62
A review of existing data gaps will help your organisation to plan next steps. You can access further advice on the Commission’s website.63 Further information and recommendations will also be provided in the companion baseline report on intersectional data when this is published in the first trimester of 2023.
Inequalities in the composition of your workforce, the distribution of occupations, or the composition of your organisational leaders can be influenced by various forms of workplace discrimination. This can include bullying and other negative behaviours, the denial of career development opportunities, a lack of support for flexibility or a denial of professional development due to part-time work, a lack of support for carers and parents, or a lack of employment stability. Where people with certain attributes are more likely to experience workplace discrimination, this can contribute to skewed distributions across levels, occupations, or leadership groups in your organisation.
It is therefore important to collect and analyse data regarding workplace discrimination, in order to identify concerning trends and address inequalities.64 For defined entities, the employee experience survey data component of your workplace gender audit can assist in identifying which cohorts within your organisation are likely to report the experience of discrimination, and in what form.
In addition, centralising the reporting of discrimination incidents, as well as ensuring multiple safe channels for reporting (including one to leadership) can assist in identifying and tracking discrimination. You may also consider other avenues to collect qualitative data about employees’ experiences of discrimination, particularly for those from marginalised communities.65 Engaging with your staff, as well as relevant staff networks and experts from different communities can also assist you to approach this sensitively.
References
- Australian Bureau of Statistics (ABS) (July 2022), ’Table 5: Labour force status by Sex, Victoria - Trend, Seasonally adjusted and Original’, Labour Force, Australia, accessed 22 July 2022.
- ABS, ‘Labour force status by Sex’.
- Victorian Public Sector Commission (VPSC), Employee demographics and diversity, VPSC, accessed 21 July 2022.
- World Economic Forum (WE Forum), Global Gender Gap Report 2021, WE Forum, 2021.
- WE Forum, Global Gender Gap Report 2021, accessed 22 July 2022.
- J Cermak et al., Women in Leadership: Lessons from Australian companies leading the way, McKinsey & Company, 2017, accessed 22 July 2022; KPMG, She’s Price(d)less: The economics of the gender pay gap, KPMG, 2022, accessed 22 July 2022. J Cermak et al., Women in Leadership: Lessons from Australian companies leading the way, McKinsey & Company, 2017, accessed 22 July 2022; KPMG, She’s Price(d)less: The economics of the gender pay gap, KPMG, 2022, accessed 22 July 2022.
- Workplace Gender Equality Agency (WGEA), Men twice as likely to be highly paid than women, WGEA, accessed 21 July 2022; WGEA, The Gender Pay Gap, accessed 21 July 2022; R Cooper and E Hill, Research-informed principles for a gender equitable recovery from the Covid-19 pandemic, University of Sydney, 2022, doi:10.25910/x3wh-pf20; N Cortis and G Meagher, ‘Recognition at Last: Care Work and the Equal Remuneration Case’, Journal of Industrial Relations, 2012, 54(3): 377-385, doi:10.1177/0022185612442278.
- ABS (June 2022), Labour Force, Australia, accessed 22 July 2022.
- WGEA, Gender segregation in Australia’s workforce, WGEA, accessed 21 July 2022. In fact, industrial segregation as a driver of the gender wage gap has grown by 11% since 2017 to contribute to 20 per cent of the gender wage gap in 2020 (KPMG, She’s Price(d)less, p 58.).
- Parliament of Australia, Gender segregation in the workplace and its impact on women’s economic equality, Australian Government, Finance and Public Administration References Committee, 2017, accessed 22 July 2022.
- Harmony Alliance, A Strategic Approach to Improving Employment Outcomes of Women from Migrant and Refugee Backgrounds in Australia [PDF 211KB], Harmony Alliance, 2019, accessed 22 July 2022.
- Harmony Alliance, Improving Employment Outcomes.
- Evans, Gari Yala (Speak the Truth): gendered insights, Jumbunna Institute of Education and Research and Diversity Council Australia, 2021, accessed 22 July 2022.
- C Frohmader, WWDA Response to Employment Issues Paper, Women with Disabilities Australia, 2020, pp 27-28, accessed 22 July 2022.
- S Waite, ‘Should I Stay or Should I Go? Employment Discrimination and Workplace Harassment against Transgender and other Minority Employees in Canada’s Federal Public Service’, Journal of Homosexuality, 2021, 68(11):1833-1859, doi:10.1080/00918369.2020.1712140; KK Dray et al., ‘Moving beyond the gender binary: Examining workplace perceptions of nonbinary and transgender employees’, Gender, Work & Organisation, November 2020, 27(6):1181-1191, doi:10.1111/gwao.12455; S Davidson, ‘Gender inequality: Nonbinary transgender people in the workplace’, Cogent Social Sciences, 2016, 2(1), doi:10.1080/23311886.2016.1236511.
- For the first time under Australian gender equality reporting legislation, organisations covered by the Act were required to provide data disaggregated not only by gender, but across a range of attributes. As outlined in the Introduction, the Commission will publish insights from this intersectional data in a companion report on intersectionality, to be released in 2023.
- This includes employees identifying as non-binary, agender and bigender. As many organisations are yet to collect meaningful data on gender diversity, we do not know the true gender composition of the public sector workforce, however we expect the real proportion of gender-diverse individuals to be higher than 0.1 per cent. This is based on recent international research that has found that over 50% of transgender and non-binary people hide their identity at work (D Baboolall and S Greenberg, ‘Being transgender at work’, McKinsey Quarterly, 10 November 2021, McKinsey & Company, accessed 22 July 2022; Kantar, DIVA, and Stonewall, The Diva Survey - LGBT+ Women and Non-Binary People’s Insight 2021, 2021, accessed 22 July 2022.
- S Sansonetti and E Davern, Women and Transport (European Parliament: Policy Department for Citizens’ Rights and Constitutional Affairs, 2021), 38-40, accessed 22 July 2022; Transport Canada, Minister Garneau highlights the roles women play in Canada’s transportation system: Transcript, accessed 22 July 2022.
- Partnership for Maternal, Newborn & Child Health (PMNCH), Women in Global Health, PMNCH, accessed 22 July 2022.
- OECD, Health at a Glance 2021: OECD Indicators OECD, p 8, accessed 22 July 2022.
- Sansonetti and Davern, Women and Transport, pp 38-40.
- Sansonetti and Davern, Women and Transport, pp 38-40.
- Transport Canada, Minister Garneau highlights the roles women play.
- WGEA, Australia’s gender equality scorecard: Key results from the Workplace Gender Equality Agency’s 2020-21 employer census, February 2022, p 5, accessed 22 July 2022.
- NSW Public Service Commission, Workforce Profile Report 2020, Chapter 6: Gender, accessed 25 July 2022.
- Statistics Canada, Sex, Gender and Sexual Orientation, accessed 22 July 2022.
- Office for National Statistics, EMP01: Full-time, part-time and temporary workers (seasonally adjusted [dataset, 19 July 2022], United Kingdom, accessed 25 July 2022.
- T Jones, ‘Female-to-Male (FtM) transgender employees in Australia’ in T Köllen (ed) Sexual orientation and transgender issues in organizations: global perspectives on LGBT workforce diversity, Springer, Switzerland, 2016, pp 101-116, doi:10.1007/978-3-319-29623-4_6.
- G Hunt and M Pelz, ‘Transgender Rights in Canada: Legal, Medical and Labour Union Activities’ in T Köllen (ed), Sexual orientation and transgender issues in organizations: global perspectives on LGBT workforce diversity, Springer, Switzerland, 2016, pp 133-147, doi:10.1007/978-3-319-29623-4_8.
- NSW Public Service Commission, Workforce Profile Report 2021, Chapter 6: Gender, pp 36-44.
- UK Cabinet Office, Statistical Bulletin: Civil Services Statistics: 2021, accessed 22 July 2022.
- Te Kawa Mataaho Public Service Commission, Gender representation in the Public Service, New Zealand, accessed 22 July 2022.
- WGEA, Women in Leadership, accessed 22 July 2022.
- S Devillard et al., The Power of Parity: Advancing Women’s Equality in Canada, McKinsey Global Institute, McKinsey & Company Canada, 2017, p 54, accessed 22 July 2022.
- WGEA, Women in Leadership.
- Department of the Prime Minister and Cabinet, Gender Balance on Australian Government Boards: Report 2020-21, Australian Government, 2021, accessed 22 July 2022.
- Deloitte, Progress at a snail’s pace: Women in the Boardroom, Seventh Edition, accessed 22 July 2022.
- Note that the Women on Boards commitment applies to Victorian courts and all boards, except for statutory offices or officers, small Crown land committees of management, unpaid cemetery trusts, and school councils. It also does not apply to universities. The Victorian Government also has a target of having at least 50 per cent women councillors and mayors in local government by 2025 (Victorian Government, Women on Boards Commitment, accessed 25 July 2022; Local Government Victoria, Women Leading Locally, Victorian Government, accessed 25 July 2022..
- Statistics Canada, Proportion of women and men employed in occupations, annual [dataset, 7 January 2022], accessed 22 July 2022.
- Office for National Statistics, Understanding the gender pay gap in the UK, United Kingdom, 2018, accessed 22 July 2022.
- This includes discrimination on the basis of any of the following attributes: Age, disability, employment activity, gender identity, industrial and/or political activity, marital status, parent or carer status (including pregnancy and breastfeeding), physical features, race, religious belief or activity, sex, sexual orientation (including expunged homosexual conviction), or lawful sexual activity, personal association with someone who has any of the above attributes (whether as a relative or otherwise).
- This includes discrimination on the basis of any of the following attributes: Age, disability, employment activity, gender identity, industrial and/or political activity, marital status, parent or carer status (including pregnancy and breastfeeding), physical features, race, religious belief or activity, sex, sexual orientation (including expunged homosexual conviction), or lawful sexual activity, personal association with someone who has any of the above attributes (whether as a relative or otherwise).
- Cermak et al., Women in Leadership; R Cassells and A Duncan, Gender Equity Insights 2021: Making it a priority, Bankwest Curtin Economic Centre and WGEA Gender Equity Insights Issue 6 , 2021, accessed 22 July 2022; Australian Human Rights Commission (AHRC), Respect@Work: National Inquiry into Sexual Harassment in Australian Workplaces, AHRC, 2020, p 20, accessed 22 July 2022.
- For further discussion of flexible working arrangements and gender equality, see Chapter 5 of this report, ‘Leave and flexible work’.
- T Fitzsimmons et al., Employer of Choice for Gender Equality: Leading practices in strategy, policy and implementation, AIBE Centre for Gender Equality in the Workplace, 2020, p 18, accessed 22 July 2022.
- Fitzsimmons et al., Employer of Choice for Gender Equality.
- D Jones, ‘Gender and power: Male and female teachers’ interactions in early years contexts’, Perspectives in Education, 2006, 24(1): 27-37, as later applied in Fitzsimmons et al., Employer of Choice, p 17.
- JA Gould et al., ‘Gender diversity from the top: the trickle-down effect in the Australian public sector’, Asia Pacific Journal of Human Resources, January 2018, 56(1):6-30, doi: 10.1111/1744-7941.12158.
- Victorian Government, Women on Boards Commitment, accessed 25 July 2022; Local Government Victoria, Women Leading Locally, Victorian Government, accessed 25 July 2022.
- V Sojo et al., ‘Reporting requirements, targets, and quotas for women in leadership’, The Leadership Quarterly, 2016, 27(3): 519-536. doi:10.1016/j.leaqua.2015.12.003.
- C Ammerman and B Groysberg, ‘How to close the gender gap: You have to be systemic’, Harvard Business Review, May-June 2021; DR Eikhof, ‘A double‐edged sword: twenty‐first century workplace trends and gender equality, Gender in Management: An International Journal, 27(1):7-22, doi:10.1108/17542411211199246; L Jones, Women’s progression in the workplace, Global Institute for Women’s Leadership & Government Equalities Office, UK, October 2019, accessed 25 July 2022.
- Jones, Women’s progression in the workplace.
- Victorian Equal Opportunity and Human Rights Commission (VEOHRC), Independent Review into sex discrimination and sexual harassment, including predatory behaviour, in Victoria Police: Phase 3 audit and review – Aug 2019, VEOHRC, accessed 27 July 2022.
- Commission for Gender Equality in the Public Sector (CGEPS), How do I maintain my employees’ privacy?, CGEPS, 2021, accessed 26 July 2022.
- Fitzsimmons et al., Employer of Choice for Gender Equality: Leading practices in strategy, policy and implementation
- CGEPS, Applying intersectionality: Workplace gender auditing and analysis, CGEPS, 2022, accessed 26 July 2022.
- Fitzsimmons et al., Employer of Choice for Gender Equality.
- Fitzsimmons et al., Employer of Choice for Gender Equality.
Updated