

Where pay gaps hit hardest
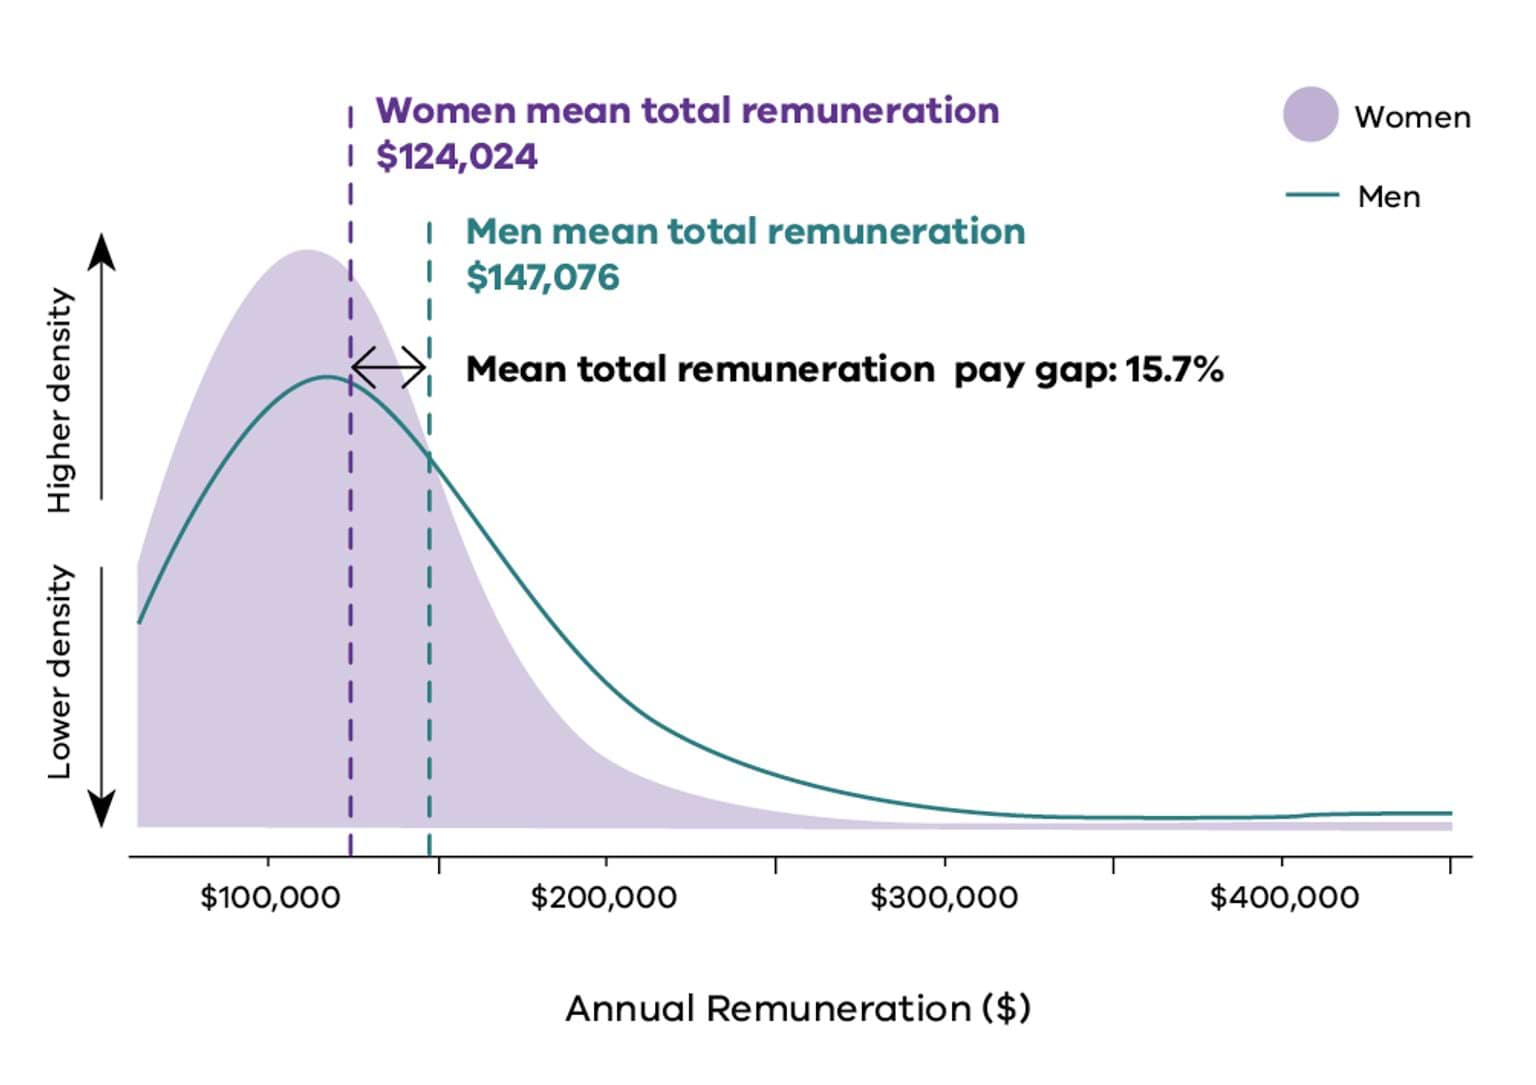
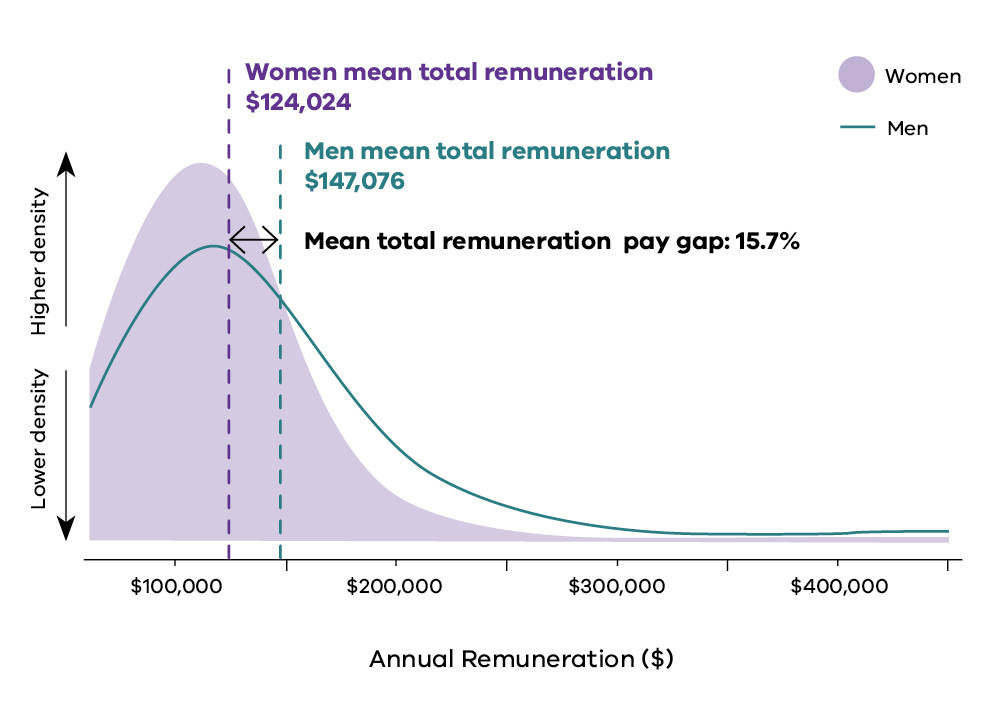
The gender pay gap in Victoria’s public sector is 15.7%.
That means that women, on average, are missing out on $23,052 per year, compared to men.
This pay gap sets women in the public sector back financially over a lifetime.
Women in certain industries, job roles, locations and age brackets are set back further than others by wider gender pay gaps. So, who is hurt most by the current gender pay gap – and how much are they losing?
Occupations and industries
Mean total remuneration pay gaps in 2025:
- Public health care: 29.0% ($53,267)
- Community and personal service workers: 24.1% ($29.892)
- Sales workers: 20.3% ($25,371)
- Professionals: 16.5% ($27,086)
Women in regional areas
Mean total remuneration pay gaps in 2025: 17.0% ($23,644)
Women aged 45 and above
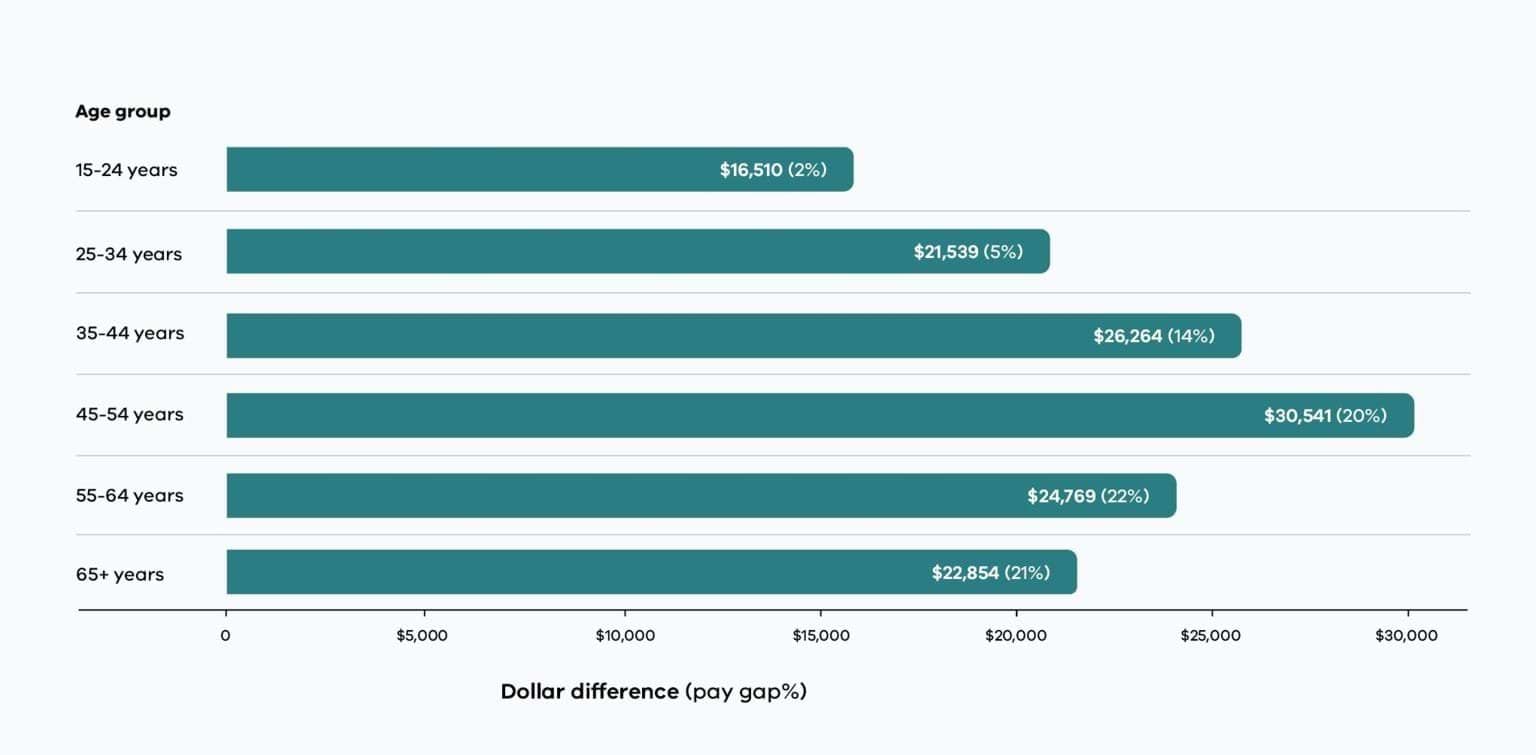
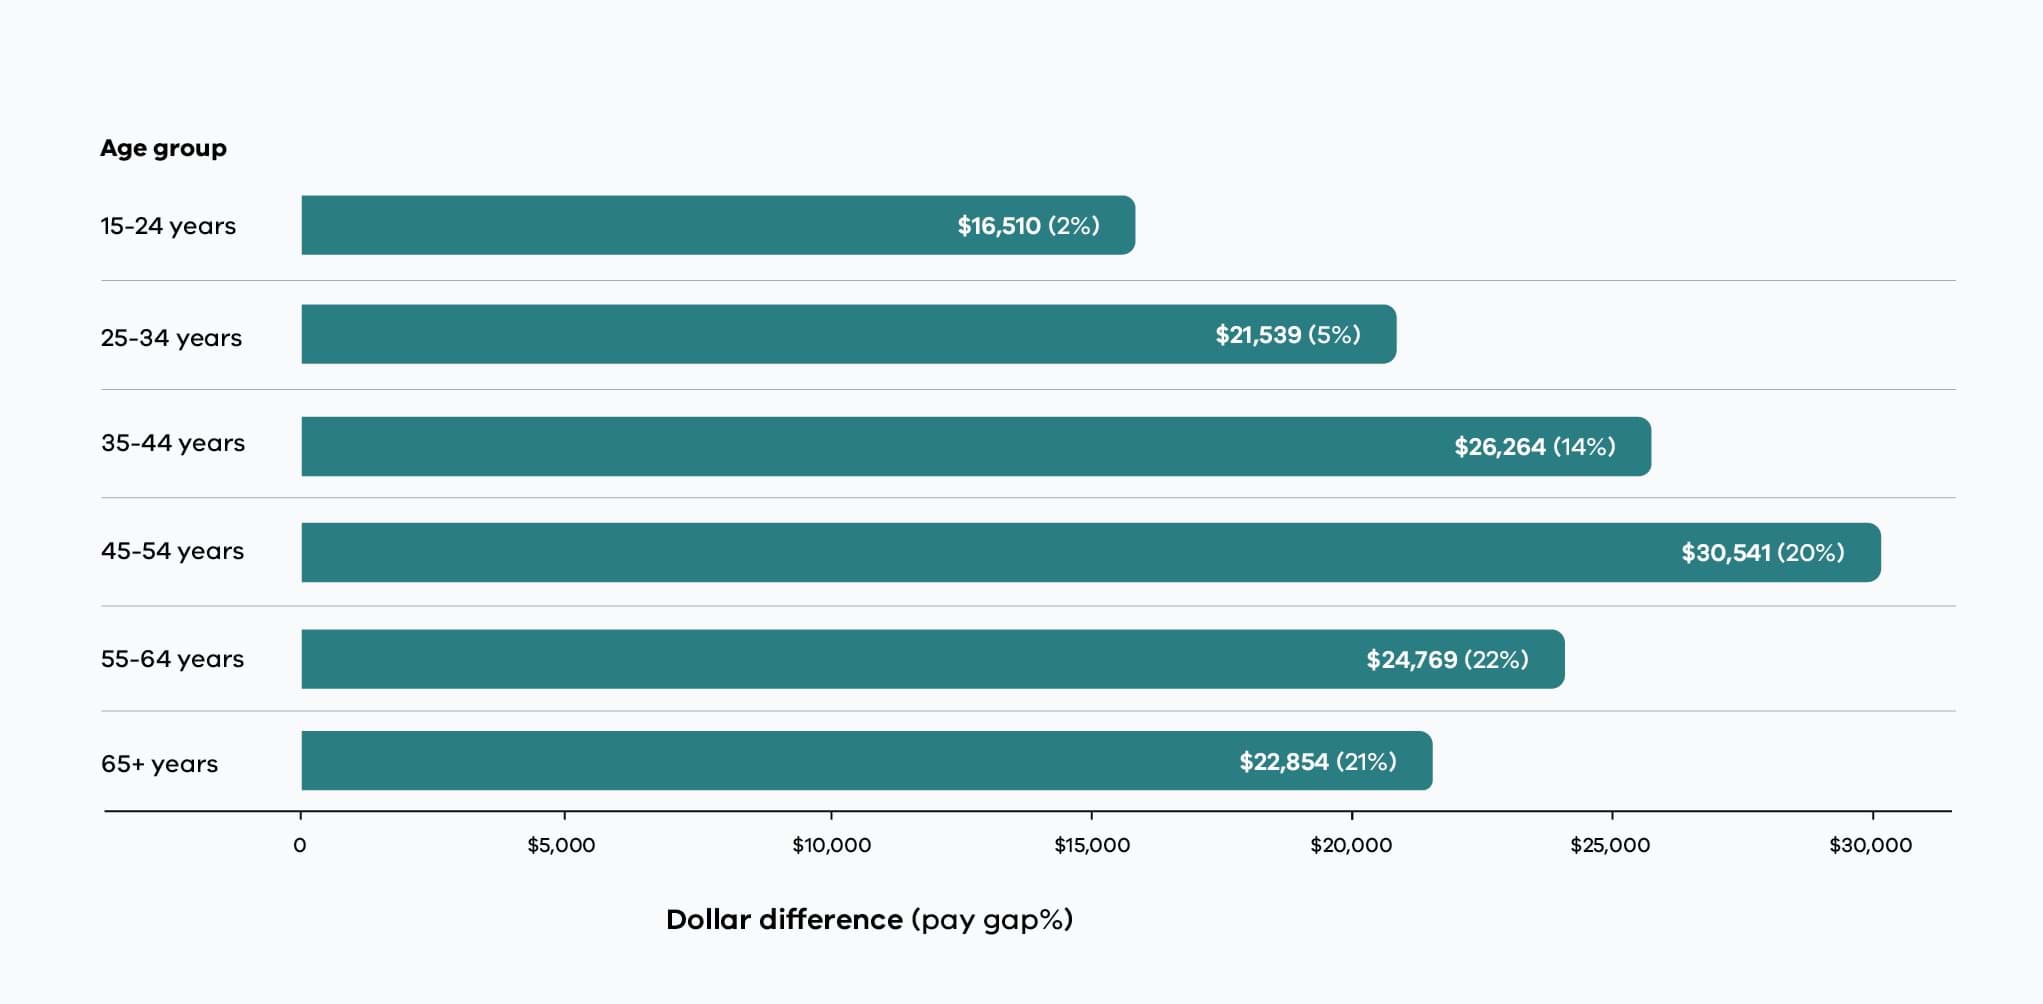
The gender pay gap is wider for women aged 45 and above.
Women aged 55-64 experience the widest pay gap at 22%. This means on average they miss out on $24,769 each year compared to men in the same age bracket.
Figure 1: Gender pay gap by age (2025)
Gendered segregation drives the pay gap
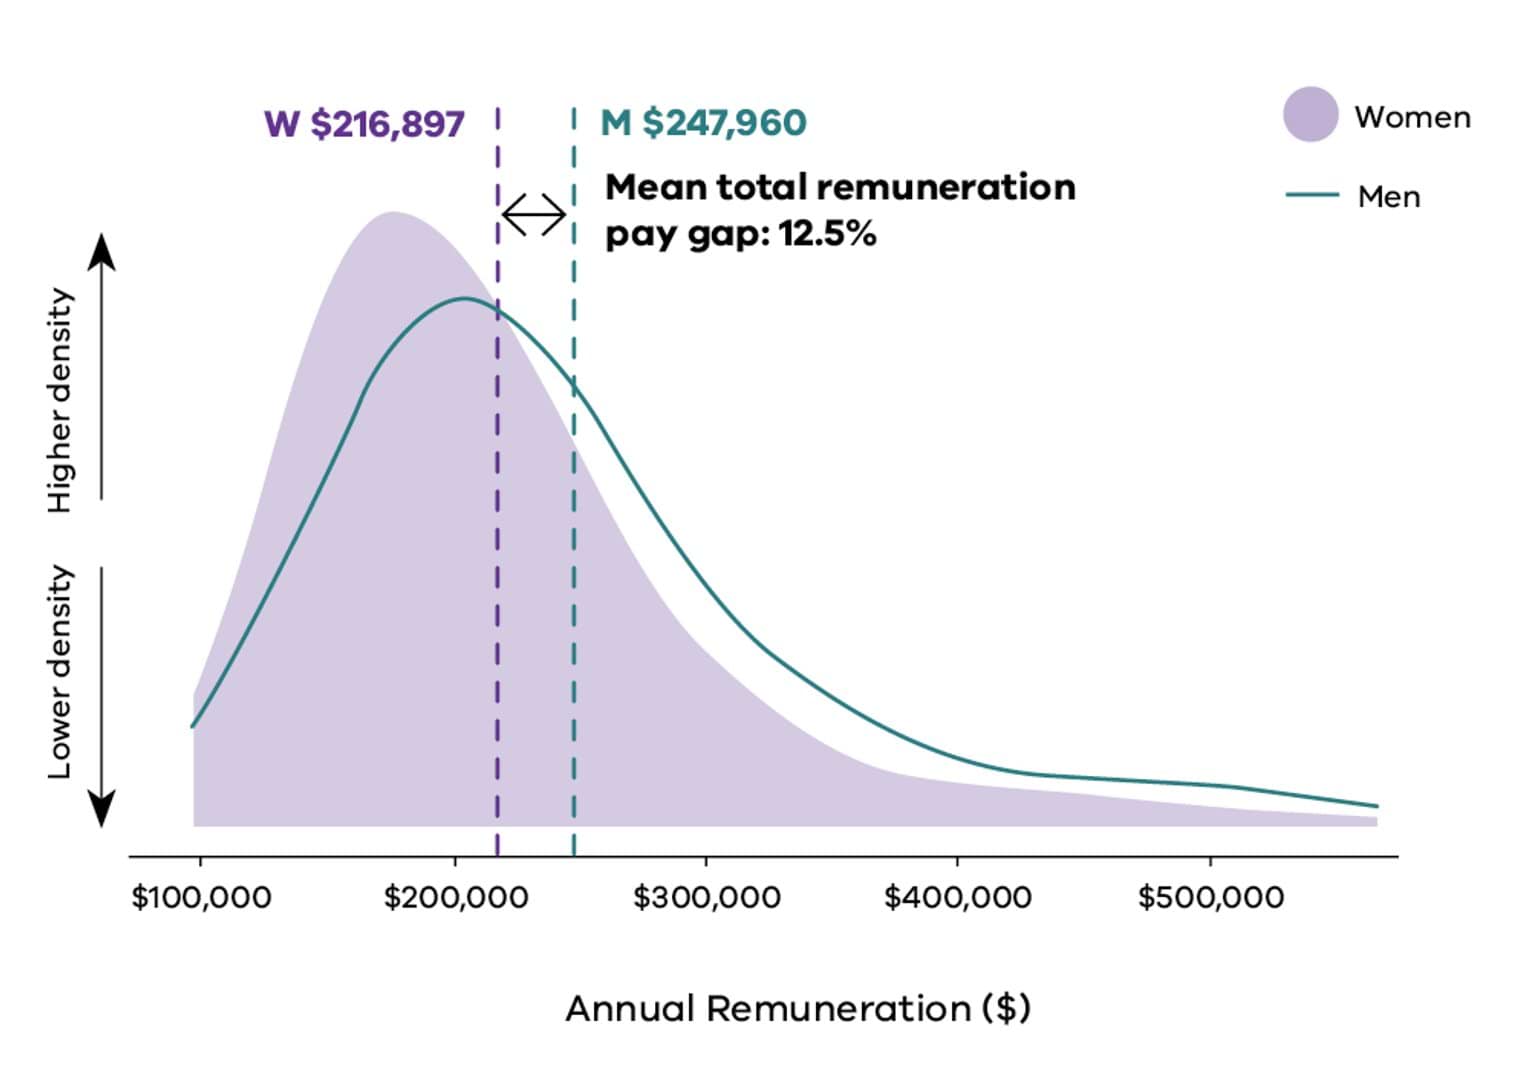
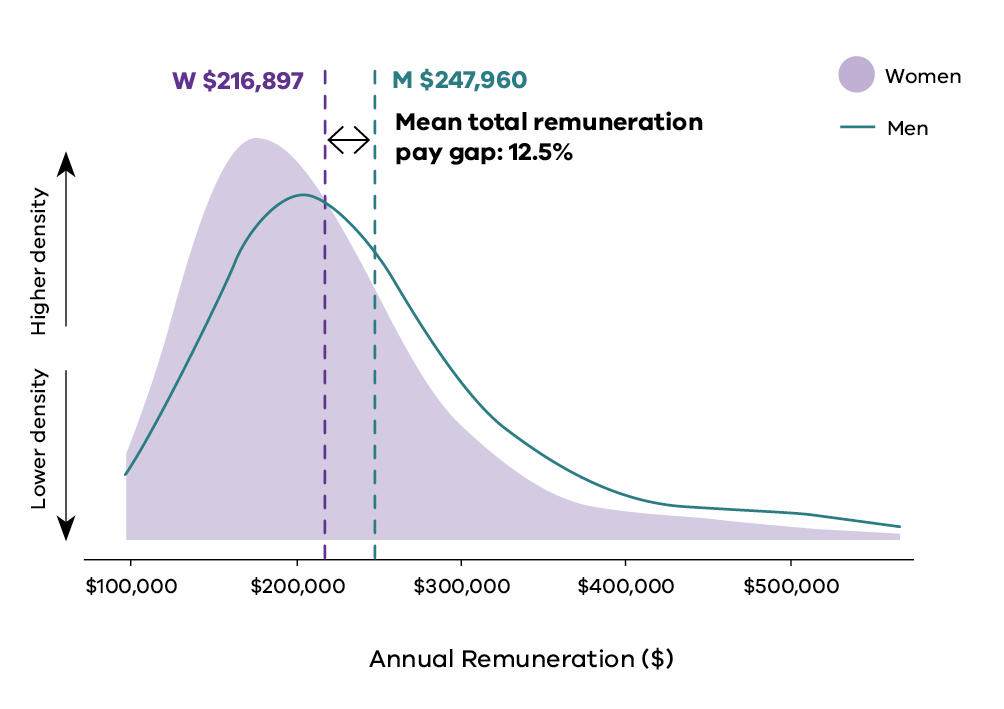
At the sector level, pay gaps persist because more men hold higher paid positions. Women hold more roles with mid-range salaries.
Within industries, the distribution of women and men leads to narrower, or wider, pay gaps.
Note: Figures 2-7 display the central 98% of remuneration values to improve readability (1st to 99th percentile). Extreme values are excluded from the visual range but retained in the mean total remuneration calculations.
Figure 2: Gender pay distribution – all public sector employees (2025)
Local government leads the way
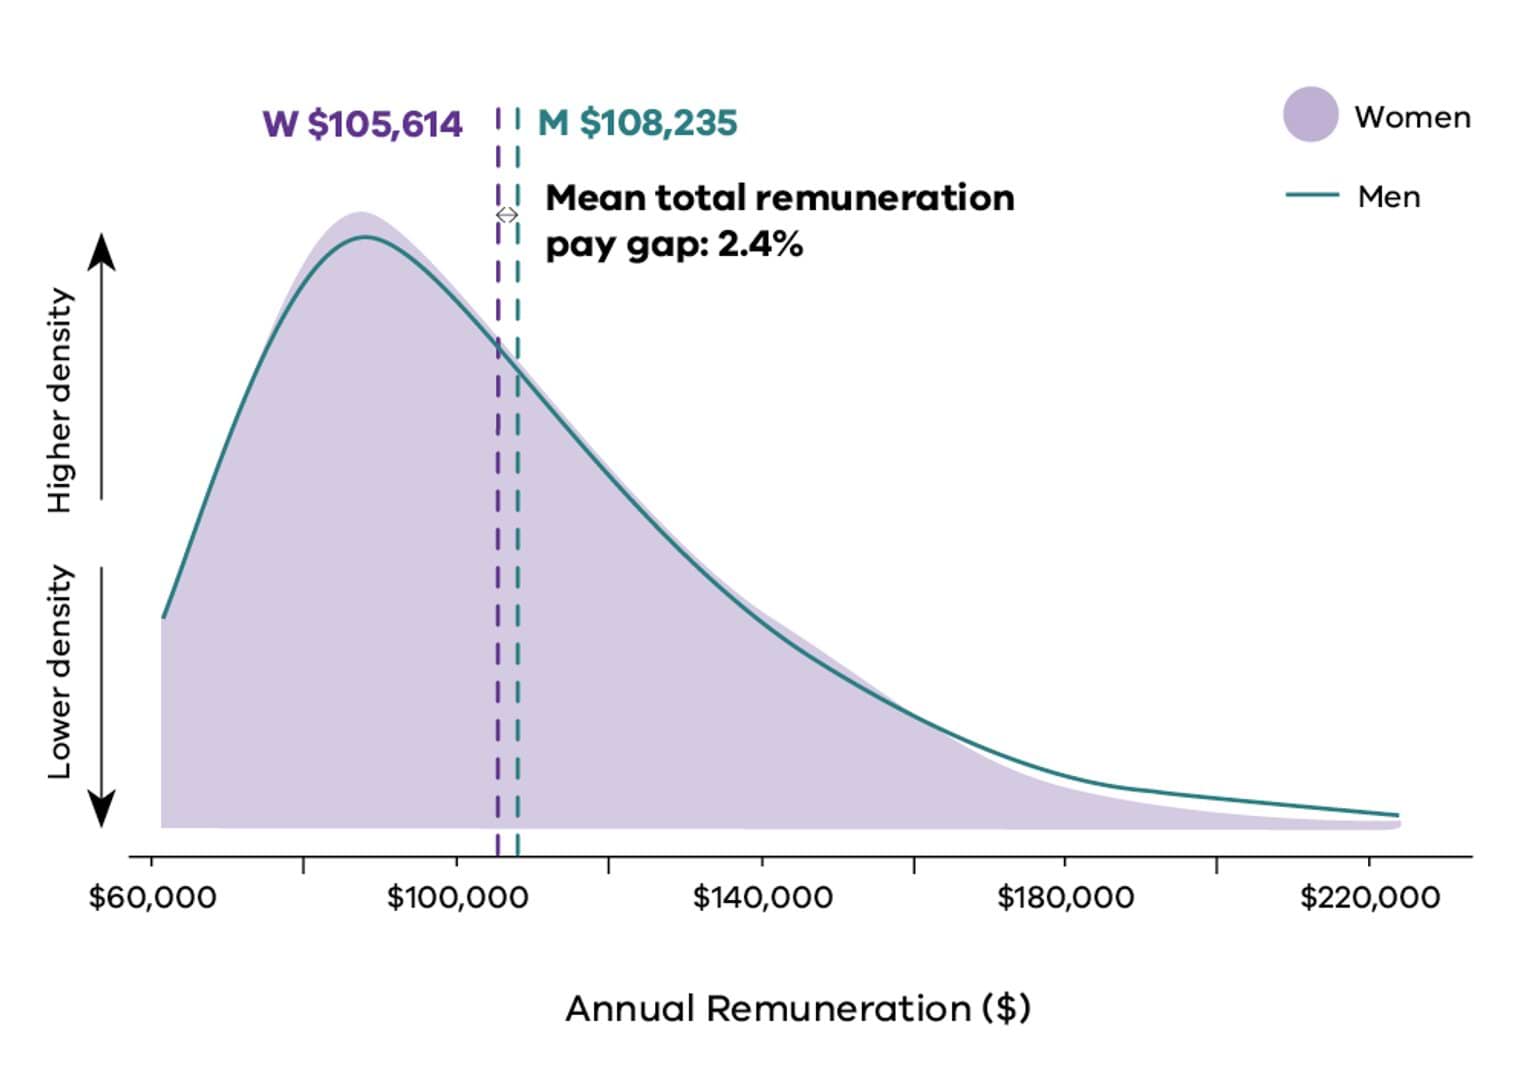
Local government has an even gender distribution across salary bands. The gender pay gap in local government is the lowest of all industries in the public sector.
Figure 3: Gender pay distribution in local government (2025)
More men in high-paid roles drives the gap
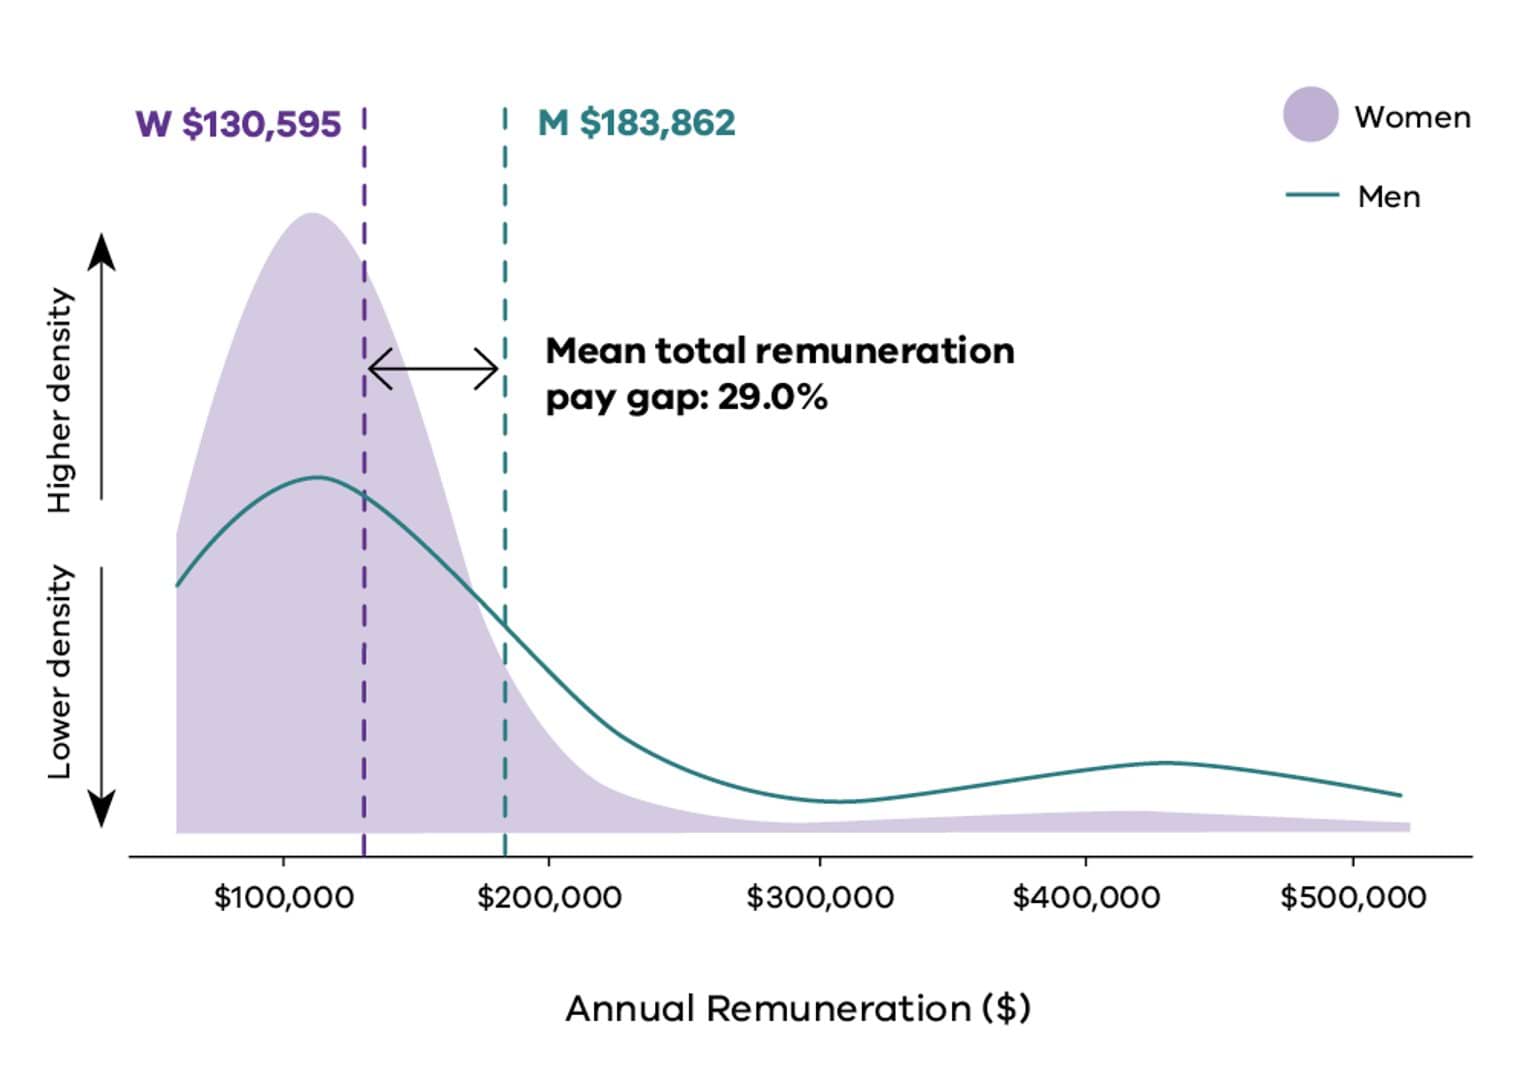
In public health care in 2025, women held more jobs with salaries around $100,000 while men held more high-income roles with salaries above $200,000. This disparity means public health care was the industry with the highest gender pay gap in the public sector, at 29.0%.
Figure 4: Gender pay distribution in public health care (2025)
In transport, finance and insurance, the trend is similar - with more men in higher paid roles driving the gender pay gap.
Figure 5: Gender pay distribution in transport (2025)
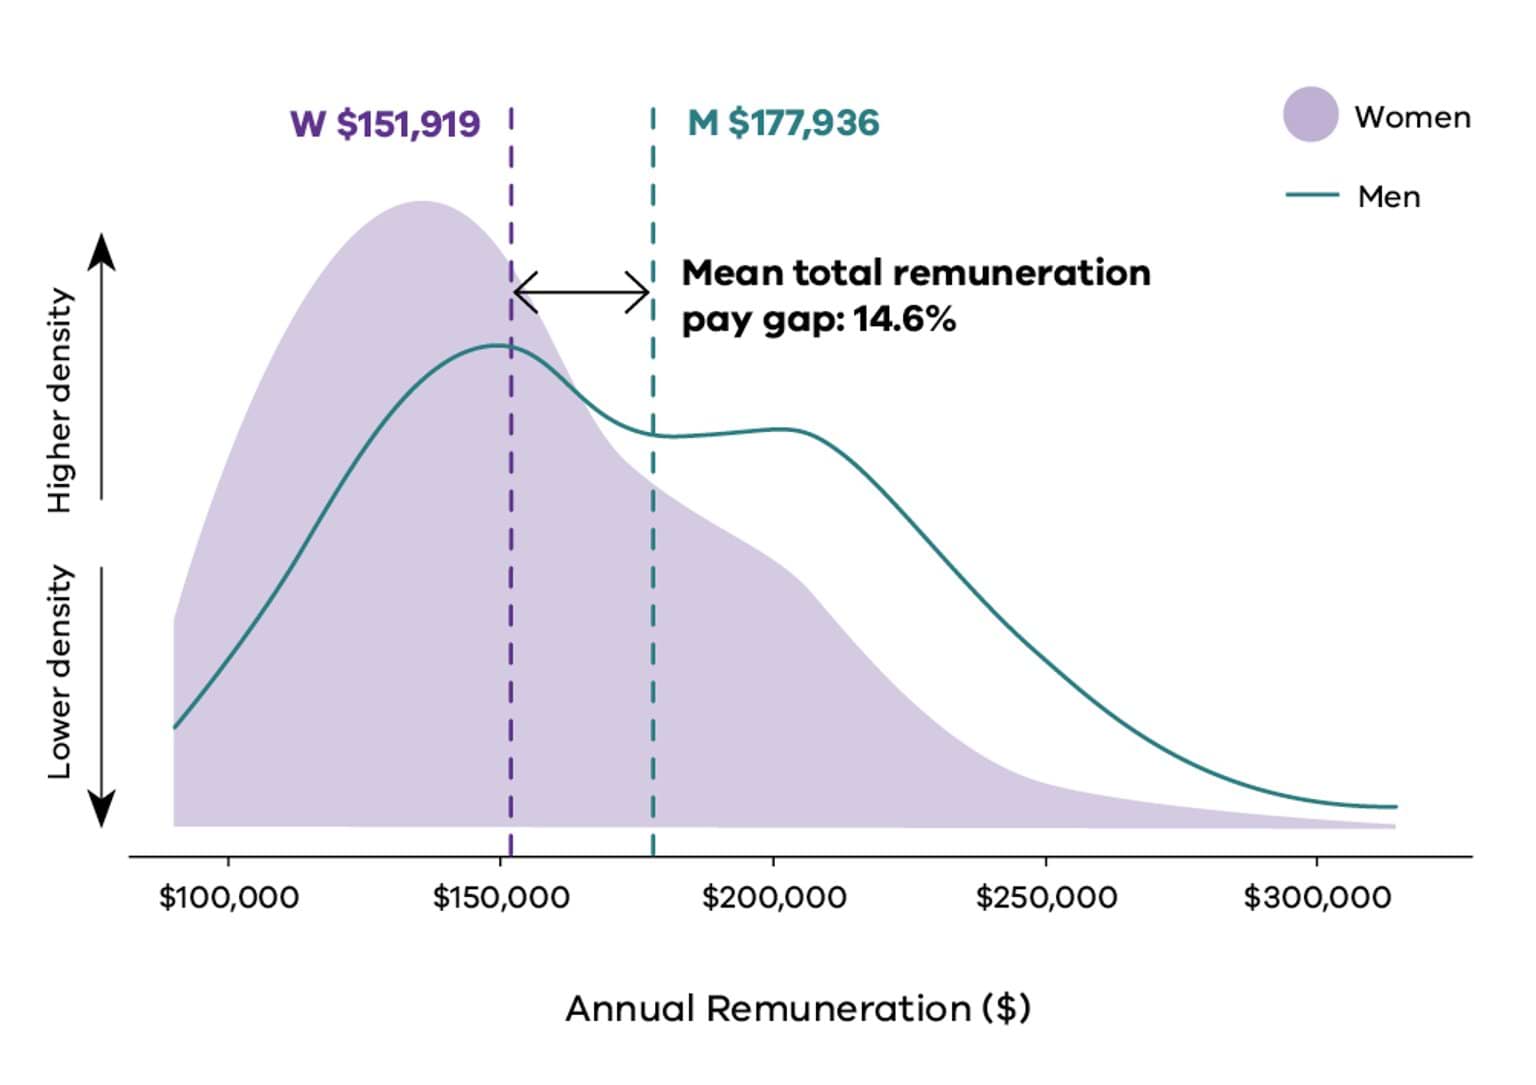
Figure 6: Gender pay distribution in finance and insurance (2025)
The gap for women in senior leadership increased
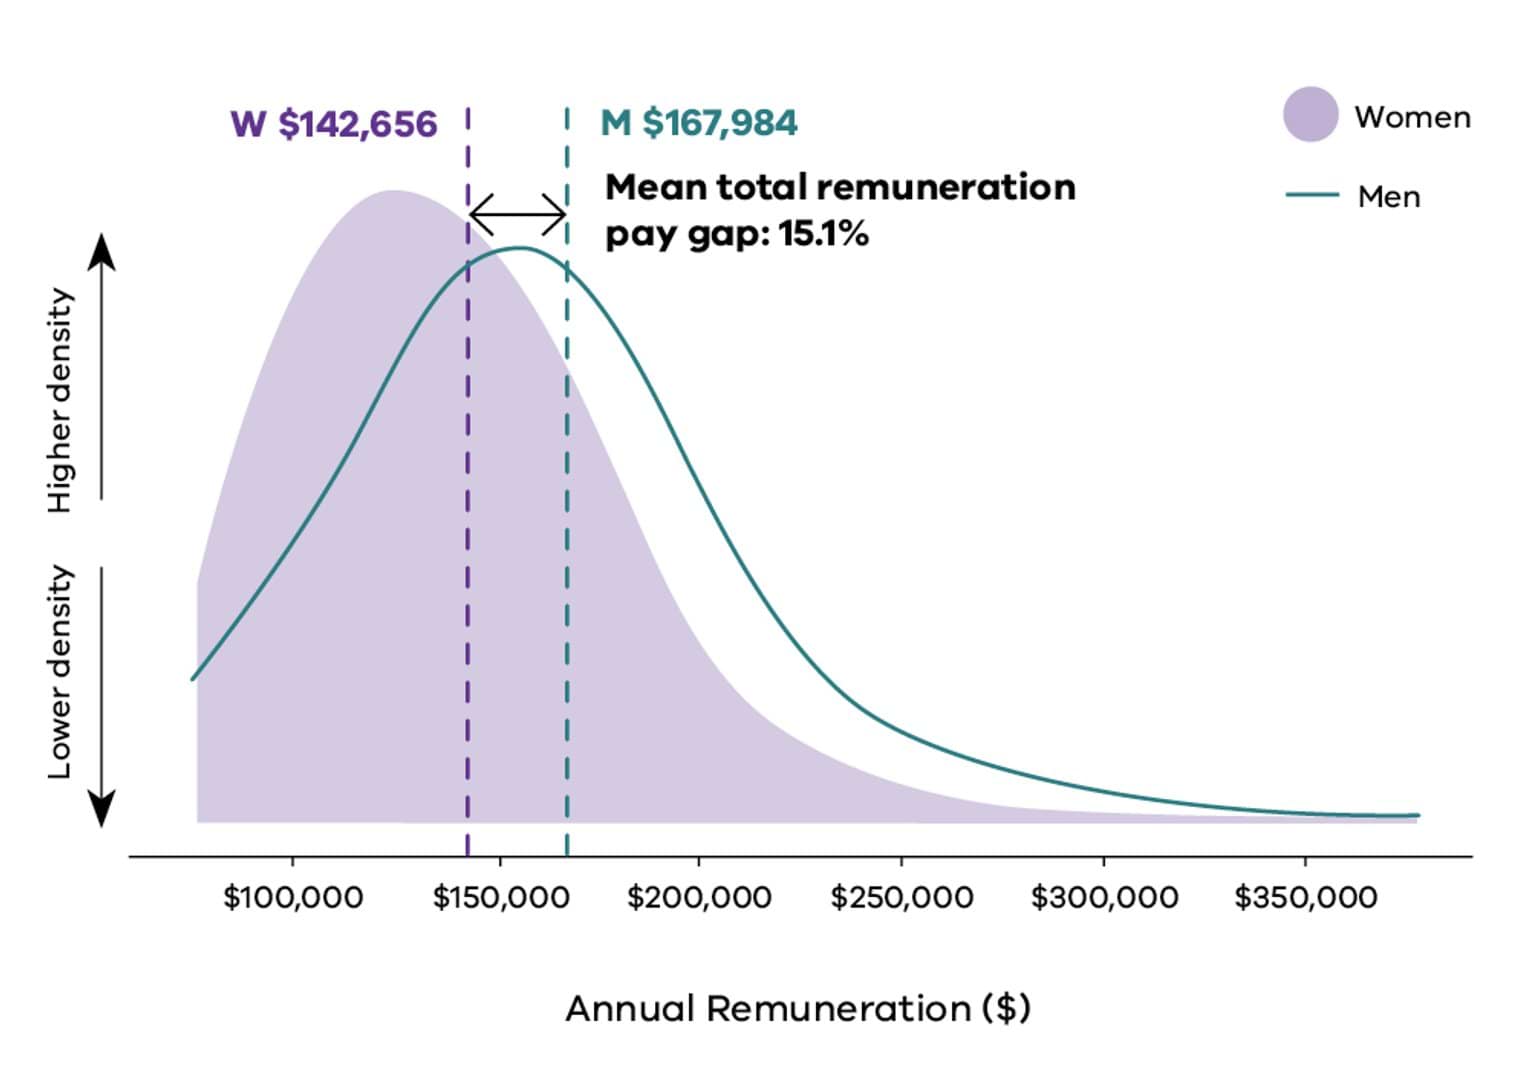
The gender pay gap for senior leaders widened in 2025. More women held senior leadership positions, but they were paid on average $31,063 less than men in senior roles.
Figure 7: Senior leader gender pay distribution (2025)
Change is possible - and it's happening
Between 2021 and 2025, gender pay gaps reduced in traditionally men-concentrated industries and occupations. So, where's positive change happening?
Occupations and industries
- Police and emergency services: pay gap down 6.1 percentage points
- Water and land management: pay gap down 2.9 percentage points
- Labouring roles: pay gap down 9.4 percentage points
- Machinery operators and drivers: pay gap down 3.3 percentage points
- Technicians and trade workers: pay gap down 0.8 percentage points
Updated