

- Date:
- 11 Aug 2026
The State of gender equality in Victoria's public sector 2026 is the most comprehensive picture to date of workplace gender equality across Victoria’s public sector. This report assesses progress at the end of duty holders’ first 4-year gender equality action plans under the Gender Equality Act 2020. It draws on audit data submitted in 2021, 2023 and 2025, by around 300 public sector organisations.
This report examines:
- where measurable progress on workplace gender equality has occurred
- where inequalities persist across the public sector
- where future effort is likely to have the greatest impact.
Acknowledgement of Country
The Commission for Gender Equality in the Public Sector acknowledges and pays respect to the Traditional Owners of the lands. Our office is based on the lands of the Wurundjeri people – the lands on which many of our team members also live and work from home. Other team members live and work on the lands of the Bunurong and Dja Dja Wurrung peoples.
We also acknowledge the Traditional Owners and Custodians of Country throughout Victoria and pay our respects to Elders past and present. We recognise the deep and enduring connection of Aboriginal and/or Torres Strait Islander peoples to Country and their continuing custodianship of the land, waterways, and seas.
We proudly recognise First Nations peoples as having the world’s oldest living cultures, and acknowledge that the heritage, traditions, and customs of Aboriginal communities throughout Victoria are vibrant, rich, and diverse.
We respect that Elders and other leaders of Aboriginal communities in Victoria are critical to redressing inequality and disadvantage and improving outcomes for Victorian women. Their leadership includes First Nations women, lesbian, gay, bisexual, trans and gender diverse, non-binary, sistergirls, brotherboys, intersex and queer folk who drive gender equality across Victoria. We thank them and honour their important work.
As we reflect on previous government policies and practices, we acknowledge the continuing negative impacts on Aboriginal and/or Torres Strait Islander peoples, we recognise and embrace the opportunity to collaborate and work together with First Nations peoples, families, and communities, towards improved economic, social, and cultural outcomes.
Read more in the Commission’s Reconciliation Action Plan.
Commissioner's foreword
Victorians deserve workplaces and communities where fairness isn’t just aspirational – it’s realised. That’s why, five years since the commencement of Victoria’s landmark Gender Equality Act 2020, the pursuit of gender equality remains so important.
In a cost-of-living crisis, more Victorians rely on the public sector for programs and services that are fair and equitable. At the same time, the sector is undergoing significant reform. Job cuts, budget savings measures and the adoption of AI are affecting many parts of the workforce. Periods of rapid change like this carry a real risk: that existing gender inequalities become further entrenched as new systems and structures are built. Organisations have the opportunity – and the responsibility – to design gender equality into those systems, processes, and policies now, to avoid trying to retrofit it later.
The Gender Equality Act requires public sector organisations to proactively address gender inequality in their workplaces, and in the programs, policies and services they deliver to the public. It does this in part, through 7 workplace gender equality indicators that, together, capture how interconnected these issues are. Measuring and driving progress against these indicators is core to the Act’s purpose. For the first time, Victoria has longitudinal, sector-wide data that tracks whether public sector organisations are making measurable progress over time. That transparency and accountability framework is a significant reform in its own right.
The data in this report shows that structural progress is beginning to take hold across parts of the Victorian public sector – including in some areas that have historically been most resistant to change. In 2025, women’s representation in senior leadership increased. More women were working in traditionally men-concentrated occupations and industries. Gender pay gaps narrowed within many organisations and across 7 of the sector’s 11 industries. Men’s uptake of parental leave improved in several industries. These are meaningful signs that change is possible.
But progress is neither consistent nor fast enough. Structural gender inequality continues to shape workplace experiences and outcomes for Victorians every day. There is still work to be done to eliminate sexual harassment in public sector workplaces. Women’s experience of sexual harassment barely shifted at the sector level, and for non-binary and gender-diverse people it increased. The whole-of-sector pay gap has not narrowed since 2021. (It is worth noting, however, that organisations who reported in both 2021 and 2025 improved on average – this means the 2025 gender pay gap reflects broader reporting coverage, and where women and men sit across different industries and pay bands, rather than a decline in pay equity.) The gender pay gap was wider for women in women-concentrated industries such as public health care and community and cultural services, and widest of all for First Nations women.
Five years into implementation, we have moved beyond establishing baselines and identifying problems. We now have evidence about where progress is occurring, where it is stalling, and what organisations must do to shift this. Throughout this report I set out my expectations for organisations under each workplace gender equality indicator, to help focus effort where it can have the greatest impact.
My immediate regulatory priorities are the inequalities causing the greatest harm and those where the evidence suggests the greatest opportunity for improvement. This includes reducing gender pay gaps, strengthening the prevention of – and response to – workplace sexual harassment, and increasing men’s uptake of parental leave to support more equitable sharing of care.
Intersectionality is central to the Commission's approach. We recognise that some groups face compounded forms of gender inequality, and that addressing these intersecting barriers is essential to achieving fair outcomes for all Victorians.
Gender inequality is an entrenched structural and social issue. Shifting it requires sustained effort across government, workplaces and the broader community. The Commission’s work adds a strong regulatory lever to Victoria’s well-established gender equality ecosystem.
I want to thank the many advocates, change-makers and leaders who pursue this work relentlessly across their own organisations and communities. By continuing to strengthen transparency and accountability in public sector organisations, we will build safer, fairer workplaces, deliver better programs and services, and provide an example for other sectors across Victoria and the nation. Together, we’ll move closer to a gender-equal Victoria.
Dr Niki Vincent
Public Sector Gender Equality Commissioner
Message from the Minister for Women and Gender Equality
Victoria continues to lead the nation in driving systemic and structural reform for gender equality. I was proud to be the Minister who introduced the Gender Equality Act in 2020 which established an ambitious, world-first framework to tackle the root causes of gender inequality in public sector workforces and service delivery.
As the Public Sector Gender Equality Commissioner releases this report, I am proud to return to the portfolio and see growing evidence that the sustained effort of recent years is beginning to support measurable progress across parts of the Victorian public sector.
While meaningful structural change takes time, this report points to encouraging signs that the foundations laid under the Act are beginning to shift patterns that have historically proven difficult to change. This report provides an important opportunity to take stock of where progress is occurring, where challenges persist, and where further effort is needed.
The findings show a mixed but encouraging picture. There are measurable signs of progress in some areas, including women’s representation in senior leadership, board gender balance, and greater uptake of flexible work and parental leave by men in some industries.
At the same time, the report makes clear that progress is uneven. Workplace sexual harassment remains a serious concern, gender pay gaps persist, and entrenched gendered segregation continues to shape workplace experiences and outcomes.
These findings reinforce something we have long understood: lasting structural change requires sustained effort, leadership and accountability. The Gender Equality Act was designed with this in mind. By requiring organisations to measure, report and take action over time, the Act recognises that meaningful workplace and cultural change is rarely immediate or linear.
I thank the Public Sector Gender Equality Commissioner and her team for this important work. I also acknowledge the many public sector leaders, employees, union representatives, and practitioners working every day to create fairer, safer and more inclusive workplaces across Victoria.
This report provides valuable evidence to guide future action. By continuing to measure progress, learn from what is working, and address persistent challenges, Victoria’s public sector can continue to strengthen outcomes for employees and the communities they serve.
Gabrielle Williams MP
Minister for Women and Gender Equality
Executive summary
Five years since the commencement of the Gender Equality Act 2020, there is measurable progress in some areas of workplace gender equality across the Victorian public sector. There are also areas where change has stalled.
For the first time, Victoria has longitudinal, sector-wide data tracking whether public sector organisations are making measurable progress on workplace gender equality over time. This report draws on workplace gender audits submitted by around 300 duty holders in 2021, 2023 and 2025 – the most comprehensive public sector workplace gender equality dataset in Australia. The transparency and accountability this creates is a significant reform in its own right.
The clearest progress is in some of the areas that have historically been hardest to shift. Women’s representation in senior leadership increased. More women were working in traditionally men-concentrated occupations and industries. Men’s uptake of parental leave improved in several industries, and men’s use of flexible work increased more than women’s.
Some of the strongest improvements occurred in traditionally male-concentrated sectors – a sign that structural and cultural barriers, while entrenched, are not immovable. But progress is neither consistent nor fast enough. Sexual harassment remained too common and increased for some groups. Despite some good progress within many organisations and most industries, the gender pay gap has not narrowed at the sector level since 2021. And gendered segregation continued to shape who does what work, and how it is valued and paid. These findings give duty holders, policymakers, peak bodies and advocates a strong, shared evidence base for action.
For the first time, the Commission has established benchmarks for each measure representing the state that would be expected if gender equality was achieved. The assessments of progress in this report are not intended to compare Victoria with other national or international jurisdictions. Instead, they assess Victoria’s performance against those benchmarks. The Commissioner does not expect progress to occur at the same pace across every measure. Some measures relate to deeply engrained structural inequalities which will take time and sustained effort to rectify. Nevertheless, the Commissioner expects organisations to demonstrate reasonable and material progress over time.
What's changed
More women were working in senior leadership in 2025. Women’s share of senior leader roles increased across the sector between 2021 and 2025, bringing gender composition in leadership closer to the overall make-up of the public sector workforce. Four of 11 industries reached proportional representation of women in leadership, up from 2 in 2023.
Pay gaps narrowed within many organisations, including in traditionally men-concentrated industries and occupations. These included police and emergency services, water and land management, labouring roles, machinery operators and drivers, and technicians and trades. This suggests some organisations are beginning to address the structural drivers of inequality, including occupational gendered segregation and access to higher-paid roles.
More men took up flexible work and parental leave in parts of the sector. Men’s uptake of flexible work increased more than women’s, narrowing the gap. Men’s parental leave increased in 6 of 11 industries, with the largest gains in community and cultural services, water and land management, and universities.
More women were working in traditionally men-concentrated occupations and industries in 2025 – including as labourers, machinery operators and drivers, and technicians and trades workers, and across transport, finance and insurance. Transport moved from ‘highly’ to moderately’ men-concentrated, reflecting gradual but real workforce diversification.
Governing bodies remained gender balanced across the sector – the result of more than a decade of sustained effort and clear targets.
Where more attention is needed
The sector-wide gender pay gap has not narrowed since 2021, but the headline figure masks real movement beneath it. Organisations that reported in both 2021 and 2025 improved on average, and gender pay gaps narrowed across many industries. The 2025 sector-level pay gap reflects broader reporting coverage and where women and men sit across different industries and pay bands, rather than a decline in pay equity.
Every industry still had a pay gap in favour of men. Gender pay gaps were wider in the women-concentrated health care industry, and in occupations such as community and personal service, and clerical and administrative work. Indicative pay gaps were widest of all between First Nations women and non-Indigenous men.
The senior leadership pay gap is also concerning. While women’s representation in senior leadership grew between 2023 and 2025, the senior leader pay gap widened. A range of factors influenced this shift, including women executives being clustered in lower-paying roles and industries.
Sexual harassment persisted and rose between 2021 and 2025 for some groups. Across the sector, experience rates have barely moved since 2021. They sit around 6.4% for women and 3.5% for men. They were highest, and increased more, for non-binary and gender-diverse people, whose experience rate climbed from 12.7% in 2021 to 16.9% in 2025. Experience rates also remained high for First Nations women, young women and women with disability. This shows why it is so important to consider how intersecting forms of inequality can place some groups at greater risk. The high rate of sexual harassment across the sector is a work health and safety issue, and organisations have a positive duty under law to prevent, report and respond to it.
The division of care remains deeply unequal. Despite gains in several industries, the average length of parental leave taken by men fell at the sector level, while women’s rose – widening the gap. For every 5 weeks of parental leave women took in 2025, men took around one week. Supporting more men to work flexibly, and take leave, advances gender equality by helping to share unpaid care more evenly. This is why men’s uptake of parental leave is becoming a regulatory priority.
Gender-diverse employees face the biggest barriers. More than half of gender-diverse survey respondents reported barriers to career advancement – more than twice the rate of men – and the picture worsened, rather than improved, since 2021. These employees also reported lower satisfaction with career advancement than any other group and the least confidence that recruitment processes were fair.
Where better data is needed
This report rests on the strongest public sector gender equality workforce dataset in Australia. Its limits matter as much as its findings, and two stand out.
The first is on sexual harassment. Across the sector, far fewer incidents were formally recorded in workforce reporting than employees described experiencing and reporting in anonymous surveys. This tells us something important. In many workplaces, sexual harassment is happening but staying invisible to the systems meant to address it. Disclosures made to a manager are not always documented, escalated or captured in reporting. This means that senior leaders can be working from an incomplete picture, and people who come forward may not get the support or follow-up they deserve.
Closing this gap is a duty holder responsibility. Organisations have an obligation to design, maintain and actively monitor safe workplaces and reporting processes. They cannot rely on individuals to speak up or change their behaviour.
Organisations can read their anonymous survey data and their formal reporting data together. Employee experience surveys show how common sexual harassment is and how many people say they have reported it. Formal workforce reporting data shows whether response systems are working. A large gap between the two is itself a signal worth acting on. The Commissioner expects duty holders to treat this with the same rigour they apply to any other significant work health and safety risk.
The second limit relates to demographic data that is used to understand intersecting inequalities. Only a small number of duty holders report reliable demographic data beyond gender and age. Much of this report’s intersectional analysis relies on anonymous survey responses and is confined to gender pay gaps and sexual harassment. Even so, the patterns are clear. First Nations women, culturally and racially marginalised (CARM) women, women with disability, and queer and gender-diverse people experience compounded disadvantage. Better demographic data collection across the sector is needed to ensure these experiences are visible – and that organisations can use the data to take action. This is one of the clearest opportunities to strengthen the evidence base in the next reporting cycle.
What this means for duty holders
These findings reinforce that meaningful progress requires more than policy commitments alone. Continued measurement, transparency, action, and accountability will be essential to sustain momentum and deliver meaningful long-term change.
Duty holders under the Gender Equality Act must continue to use workforce data to understand where barriers persist and target action where inequalities are most pronounced. They must also continue to close gaps in their data, especially in relation to demographic data beyond gender and age. This can help reveal intersecting inequalities.
The Commissioner remains focused on the workplace inequalities that cause the greatest harm and where meaningful change is both necessary and achievable. This includes:
- workplace sexual harassment prevention and response
- closing gender pay gaps
- closing parental leave gender gaps
- meaningful use of gender impact assessments in public policies, programs and services.
The next phase of progress under the Gender Equality Act
Five years after the commencement of the Gender Equality Act, Victoria has established the most comprehensive evidence base on public sector workplace gender equality in the country. The Act has strengthened transparency and accountability across the public sector. This enables progress to be measured consistently over time and provides organisations with clearer evidence about where effort is most needed.
This report marks an important point in the Act’s implementation. The first 5 years established the foundations for change through measurement, reporting and accountability. The next phase should be characterised by organisations using this evidence to target effort where it will have the greatest impact and accelerate meaningful progress.
That progress is unlikely to occur evenly across every workplace gender equality indicator. Some inequalities can respond relatively quickly to organisational action. Others reflect longstanding workforce structures and social norms that will require sustained leadership and commitment over many years. The pace of change may also be influenced by broader workforce and economic conditions, including fiscal constraints, technological transformation and public sector reform.
These realities should not diminish ambition. Rather, they reinforce the importance of maintaining a long-term focus on evidence, accountability and continuous improvement. By doing so, Victoria’s public sector can continue to lead by example in building workplaces that are fair, safe and equitable for everyone.
Gender equality in the Victorian context
About Victoria's Commission for Gender Equality in the Public Sector
The Public Sector Gender Equality Commissioner was established under the Gender Equality Act 2020.
The Act was developed in response to recommendations of the 2016 Royal Commission into Family Violence, which identified gender inequality as a key driver of violence against women. The Act recognises that gender equality is also critical to workplace fairness, economic participation, organisational performance and the delivery of equitable policies, programs and services.
The Act applies to around 300 Victorian public sector organisations. This includes government departments, public health services, local councils, universities, TAFEs, water authorities, police and emergency services, courts and other public bodies.
It establishes a comprehensive framework for advancing gender equality through:
gender equality action plans
- biennial workplace gender audits and progress reports
- gender impact assessments on all public policies, programs and services
- regular public reporting and accountability.
Under the Act, duty holders are required to measure workplace gender equality, take action to address identified barriers, and demonstrate reasonable and material progress over time. They must also consider how gender inequality may be compounded by other forms of disadvantage and discrimination.
The Commission for Gender Equality in the Public Sector supports the Commissioner to implement the Act through education, guidance, compliance oversight, research, reporting and stakeholder engagement.
This report draws on data collected under the Act and forms part of Victoria’s broader transparency and accountability framework for workplace gender equality.
For more information about the Commission, the Act and previous reporting, see the Baseline report (2021).
How gender inequality shows up at work
Gender inequality in workplaces is rarely the result of a single policy, decision or behaviour. It emerges through a combination of workforce patterns, organisational practices, workplace cultures and broader social expectations about work, leadership and caring responsibilities.
Over recent decades, women’s participation in paid work has increased significantly. Yet systemic inequalities remain. Across Australia, women continue to be underrepresented in many senior leadership and decision-making roles, are more likely to work part time, and continue to undertake a greater share of unpaid caring responsibilities than men (ABS 2026; WGEA et al. 2026). Workplaces can both reflect and reinforce these broader patterns.
One way workplace gender inequality appears is through workforce composition. Women and men are often concentrated in different occupations, industries and levels of seniority. Women are more likely to work in caring, administrative and community service roles, while men remain overrepresented in many technical, operational and senior leadership positions. These patterns influence earnings, career progression and access to decision-making roles.
Gender inequality can also be shaped by workplace cultures and systems. Recruitment and promotion processes, access to flexible work, leadership pathways, workplace safety and the distribution of caring responsibilities can all influence employees’ experiences and opportunities at work.
For many employees, these factors interact. For example, unequal caring responsibilities can affect access to career development opportunities, leadership roles and higher earnings. Occupational gendered segregation can contribute to gender pay gaps. Experiences of sexual harassment or discrimination can affect workforce participation, wellbeing, and career progression.
Sexual harassment and gender-based discrimination at work disproportionately affect women and gender diverse people (AHRC 2025). These experiences can have significant impacts on health, wellbeing, workforce participation and career progression. They also undermine workplace culture and organisational performance (AHRC 2020; AHRC 2025).
Importantly, workplace gender inequality is not experienced in the same way by all people. Gender inequality can intersect with discrimination based on other characteristics and experiences, including Aboriginality, age, disability, ethnicity, race and sexuality. These intersecting inequalities can create unique barriers and disadvantages for some employees.
Understanding how gender inequality operates within workplaces is essential for addressing it. This is why the Gender Equality Act focuses on a range of interconnected workplace indicators. Together, these indicators help organisations identify where inequalities exist, understand how they are connected, and target action where it is likely to have the greatest impact.
Measuring workplace gender inequality
Workplace gender inequality is complex. To understand where inequalities exist and how they can be addressed, the Gender Equality Act focuses on 7 workplace gender equality indicators:
- gender composition at all levels of the workforce
- gender composition of governing bodies
- gender pay gap
- sexual harassment in the workplace
- recruitment and promotion practices
- leave and flexibility
- gendered segregation within the workplace.
Duty holders are required to collect data and report on these indicators, identify barriers to gender equality, and take action to make reasonable and material progress over time. Where possible, the Act requires duty holders to collect data about additional attributes, such as Aboriginality and disability. This helps duty holders identify forms of intersectional gender inequality in their workplaces. Read more about intersectionality, and how the Commission used this data, in Appendix 1: Data and methods.
Each indicator captures a different dimension of workplace gender equality. However, the indicators are also closely connected. Changes in one area often influence outcomes in another.
For example, gender pay gaps are often shaped by workforce composition, recruitment and promotion pathways, gendered occupational and industrial segregation, and access to flexible work. Similarly, unequal caring responsibilities can influence career progression and leadership representation. Experiences of sexual harassment can affect employee wellbeing, workforce participation and retention, particularly in industries where women and gender-diverse people are underrepresented.
Considering the indicators together provides a more complete picture of workplace gender equality than any single measure alone.
Throughout this report, the indicators are examined both individually and in combination. Together, they reveal where progress is occurring, where barriers remain, and where organisations, industries and policymakers need to focus future effort.
Measuring gender inequality outside the binary
The Commission collects data about gender across 4 gender categories:
- women
- men
- people of self-described gender
- prefer not to say.
The Commission advises duty holders to collect gender data in line with employees’ and board members’ gender identities. The categories of ‘women’ and ‘men’ are inclusive of trans women and trans men. However, some trans people may prefer to use different terms to describe themselves.
The Commission uses the category of ‘people of self-described gender’ to ensure that employees and board members who do not identify as women or men are included but are also able to use their preferred terminology. The Commission encourages duty holders to ensure employees and board members can use their preferred language to describe their gender, whether that is non-binary, genderqueer, agender, gender fluid or another term. Duty holders should record this preferred language in their internal systems to accurately reflect individuals’ gender identities and respect their preferred language.
When it comes to reporting, duty holders must use one category of ‘self-described gender’ so that both the organisation and the Commissioner can meaningfully analyse that data. This approach is designed to maximise the impact of the data, while still allowing individual people to use their preferred language to express their gender.
The People matter survey uses the terms ‘non-binary’ and ‘gender diverse’ to capture information about people who identify outside the gender binary.
This report uses all 3 terms (people of self-described gender, non-binary and gender diverse) to discuss the experiences of people who identify outside the gender binary. Read more about data limitations for this group in Appendix 1: Data and methods.
The Victorian public sector context
The Victorian public sector is one of the state’s largest employers, with public sector workers making up around 12% of Victoria’s labour force. It delivers essential services that affect the lives of Victorians every day. This includes health care, education, emergency services, local government, transport, justice and community and cultural services.
Because of its size, reach and influence, the public sector has an important role to play in advancing workplace gender equality. Progress within the public sector can improve outcomes for hundreds of thousands of employees directly, while also demonstrating approaches that may be adopted more broadly across the Victorian workforce.
The Victorian public sector is not a single workforce. It encompasses around 300 organisations operating across diverse industries, labour markets and operating environments. These organisations vary significantly in size, workforce composition, occupational profiles and service delivery responsibilities. As a result, the barriers and opportunities associated with workplace gender equality differ across industries and organisations.
Some industries have long histories of gendered occupational segregation, with women and men concentrated in different roles and levels of seniority. Other industries face workforce shortages, highly specialised labour markets, regional recruitment challenges or operational demands that shape how work is organised. These differences influence both the nature of workplace gender inequality and the strategies most likely to address it.
Workplace gender equality outcomes are shaped by a range of interconnected factors, including workforce composition, gendered occupational segregation, leadership representation, workplace culture, recruitment and promotion practices, caring responsibilities, industrial arrangements and broader labour market conditions.
Industrial agreements are an important mechanism for advancing workplace gender equality. They can accelerate progress by embedding measures such as paid parental leave, flexible work arrangements, reproductive health leave and other provisions that support equitable workforce participation and career progression. However, some industrial agreements can also constrain progress. In some workplaces, they reduce organisational flexibility, limit transparency, make it harder to collect and use workforce data, or restrict the practical options available to address structural drivers of inequality, such as workplace sexual harassment and gender pay gaps.
This report uses the term ‘public sector’ to describe all duty holders under the Gender Equality Act. However, the Public Sector Gender Equality Commissioner is not the only public sector regulator in Victoria. The Victorian Public Sector Commission (VPSC) is the key body that supports and monitors public sector performance in Victoria. The group of organisations that report to VPSC is different to the group of duty holders under the Gender Equality Act. The Act covers local government organisations, universities and library corporations, which are not under the remit of VPSC. VPSC collects data from public sector organisations with fewer than 50 employees that are not duty holders under the Gender Equality Act. These differences can lead to differences between analyses from VPSC and the Public Sector Gender Equality Commissioner.
About this report
This report provides the most comprehensive picture to date of workplace gender equality across Victoria’s public sector.
It assesses progress at the end of duty holders’ first 4-year gender equality action plans under the Gender Equality Act. It draws on audit data submitted in 2021, 2023 and 2025 by around 300 public sector organisations. The dataset includes government departments, local councils, public health services, universities, TAFEs, water authorities, police and emergency services, courts and other public bodies, representing around 500,000 employees across Victoria.
This is the largest and most comprehensive public sector workforce gender equality dataset in Australia.
The report examines progress across the Act’s 7 workplace gender equality indicators at sector, industry, and occupational levels. It identifies where measurable progress has occurred, where inequalities persist, and where further action is required. Where possible, it includes data about people of self-described gender, as well as groups facing intersectional gender inequality. See Appendix 1: Data and methods for further information about how the Commission approached and incorporated this data.
While previous Commission reports established baseline conditions and explored specific issues in greater depth, this is the first report to assess progress across all 7 workplace gender equality indicators using longitudinal data collected over the first full implementation cycle of the Act.
The findings demonstrate that progress is neither uniform nor inevitable. Some industries and indicators show encouraging signs of change, while others remain largely unchanged. Together, these results provide important insights into how workplace gender inequality is evolving across Victoria’s public sector and where future effort is likely to have the greatest impact.
The report is intended to support duty holders, policymakers, public sector leaders, unions, peak bodies, researchers and advocates to better understand workplace gender equality trends and identify opportunities for sustained and evidence-informed action. However, it is not intended to provide detailed implementation guidance.
Throughout the report, the Commissioner outlines her future expectations of duty holders against each indicator in the sections titled ‘Commissioner expectations’. In 2027, she will publish further advice for duty holders, including the findings from the funded research project ‘Setting, implementing and achieving gender equality targets’.
How we rate progress
The Commission uses 4 types of progress ratings in this report. These include:
- Matrix ratings. These are used most widely throughout this report and use a matrix to assess progress. Matrix ratings consider current performance (if the industry or sector is close to, or far from equality for an indicator based on 2025 data) and the degree of change over time (how far an industry or the sector has moved closer to, or further from, gender equality).
- Holistic ratings. These are used to assess progress on uptake of part-time work, flexible work and parental leave. Holistic ratings are used when multiple measures must be considered together to understand progress.
- Proportionality ratings. These are used to assess progress on the gender composition of senior leaders. They consider the overall gender composition of an industry or sector to understand whether progress has been made towards proportional leadership representation.
- Gender-concentration ratings. These are specific to gendered segregation. They are used to assess the gender segregation density at the sector and industry level.
More information about these ratings can be found in Appendix 1: Data and methods.
The Commission also provides data and analysis about several types of ‘gender gaps’ in this report. Beyond the more familiar gender pay gap, these include gender gaps in parental leave taking, promotions, development opportunities and uptake of part-time and flexible work. You can read more about how the Commission uses ‘gender gap’ measures to reveal structural inequalities in Appendix 1: Data and methods.
Indicator 1: Gender composition of the workforce
Why this matters
Across organisations, men continue to hold more seniority, status and pay than women. They also tend to have greater access to career development and promotion (as discussed under Indicator 5: Recruitment and promotion) – including secondments, higher duties, and training. This unequal composition contributes to the gender pay gap and means organisations may not be drawing fully on the expertise of women at senior levels. Even where an organisation has a roughly equal spread of genders overall, women are often underrepresented in leadership and overrepresented in lower-level roles. As discussed under Indicator 7: Gendered segregation, men are over-represented in leadership roles in both men-concentrated and women-concentrated industries.
Another way of looking at the gender composition of a workforce is to consider who works part time. At an individual level, part-time options can help many people to balance caring responsibilities with paid work. But where part-time work is taken up overwhelmingly by women, it can entrench unequal divisions of unpaid care and contribute to the gender pay gap. This is because part-time roles often carry fewer progression opportunities, or a narrower range of roles to progress into. Supporting more men to work part time is part of shifting this pattern. Making sure people who work part time have opportunities to progress is also important.
Organisations can use workforce composition data to see which roles and employment types skew towards one gender, and to plan how to move towards balance. You can read more about the importance of gender-balanced workforce composition in the Baseline report (2021, pp. 22-23).
How we define progress
Progress means moving towards a 45:45:10 framework (45% women, 45% men, 10% any gender) at all levels of the workforce. Importantly, this is a goal of balance, not of reducing women’s representation. In a sector that is around two-thirds women, progress is when women-concentrated organisations attract and retain more men, and men-concentrated organisations attract and retain more women – at every level, not only overall.
At the senior leadership level, the gender split should closely mirror the composition of the organisation as a whole. Women-concentrated organisations still frequently have an overrepresentation of men in leadership, so in those cases a greater share of leadership roles being held by women represents progress.
In some men-concentrated organisations, it may make sense to aim for a higher proportion of women in senior roles than in the workforce overall. For example, in police and emergency services women are less than 40% of all employees, so these duty holders could aim for a 45:45:10 senior leadership split. This could help drive broader change, because stronger representation of women in leadership can support equality more widely (Gould et al. 2018).
Progress also includes addressing part-time work imbalances. In particular, this means supporting men to take up part-time work options so they can share more of the responsibilities of care at home and in their communities.
Progress between 2021 and 2025
While the overall gender composition of the Victorian public sector workforce held steady across all 3 reporting years, beneath that stability, encouraging shifts emerged between 2023 and 2025. Women’s representation in senior leadership rose, and the gender gap in part-time work narrowed as men’s uptake increased slightly. These are early movements rather than wholesale change, but they point in the direction of greater balance.
Key data measures are presented in Tables 1.1 to 1.3. Findings are discussed in further detail after the tables.
Table 1.1: Overall gender composition progress
| Measure | 2021 | 2023 | 2025 | Percentage point change 2021-2025 | Progress |
|---|---|---|---|---|---|
| Proportion of women | 66.1% | 66.2% | 66.1% | +0.1pp | Poor (8 – Matrix) |
| Proportion of men | 33.9% | 33.4% | 33.1% | -0.8pp | Poor (8 – Matrix) |
| Proportion of people of self-described gender | 0.1% | 0.5% | 0.8% | +0.7pp | n/a |
| Proportion of women working part time | 54.8% | 54% | 54.1% | -0.7pp | Moderate (Holistic) |
| Proportion of men working part time | 26.1% | 26.7% | 27.9% | +1.8pp | Moderate (Holistic) |
| Gender gap in part-time work | -28.7% | -27.3% | -26.2% | +2.5pp | Moderate (Holistic) |
| People of self-described gender’s uptake of part-time work | 56.0% | 51.5% | 54.5% | -1.6pp | n/a |
Source: Workplace gender audit workforce data, 2021, 2023 and 2025.
Notes: To understand how to interpret the different types of progress ratings, see Data measures in Appendix 1. To read more about how the Commission calculates gender gaps, see Gender gaps in Appendix 1. Gender gaps are always calculated between men and women. A gap greater than zero is in favour of men, and a gap less than zero is in favour of women. The percentage point change column may not always reflect the exact difference between years due to rounding.
Table 1.2: Overall gender composition of senior leaders
| Measure | 2023 | 2025 | Percentage point change 2023-2025 | Progress |
|---|---|---|---|---|
| Proportion of women | 53.1% | 57.3% | +4.2pp | Improving |
| Proportion of men | 46.6% | 42.6% | -4.0pp | Improving |
| Proportion of people of self-described gender | 0.2% | 0.1% | -0.1pp | n/a |
Source: Workplace gender audit workforce data, 2023 and 2025.
Notes: To understand how to interpret the different types of progress ratings, see Data measures in Appendix 1. Senior leader data was introduced into the audit in 2023 and is not available for 2021. You can review the definition of senior leader in the audit guidance. The percentage point change column may not always reflect the exact difference between years due to rounding.
Table 1.3: Gender composition of workforce and senior leaders by industry (percentage of women)
| Industry | Total women 2023 | Senior leaders 2023 | Total women 2025 | Senior leader 2025 | Senior leader change percentage point 2023-2025 | Senior leader progress |
|---|---|---|---|---|---|---|
| Community and cultural services | 58.9% | 52.2% | 61.6% | 59.0% | +6.8pp | Proportional |
| Finance and insurance | 62.9% | 45.1% | 64.3% | 52.1% | +7.0pp | Improving |
| Local government | 62.4% | 48.5% | 61.8% | 51.3% | +2.8pp | Improving |
| Other | 48.3% | 47.1% | 48.8% | 51.0% | +3.9pp | Proportional |
| Police and emergency services | 38.0% | 26.2% | 38.2% | 27.0% | +0.9pp | Improving |
| Public health care | 77.3% | 63.8% | 77.0% | 68.1% | +4.3pp | Improving |
| TAFE and other education | 60.0% | 54.8% | 60.0% | 50.8% | -4.0pp | Worsening |
| Transport | 27.3% | 35.3% | 29.4% | 35.0% | -0.3pp | n/a1 |
| Universities | 59.6% | 53.7% | 59.6% | 55.8% | +2.1pp | Proportional |
| Victorian Public Service | 69.7% | 55.1% | 69.5% | 58.4% | +3.3pp | Improving |
| Water and land management | 43.0% | 42.6% | 42.9% | 41.4% | -1.2pp | Proportional |
Notes: To understand how to interpret the different types of progress ratings, see Data measures in Appendix 1. The percentage point change column may not always reflect the exact difference between years due to rounding.
Signs of progress
More women worked in senior leader roles in 2025
While overall workforce composition stayed stable, women’s representation in senior leadership grew. In 2025, women held 57.3% of senior leader roles, up 4.2 percentage points from 53.1% in 2023. This brought the composition of senior leaders closer to the overall composition of the public sector workforce, which was around two-thirds women.
This is a positive shift towards proportional representation, and it is consistent with organisations strengthening pathways into leadership and addressing barriers to progression. While audit data shows the movement clearly, it cannot on its own identify the specific changes inside organisations that produced it.
As Indicator 3: Gender pay gaps explains in more detail, this increase in women’s representation in senior leadership has not been accompanied by improved pay equity. In fact, the gender pay gap among senior leaders widened between 2021 and 2025. This highlights that increasing women’s representation alone is not enough. Progress on representation and remuneration must occur in tandem if gender equality is to be achieved.
It is important to note that in gender-balanced organisations, the goal for senior leadership is a 45:45:10 split. In women-concentrated organisations, the goal is for leadership to mirror the broader workforce. Because the public sector is majority-women, movement towards women holding a proportional share of leadership – rather than men remaining overrepresented at the top – is the relevant measure of progress here. This should be understood alongside the equally important goal of increasing men’s representation in women-concentrated occupations and industries across the public sector, so that the workforce as a whole becomes more gender balanced.
Four out of 11 industries achieved proportional representation of women in leadership
Most industries shifted towards proportional representation of women in leadership between 2023 and 2025. Four industries of 11 reached it in 2025, up from 2 in 2023. These were:
- community and cultural services
- other
- universities
- water and land management.
Women remained underrepresented in senior leader roles in 6 out of 11 industries. In 2025, women’s underrepresentation was most pronounced in:
- finance and insurance (64.3% total women, 52.1% women senior leaders)
- police and emergency services (38.2% total women, 27.0% women senior leaders)
- Victorian Public Service (69.5% total women, 58.4% women senior leaders)
- local government (61.8% total women, 51.3% women senior leaders).
One industry was rated ‘worsening’: in TAFE and other education, women were 60.0% of the workforce but only 50.8% of senior leaders in 2025, down 4.0 percentage points.
There is still work to do to ensure women’s share of senior leadership mirrors the workforce in most industries.
The proportion of men working part time increased, and the gender gap in part-time work narrowed
In 2021, 54.8% of women worked part time, with this number lowering slightly in 2025 to 54.1%. At the same time, the proportion of men working part time increased slightly (26.1% in 2021, and 27.9% in 2025). As a result, the gender gap in part-time work reduced by 2.5 percentage points (from 28.7% in 2021 to 26.2% in 2025). The Commission assigned a holistic progress rating of ‘moderate’ to part-time work.
Both shifts are encouraging, but they sit within a more complex picture. Higher rates of part-time work among women are partly explained by the flexible conditions the public sector offers (Dangar et al. 2023). The sector’s ability to help people balance paid work and care is a genuine strength. It supports many women’s ongoing participation in paid work and benefits their broader wellbeing.
The challenge is twofold: to protect those valued flexible conditions, while also supporting more men to take up part-time and flexible options, so that care is shared more equally and part-time work is not treated as something primarily ‘for women’. Visible role-modelling of job sharing and flexible arrangements at all levels, including senior levels, is part of how that shift happens.
Areas for attention
Women continued to outnumber men both sector-wide and in most industries
In 2025, the overall composition of the Victorian public sector workforce was 66.1% women, 33.1% men and 0.8% people of self-described gender. Since 2021, women’s share of the workforce remained relatively steady, men’s fell 0.8 points, and people of self-described gender’s rose 0.7 points.
The long-term challenge is to attract and retain more men across the sector, while protecting the flexible, supportive conditions that draw many women to public sector work in the first place. These are not competing goals. Changing the gender composition across the sector and in industries is a long-term challenge. Industry and sector composition are unlikely to change markedly in a few years. But the gains in senior leadership and part-time work show that meaningful movement is possible and is already underway.
Commissioner expectations
The Commissioner expects steady progress towards gender balance across the workforce, including efforts to attract and retain a diverse workforce. This may involve working with education and training partners and focusing on workplace culture in gender-concentrated roles and organisations.
Progress starts with understanding the organisation’s starting position. For women-concentrated organisations, hiring more women is not itself a signal of progress, because the goal is balance at all levels.
Composition is hard to shift in historically segregated industries, so organisations should focus on the strategies that make the biggest difference. Look at composition level by level to see how representation plays out across the workforce. Focus in particular on pathways to leadership, so representation is equitable at senior levels. Culture matters as much as numbers. Organisations should ask:
- are women-concentrated roles and organisations attractive to men?
- are men-concentrated roles and organisations safe and welcoming for women?
- what part-time and flexible options exist for people with caring responsibilities, and are men encouraged to use them – recognising that a policy alone will not change culture?
- do people working part time or flexibly have genuinely equal access to career development?
Attractive part-time and flexible conditions are a strength of the sector, but they should never become a barrier to progression, and they should not be seen as ‘for women’ alone. Attracting and retaining men, and supporting them to work part time, matters just as much for achieving gender equality – at work and at home.
Footnotes
1: In 2025, the proportion of senior leaders who were women in the transport sector declined by 0.3 percentage points compared to 2021. Technically, this means the proportion of senior leaders who were women moved closer to the overall proportion of employees who were women. As such, this could be rated as ‘improving’. However, in some situations, men-concentrated organisations or industries might aim for a greater proportion of women in senior roles than those that are employed throughout their organisation. This can be a strategy to improve gender equality throughout the organisation or industry and encourage more women to enter. As such, seeing a drop in women leaders in this industry may not be viewed as improvement. For these reasons, the Commission has not assigned a progress rating to the transport industry.
Indicator 2: Gender composition of governing bodies
Why this matters
Public sector boards and governing bodies are not only internal decision-makers, they also set the strategic direction of the organisations that deliver essential services to Victorians. Boards of hospital and health services, water authorities, TAFEs, councils and statutory bodies make decisions that shape the care, infrastructure, education and local services that communities rely on every day. Who sits around those tables influences whose needs are anticipated, whose experiences are understood, whose interests are considered when those decisions are made, and how resources are distributed.
Having a gender-balanced governing body means a wider range of perspectives and lived experience informs how an organisation operates and what it delivers for the public. Boards that reflect the communities they serve are better placed to identify risks and design services that work for everyone. For organisations whose decisions have a direct and significant public impact, this connects squarely to their obligations under the Act to consider gender in the programs, policies and services they provide.
A gender-balanced governing body also strengthens organisations internally. It increases the likelihood of inclusive policies and practices that work for employees of all genders. And it sends a clear signal, to staff and to the public, about an organisation’s commitment to gender equality.
In addition to enabling a more inclusive workplace culture, analysis from the Workplace Gender Equality Agency (WGEA) and the Bankwest Curtain Economics Centre shows that governing bodies with more women are associated with better performance (Cassells and Duncan 2020, p.27). When a third of board members are women, around one-fifth of firms outperform their peers (compared to only 8% of firms that have no women on the board). This finding is consistent across all of WGEA’s reporting data – strong evidence of the business case for gender-balanced governing bodies.
You can read more about the importance of gender-balanced governing bodies in the Baseline report (2021, pp. 22-23).
How we define progress
Introduced more than 10 years ago, the Victorian Government’s Women on Boards commitment requires that women make up at least 50% of all new appointments to courts and paid government boards. This commitment was renewed in 2023 as part of Victoria’s second statewide gender equality action plan, Our equal state.
The Commission supports the Victorian Government’s commitment to gender parity on boards. To assess progress under the Gender Equality Act, the Commission uses a complementary 45:45:10 framework (45% women, 45% men, 10% any gender) to define balance on governing bodies. The 45:45:10 framing gives duty holders room to:
- count people of diverse genders
- account for small numerical shifts that can appear as notable percentage swings on a small board
- account for the fact that an exact 50:50 split is impossible on a board with an odd number of members.
The Commission uses the 45:45:10 gender split framework for boards for several reasons. As explained in Indicator 1: Gender composition of the workforce, proportional measures are important when it comes to the gender composition of senior leaders. This ensures that women’s careers are not stalling at the middle levels of an organisation, and that they have fair access to higher pay, greater responsibility, and influence over the strategic direction of organisations. However, when it comes to the gender composition of boards, a 45:45:10 framework is more appropriate as a long-term goal. This is because boards are not a reflection of recruitment, promotion and progression outcomes within an organisation, even though they may reflect broader systemic or industry-level patterns of inequality. Therefore, board appointments do not reflect women reaching a ‘glass ceiling’ or dropping off via a ‘leaky pipeline’ in the same way (see Indicator 5: Recruitment and promotion for further discussion of these issues). Rather, board appointments are usually conducted separately to internal recruitment and promotion processes, and board members in the public sector are often externally appointed. Additionally, governing bodies are often made up of a small number of members. A 45:45:10 framework therefore ensures that an under-represented gender is not in an extreme minority of 1 or 2 people.
While the 45:45:10 ratio should be the goal in the public sector, a slight overrepresentation of women must be viewed in context. In women-concentrated industries, having a board that reflects the gender composition of that industry is acceptable in a wider societal context of persistent gender inequality. This should be viewed as a step on the road to the broader goal of bringing both the governing body and employee gender composition closer to 45:45:10 over time. In men-concentrated industries (as discussed in Indicator 1: Gender composition of the workforce), increasing women’s representation on boards can be part of a legitimate strategy to help drive broader organisational change (Gould et al. 2018).
Progress between 2021 and 2025
Victorian public sector boards remained gender balanced across all 3 reporting years. In most industries, women’s share of governing body membership held steady or increased since 2021, and the gender composition of board chairs was also stable. This sustained parity reflects more than a decade of clear targets and consistent effort, supported by the Victorian Government’s longstanding Women on Boards commitment.
Key data measures are presented in Tables 2.1 and 2.2. Findings are discussed in further detail after the tables.
Table 2.1: Governing body gender balance progress
| Measure | 2021 | 2023 | 2025 | Percentage point change 2021-2025 | Progress |
|---|---|---|---|---|---|
| Proportion of women members | 52.2% | 54.1% | 53.9% | +1.7pp | Excellent (18 – Matrix) |
| Proportion of men members | 47.8% | 45.9% | 46.1% | -1.7pp | Excellent (18 – Matrix) |
| Proportion of women chairs | 49.2% | 51.2% | 51.1% | +1.8pp | Excellent (18 – Matrix) |
Source: Workplace gender audit workforce data, 2021, 2023 and 2025.
Notes: To understand how to interpret the different types of progress ratings, see Data measures in Appendix 1. The percentage point change column may not always reflect the exact difference between years due to rounding.
Table 2.2: Governing body balance progress by industry (percentage of women members)
| Industry | 2021 | 2023 | 2025 | Percentage point change 2021-2025 | Progress |
|---|---|---|---|---|---|
| Community and cultural services | 56.1% | 57.7% | 55.2% | -0.9pp | Moderate (9 – Matrix) |
| Finance and insurance | 55.3% | 56.0% | 56.8% | +1.5pp | Moderate (9 – Matrix) |
| Local government | 45.6% | 45.9% | 44.2% | -1.4pp | Moderate (9 – Matrix) |
| Other | 54.8% | 60.0% | 59.0% | +4.1pp | Poor (6 – Matrix) |
| Police and emergency services | 51.0% | 56.1% | 52.8% | +1.8pp | Excellent (18 – Matrix) |
| Public health care | 55.4% | 58.4% | 58.4% | +3.0pp | Moderate (9 – Matrix) |
| TAFE and other education | 55.5% | 63.2% | 62.3% | +6.9pp | Poor (6 – Matrix) |
| Transport | 45.5% | 44.4% | 52.9% | +7.5pp | Excellent (18 – Matrix) |
| Universities | 46.7% | 48.0% | 54.5% | +7.9pp | Excellent (18 – Matrix) |
| Victorian Public Service | 50.2% | 52.4% | 56.7% | +6.5pp | Poor (6 – Matrix) |
| Water and land management | 55.4% | 58.0% | 55.3% | -0.1pp | Moderate (9 – Matrix) |
Source: Workplace gender audit workforce data, 2021, 2023 and 2025.
Notes: To understand how to interpret the different types of progress ratings, see Data measures in Appendix 1. Women chairs are not included for industry analysis, because the numbers are too small to provide valid trends. The percentage point change column may not always reflect the exact difference between years due to rounding.
Signs of progress
Governing bodies continued to be gender balanced
Across the sector in 2025, governing bodies remained balanced. Since 2021, women’s representation rose slightly (from 52.2% to 53.9%), and men’s fell slightly (from 47.8% to 46.1%). The number of women chairs also rose slightly over the same period (from 49.2% to 51.1%) and remained balanced overall.
While the recent movement is small, it adds to substantial longer-term gains. Victorian Public Sector Commission data shows women’s representation on larger public entity boards rose from 39% to 55% between 2015 and 2020 (VPSC 2022). This shift points to the value of setting measurable targets.
Three industries received a numerically ‘poor’ rating against this indicator (TAFE and other education, the Victorian Public Service, and other2), each having moved further from a 45:45:10 split – by between 4 and 7 percentage points – towards a higher share of women.
This is where the rating needs context rather than alarm. All except the ‘other’ industry are women-concentrated. As explained above, boards of organisations that are women-concentrated may increase their proportion of women without concern during the period where the wider industry is gradually shifting towards greater gender balance. The ‘poor’ label reflects movement away from a 45:45:10 split, but it does not indicate a gender equality problem on these boards at the present time. Women’s expertise and experience being valued at the governance level in industries where women predominate is a reasonable and acceptable outcome in a context of ongoing gender inequality. As noted above, the overall goal should be to bring both the employee population and the board closer to balance. (Data measures in Appendix 1 explains how the ratings are calculated and why a movement away from a 45:45:10 split is scored this way regardless of direction.
Areas for attention
Local government was the only industry where women were underrepresented on governing bodies
Every industry except local government either achieved gender balance or had a higher share of women on boards in 2025. Local government is distinct, because each council’s governing body is made up of elected councillors rather than appointed members. Board composition here reflects election outcomes, not appointment decisions. Nevertheless, councillors govern some of the services closest to communities – local roads, libraries, planning, maternal and child health, waste and recreation – yet remain less gender balanced than the governing bodies in any other part of the sector.
In local government, women’s representation in governing bodies went backwards. The share of women elected to councils fell from 45.6% in 2021 to 44.2% in 2025.3 The state target of 50% women councillors and mayors by 2025 was not achieved (Victorian Government 2023, p. 65), nor was the Commission’s complementary 45:45:10 board framework. The Commission’s 2025 audit data also identified 8 councils with only one woman councillor and 15 councils with only 2. This is a disappointing result, particularly given the significant effort many councils have put into encouraging more women to stand – including partnerships with peak bodies and campaigns such as 1000 Women Standing.
Research on the experience of Victorian councillors between 2020 and 2024 points to significant barriers to women running for, and serving on, councils. These include difficulties balancing caring responsibilities with council demands, and sustained gender-based harassment and abuse from members of the public, the media and other councillors (Carson and Ruppanner 2024).
Commissioner expectations
The Commissioner expects continued vigilance on board composition. Strong progress across most of the sector should not give way to complacency. Organisations must keep monitoring governing body gender composition and act on any inequalities they identify. Balanced governance matters not only for fairness in who holds decision-making power, but for the quality and reach of the services these boards oversee for Victorian communities.
Duty holders must continue to ensure diverse voices are represented on their governing bodies. Organisations that control their own board membership should consider gender alongside other attributes when recruiting members. Those that do not make appointments should actively advocate to the relevant Minister or appointments committee to ensure gender and other forms of diversity are considered. Taking action in this way recognises that the composition of these boards shapes decisions affecting the whole community. Duty holders should also continue to build their pipeline of women leaders through programs and initiatives suited to their industry, including preparing women for board roles where appropriate.
In local government specifically, gender-based bullying and harassment of women candidates and councillors is a serious concern. Because councillors govern services that communities depend on, barriers to women’s participation have additional consequences well beyond the council chamber. Council schedules and rules that make it hard to balance council duties with caring responsibilities can also limit women’s participation. Peak bodies have done valuable work to address these barriers. Individual councils must consider how gender inequality shows up in their own context and develop strategies to address the gendered barriers to standing for election and participating once elected.
You can read more about how local government GEAPs can support more women to stand for council.
Footnotes
2: The ‘other’ industry group is made up of 8 relatively small, diverse organisations. Changes to this industry can be difficult to interpret and may be the result of a turnover in a small number of governing body members. An overrepresentation of women on governing bodies (59% women) compared to the broader employee population (48.8% women) in this industry should be monitored. However, increasing women’s engagement with strategic governance (where they have previously been underrepresented) can be positive for gender equality. Organisations should monitor governing body membership to ensure that a slight overrepresentation of women does not shift towards a highly gender-skewed composition.
3: The Commission collects data as at 30 June in each reporting year. Data about the gender of councillors is provided by each local government organisation in Victoria. Local government organisations may collect this data in different ways. These data collection methods may also differ from the ways that peak bodies (such as the Municipal Association of Victoria, or the Victorian Local Government Association) collect this data. For these reasons, figures reported here may differ slightly from other reported figures about the gender of councillors in Victoria.
Indicator 3: Gender pay gaps
Why this matters
The gender pay gap measures the difference in earnings between gender groups (usually women and men). This is different to unequal pay based on gender, which occurs when people of different genders are paid differently for performing the same work or work of equal or comparable value. Unequal pay is unlawful in Australia. While unequal pay can contribute to gender pay gaps, gender pay gaps reveal broader inequalities. They compare the average earnings of women and men across a workforce, reflecting the combined effects of factors such as occupational segregation, workforce participation, seniority, working hours, and in some cases, unequal pay.
Gender pay gaps shape women’s financial security across their working lives and produce a compounding effect into retirement. Women earn less money than men because they often work in women-concentrated occupations and industries that pay less, work fewer hours, and spend more time on unpaid work like housework and childcare (WGEA et al. 2026). Even when women’s part time pay is converted to a full time equivalent (which is how the Commission calculates pay gaps), they still earn less than men on average. At retirement age, Australian women have around 25% less super than men (ASFA 2023). Older women are one of the groups most vulnerable to homelessness in Australia (Peterson and Tilse 2024).
When women have less income and wealth, it affects their freedom to make independent life choices, including to leave abusive relationships (Summers 2022). Wealth inequality also stops women and gender diverse people from making free choices about their health and how they want to live their lives.
As pay gaps are driven by several interacting factors, closing these gaps means looking beyond obvious differences in pay for the same job, to the deeper question of how different types of work and workers are valued and rewarded, and where people of different genders sit within an organisation.
You can read more about gender pay gaps and their drivers in our Insights report: Gender pay gap (2025).
How we define progress
Organisations should aim to move any existing gender pay gaps towards zero. The Commission’s Insights report: Gender pay gap (2025) recommended that organisations keep their mean and median total remuneration pay gaps within a target range of -5% to +5%, mirroring the federal Workplace Gender Equality Agency’s established range (WGEA 2025).
The Commissioner is now setting a higher standard: a target range of -3% to +3%. This tighter target reflects the public sector’s role as a leader in the Victorian community. By holding itself to a higher standard, the public sector can help drive wider progress across the state.
How the Commission reports on pay gaps
The Commission reports pay gaps using four main variables:
- Base salary refers to an employee’s fixed annual pay, excluding bonuses, allowances and other discretionary payments.
- Total remuneration is base salary plus all additional payments, such as allowances and bonuses. Because these are often distributed unequally between genders, total remuneration gives a fuller picture of overall pay equity.
- Mean is the average earnings of a particular group. It is sensitive to very high and very low salaries and typically produces a larger gap figure.
- Median is based on the middle earner in each group. It is less affected by extremes.
The Commission focuses primarily on the mean total remuneration pay gap, because it best reveals structural inequality in earnings. Where the median shows the ‘typical’ difference between women and men, the mean captures the effect of pay being concentrated at the top of organisations. This includes the overrepresentation of men in highly paid senior roles.
Progress between 2021 and 2025
While gender pay gaps have narrowed within many public sector organisations and in most industries, the sector-wide gap has not narrowed. Understanding this dynamic is essential to interpreting progress on this indicator.
Most organisations are closing their gender pay gaps. The proportion of organisations with a small total remuneration pay gap (+/-3%) rose between 2021 and 2025, while the proportion with moderate to large gaps fell. Some of the largest reductions occurred in traditionally men-concentrated industries and occupations. This is consistent with some organisations beginning to address structural drivers of the pay gap such as gendered occupational segregation and access to higher-paid roles.
At the whole-of-sector level, however, the gender pay gap has not narrowed since 2021. Organisations that reported in both 2021 and 2025 improved on average, and gender pay gaps narrowed across many industries. The 2025 sector-level pay gap therefore reflects broader reporting coverage, and where women and men sit across different industries and pay bands, rather than a decline in pay equity. Closing the sector-wide gap depends not only on action within organisations, but also on reducing gendered occupational and industry segregation (see Indicator 7: Gendered segregation) and the value placed on women-concentrated industries and occupations.
Key data measures are presented in Tables 3.1 to 3.4. Findings are discussed in further detail after the tables.
Table 3.1: Gender pay gap progress
| Measure | 2021 | 2023 | 2025 | Percentage point change 2021-2025 | Progress |
|---|---|---|---|---|---|
| All employees mean base salary gap | 13.8% | 14.3% | 13.3% | -0.5pp | Poor (8 – Matrix) |
| All employees mean total remuneration gap | 15.2% | 15.8% | 15.7% | +0.5pp | Poor (8 – Matrix) |
| Senior leader mean total remuneration gap | n/a | 11.2% | 12.5% | +1.3pp | Poor (8 – Matrix) |
Source: Workplace gender audit workforce data, 2021, 2023 and 2025.
Notes: Unlike the overall pay gaps, the Commission can only measure changes in senior leader pay gaps from 2023, when the senior leader category was introduced. You can review the definition of senior leader in the audit guidance. To understand how to interpret the different types of progress ratings, see Data measures in Appendix 1. To read more about how the Commission calculates gender gaps, see Appendix 1. Gender gaps are always calculated between men and women. A gap greater than zero is in favour of men, and a gap less than zero is in favour of women. The percentage point change column may not always reflect the exact difference between years due to rounding.
Table 3.2: Gender pay gap progress by industry (mean total remuneration)
| Industry | 2021 | 2023 | 2025 | Percentage point change 2021-2025 | Progress |
|---|---|---|---|---|---|
| Community and cultural services | 1.9% | 4.8% | 3.7% | +1.8pp | Moderate (9 – Matrix) |
| Finance and insurance | 14.2% | 16.6% | 15.1% | +0.9pp | Poor (8 – Matrix) |
| Local government | 5.7% | 3.5% | 2.4% | -3.3pp | Excellent (18 – Matrix) |
| Other | 11.6% | 7.7% | 6.7% | -4.9pp | Moderate (12 – Matrix) |
| Police and emergency services | 18.1% | 10.5% | 12.0% | -6.1pp | Moderate (11 – Matrix) |
| Public health care | 34.0% | 32.3% | 29.0% | -5.0pp | Moderate (10 – Matrix) |
| TAFE and other education | 8.5% | 8.4% | 8.0% | -0.5pp | Moderate (9 – Matrix) |
| Transport | 10.7% | 13.9% | 14.6% | +3.9pp | Poor (8 – Matrix) |
| Universities | 10.3% | 10.8% | 9.1% | -1.2pp | Moderate (9 – Matrix) |
| Victorian Public Service | 12.1% | 10.1% | 12.1% | 0.0pp | Poor (8 – Matrix) |
| Water and land management | 6.7% | 5.2% | 3.8% | -2.9pp | Moderate (9 – Matrix) |
Source: Workplace gender audit workforce data, 2021, 2023 and 2025.
Notes: To understand how to interpret the different types of progress ratings, see Data measures in Appendix 1. To read more about how the Commission calculates gender gaps, see Appendix 1. Gender gaps are always calculated between men and women. A gap greater than zero is in favour of men, and a gap less than zero is in favour of women. The percentage point change column may not always reflect the exact difference between years due to rounding.
Table 3.3: Gender pay gap progress by occupation (mean total remuneration)
| Occupation | 2021 | 2023 | 2025 | Percentage point change 2021-2025 | Progress |
|---|---|---|---|---|---|
| Clerical and administrative | 11.3% | 11.6% | 13.2% | +1.9pp | Poor (8 – Matrix) |
| Community and personal service | 20.0% | 21.7% | 24.1% | +4.1pp | Very Poor (4 – Matrix) |
| Labourers | 19.1% | 11.1% | 9.7% | -9.4pp | Moderate (12 – Matrix) |
| Machinery operators and drivers | 13.1% | 7.4% | 9.8% | -3.3pp | Moderate (9 – Matrix) |
| Managers | 9.7% | 10.4% | 9.3% | -0.4pp | Moderate (9 – Matrix) |
| Professionals | 12.3% | 18.6% | 16.5% | +4.2pp | Poor (8 – Matrix) |
| Sales workers | 13.9% | 17.6% | 20.3% | +6.4pp | Very Poor (4 – Matrix) |
| Technicians and trades | 9.0% | 9.5% | 8.2% | -0.8pp | Moderate (9 – Matrix) |
Source: Workplace gender audit workforce data, 2021, 2023 and 2025.
Notes: To understand how to interpret the different types of progress ratings, see Data measures in Appendix 1. To read more about how the Commission calculates gender gaps, see Appendix 1. Gender gaps are always calculated between men and women. A gap greater than zero is in favour of men, and a gap less than zero is in favour of women. The percentage point change column may not always reflect the exact difference between years due to rounding. For further information on the occupation codes used in Table 3.3, see Indicator 7: Gendered segregation.
Table 3.4: Indicative mean total remuneration pay gaps for First Nations people
| Comparator groups | Indicative mean pay gap 2021 | Indicative mean pay gap 2023 | Indicative mean pay gap 2025 | Percentage point change 2021-2025 |
|---|---|---|---|---|
| Non-Indigenous women vs non-Indigenous men | 18.7% | 18.0% | 15.0% | -3.7pp |
| First Nations women vs First Nations men | 11.3% | 15.9% | 9.3% | -2.0pp |
| First Nations men vs non-Indigenous men | 16.6% | 12.7% | 17.1% | +0.6pp |
| First Nations women vs non-Indigenous women | 9.0% | 10.5% | 11.5% | +2.6pp |
| Non-Indigenous women vs First Nations men | 2.6% | 6.0% | -2.6% | -5.1pp |
| First Nations women vs non-Indigenous men | 26.0% | 26.5% | 24.8% | -1.2pp |
Source: People matter survey data, 2021, 2023 and 2025. Workplace gender audit workforce data, 2021, 2023 and 2025.
Notes: Table 3.4 presents indicative pay gaps. These figures are drawn from People Matter survey data rather than payroll records, and some comparator groups are based on small numbers of respondents. They should be read as indicative of broad patterns rather than precise measures, and they are not directly comparable with the payroll-based industry and occupational figures in Tables 3.1, 3.2 and 3.3. The Commission has not assigned progress ratings to these measures, given the data limitations. The percentage point change column may not always reflect the exact difference between years due to rounding.
Table 3.5: Indicative mean total remuneration pay gaps for people with disability
| Comparator groups | Indicative mean pay gap 2021 | Indicative mean pay gap 2023 | Indicative mean pay gap 2025 | Percentage point change 2021-2025 |
|---|---|---|---|---|
| Women without disability vs men without disability | 18.9% | 18.4% | 15.2% | -3.6pp |
| Women with disability vs men with disability | 11.5% | 10.5% | 8.9% | -2.6pp |
| Men with disability vs men without disability | 13.0% | 12.2% | 10.4% | -2.6pp |
| Women with disability vs women without disability | 5.1% | 3.7% | 3.6% | -1.5pp |
| Women without disability vs men with disability | 6.8% | 7.1% | 5.4% | -1.3pp |
| Women with disability vs men without disability | 23.0% | 21.4% | 18.3% | -4.7pp |
Source: People matter survey data, 2021, 2023 and 2025. Workplace gender audit workforce data, 2021, 2023 and 2025.
Notes: Table 3.5 presents indicative pay gaps. These figures are drawn from People Matter survey data rather than payroll records, and some comparator groups are based on small numbers of respondents. They should be read as indicative of broad patterns rather than precise measures, and they are not directly comparable with the payroll-based industry and occupational figures in Tables 3.1, 3.2 and 3.3. The Commission has not assigned progress ratings to these measures, given the data limitations. The percentage point change column may not always reflect the exact difference between years due to rounding.
Table 3.6: Indicative mean total remuneration pay gaps for culturally and racially marginalised (CARM) people
| Comparator groups | Indicative mean pay gap 2021 | Indicative mean pay gap 2023 | Indicative mean pay gap 2025 | Percentage point change 2021-2025 |
|---|---|---|---|---|
| Non-CARM women vs non-CARM men | 19.2% | 18.1% | 15.3% | -3.9pp |
| CARM women vs CARM men | 15.1% | 17.8% | 13.5% | -1.6pp |
| CARM men vs non-CARM men | 6.9% | 4.6% | 7.3% | +0.3pp |
| CARM women vs non-CARM women | 2.1% | 4.3% | 5.3% | +3.1pp |
| Non-CARM women vs CARM men | 13.2% | 14.1% | 8.7% | -4.5pp |
| CARM women vs non-CARM men | 21.0% | 21.6% | 19.8% | -1.2pp |
Source: People matter survey data, 2021, 2023 and 2025. Workplace gender audit workforce data, 2021, 2023 and 2025.
Notes: Table 3.6 presents indicative pay gaps. These figures are drawn from People Matter survey data rather than payroll records, and some comparator groups are based on small numbers of respondents. They should be read as indicative of broad patterns rather than precise measures, and they are not directly comparable with the payroll-based industry and occupational figures in Tables 3.1, 3.2 and 3.3. The Commission has not assigned progress ratings to these measures, given the data limitations. The percentage point change column may not always reflect the exact difference between years due to rounding.
Table 3.7: Indicative mean total remuneration pay gaps by sexual orientation
| Comparator groups | Indicative mean pay gap 2021 | Indicative mean pay gap 2023 | Indicative mean pay gap 2025 | Percentage point change 2021-2025 |
|---|---|---|---|---|
| Straight women vs straight men | 19.1% | 18.2% | 14.8% | -4.3pp |
| Lesbian, gay, bisexual, pansexual or asexual women vs gay, bisexual, pansexual or asexual men | 13.3% | 17.5% | 15.9 | +2.6pp |
| Gay, bisexual, pansexual or asexual men vs straight men | 4.0% | 5.3% | 3.3% | -0.7pp |
| Lesbian, gay, bisexual, pansexual or asexual women vs straight women | -2.8% | 4.5% | 4.6% | +7.4pp |
| Straight women vs gay, bisexual, pansexual or asexual men | 15.7% | 13.6% | 11.9% | -3.8pp |
| Lesbian, gay, bisexual, pansexual or asexual women vs straight men | 16.8% | 21.9% | 18.7% | +1.9pp |
Source: People matter survey data, 2021, 2023 and 2025. Workplace gender audit workforce data, 2021, 2023 and 2025.
Notes: Table 3.7 presents indicative pay gaps. These figures are drawn from People Matter survey data rather than payroll records, and some comparator groups are based on small numbers of respondents. They should be read as indicative of broad patterns rather than precise measures, and they are not directly comparable with the payroll-based industry and occupational figures in Tables 3.1, 3.2 and 3.3. The Commission has not assigned progress ratings to these measures, given the data limitations. The percentage point change column may not always reflect the exact difference between years due to rounding.
Table 3.8: Indicative mean total remuneration pay gaps by gender identity
| Comparator groups | Indicative mean pay gap 2021 | Indicative mean pay gap 2023 | Indicative mean pay gap 2025 | Percentage point change 2021-2025 |
|---|---|---|---|---|
| Cisgender women vs cisgender men | 18.6% | 18.1% | 14.9% | -3.7pp |
| Trans, non-binary or gender diverse people vs cisgender women | 0.1% | 5.6% | 10.3% | +10.3pp |
| Trans, non-binary or gender diverse people vs cisgender men | 18.6% | 22.6% | 23.7% | +5.1pp |
Source: People matter survey data, 2021, 2023 and 2025. Workplace gender audit workforce data, 2021, 2023 and 2025.
Notes: Table 3.8 presents indicative pay gaps. These figures are drawn from People Matter survey data rather than payroll records, and some comparator groups are based on small numbers of respondents. They should be read as indicative of broad patterns rather than precise measures, and they are not directly comparable with the payroll-based industry and occupational figures in Tables 3.1, 3.2 and 3.3. The Commission has not assigned progress ratings to these measures, given the data limitations. The percentage point change column may not always reflect the exact difference between years due to rounding.
Estimating indicative pay gaps for groups facing intersecting inequalities
The Commission relies on a combination of anonymous People matter survey data and workforce data to analyse pay inequality for groups facing intersecting inequalities. This is because workforce demographic data reporting rates are very low (aside from gender and age). Respondents to the People matter survey select a full-time equivalent annual salary range within $10,000 brackets. To narrow down these ranges and estimate indicative pay gaps using more accurate pay figures, the Commission combined data from diverse People matter survey respondents with more concrete workforce data on pay.
It did this by assigning base salaries in the workforce data – that is, actual salaries recorded in payroll systems – to the People matter survey base salary ranges selected by diverse respondents. First, mean base salaries within each People matter survey salary range were calculated for each duty holder and each industry group. This means they were taken from the workforce data for all employees within an organisation, regardless of gender or other attributes. The mean base salary for each organisation in each $10,000 bracket was then assigned to each respondent in the survey. Mean base salaries assigned to individual respondents in the survey were then used to estimate an overall, indicative mean for each specific group that was reported on (for example, ‘First Nations women’ or ‘men with disability’). The estimated mean for a particular group was then used to determine an indicative pay gap between 2 specific groups.
Because these indicative pay gaps are not calculated using concrete workforce data on pay, they are not as reliable as other pay gaps represented in this report. Estimating pay gaps using this approach is a way of identifying the approximate scale of pay inequality between groups. But the indicative pay gaps in this report should not be considered an accurate representation of the precise difference in pay between those groups. They are also not comparable to other pay gaps that use payroll records. What they can do, is suggest where pay inequality may be greater for those facing intersecting inequalities. This helps organisations and industries target their efforts to address intersectional gender inequality.
Gender is centralised in this report’s analysis of indicative pay gaps for groups facing intersecting inequalities. The Commission was established with a clear remit in relation to intersectional gender inequality. As such, the Commission’s primary focus is the role of gender in shaping public sector workforces, workplaces and careers. By producing indicative pay gaps between various groups of public sector employees of different genders – who do or do not also share an additional demographic attribute – this report helps demonstrate how gender inequality is compounded by other forms of discrimination.
The intent of this analysis is not to rank different groups facing intersecting inequality against one another with regards to pay. Rather, it is to show how both gender and other forms of discrimination combine to different degrees to increase pay inequality in the Victorian public sector. In reality, individuals’ lived experiences of discrimination can’t be siloed in this way. The experience of gendered racism can’t be neatly isolated into the separate parts of gender inequality and racism. However, looking at the data across a range of demographic variables in this way helps to reveal the contributing factors and hopefully, to help begin to identify root causes that can be addressed. Providing indicative pay gaps across a range of variables also shows where the disparities are starkest. By comparing those who experience a form of compounded gender inequality (such as women with disability) with those who face neither gender inequality, nor the additional inequality examined (such as men without disability), the extent of the pay penalty is made visible. Isolating these groups makes it possible to see how inequalities compound to multiply the lost earnings for those facing intersecting inequality – which have potentially profound financial effects over a lifetime.
Producing pay gaps for groups facing intersecting inequalities is an emerging area of data analysis that is not always approached consistently. Jobs and Skills Australia, for example, use ‘all men’ as a constant comparator to consider how a group facing compounded discrimination is faring (JSA 2025). This has the advantage of demonstrating the extent of the gap for each group compared to a stable figure (the average pay of all men in the sample). However, the limitation of this approach is that it does not demonstrate the full extent of the pay penalty generated by the intersection of gender and another attribute. This is because the sample ‘all men’ includes, for example, culturally and racially marginalised (CARM) men. As such, when the average pay of all men is compared to that of CARM women, it is likely to generate a smaller gap than if you isolate men who do not experience discrimination based on their culture and/or race as the comparator. Both methods are valid and have different advantages.
See Intersectionality at work (2023) for further discussion around language the Commission uses to describe groups that experience compounded discrimination.
Signs of progress
Pay gaps narrowed in key men-concentrated industries and occupations
Some of the strongest reductions in gender pay gaps occurred in traditionally men-concentrated industries and occupations, including police and emergency services (6.1 percentage point reduction), water and land management (2.9 percentage point reduction), labouring roles (9.4 percentage point reduction), machinery operators and drivers (3.3 percentage point reduction) and technicians and trade workers (0.8 percentage point reduction). This pattern is consistent with some organisations beginning to address the structural drivers of inequality, including gendered occupational segregation, progression pathways and access to higher-paid roles.
Many organisations and one industry had a pay gap in the +/-3% range in 2025
Many organisations reduced their pay gaps at the workplace level. The proportion of organisations within the target total remuneration pay gap range (+/-3%) rose by 4.3 percentage points since 2021, while the proportion of organisations with moderate to large gaps declined. This organisation-level progress is the clearest sign that the work duty holders are doing is having a positive effect. As set out above, it is also why a lack of movement in the sector-wide pay gap does not tell the full story.
Local government was the only industry within the target pay gap range of +/-3%. Local government reduced their pay gap from 5.7% in 2021 to 2.4% in 2025.
Police and emergency services and public health care made significant reductions to their pay gaps
The police and emergency services industry reduced its pay gap by the largest margin, from 18.1% in 2021 to 12.0% in 2025.
Public health care (which has the highest pay gap of any industry) reduced its gap by 5.0 percentage points, from 34.0% to 29.0%. The gender pay gap in health care remains very high, but a reduction of this size in a very large, highly women-concentrated industry shows that meaningful change is achievable even where gaps are widest.
Indicative pay gaps narrowed for some groups facing intersecting inequalities
Subject to the data caveats noted above, there were modest improvements for some groups experiencing compounded inequality. The indicative pay gaps for First Nations women and CARM women each narrowed by 1.2 percentage points (compared to non-Indigenous men and non-CARM men respectively). The pay gap for women with disability (compared to men without disability) narrowed by 4.7 percentage points – the most of any group experiencing compounded gender inequality (when compared to men without the attribute).
However, pay gaps widened for other groups. The indicative pay gap for lesbian, gay, bisexual, pansexual or asexual women (compared to straight men) widened slightly (up 1.9 percentage points), and for trans, non-binary and gender-diverse people (compared to cisgender men) it widened more (up 5.1 percentage points). While these figures use smaller samples and should be read with care, the direction of change is a concern. It reinforces the importance of an intersectional approach to pay equity and improving data collection to enable more robust intersectional analysis.
Calculated using the same method, the indicative pay gap between all women and all men was 14.8% in 2025.
Areas for attention
The sector-wide gender pay gap remained stubborn
In 2025, the mean base salary pay gap was 13.3%, down 0.5 percentage points since 2021. The mean total remuneration pay gap was 15.7%, up 0.5 percentage points. These sector-wide figures have barely moved despite pay gaps narrowing within many workplaces and industries. Shifting them requires sustained attention to gendered segregation and to how work in traditionally women-concentrated areas is valued. Organisations must also consider how discretionary and non-base remuneration is distributed, how pay is set, and the conditions that shape careers over time. These conditions include shared care, safe workplaces, and the compounding effects of intersecting discrimination.
More women entered senior leadership, but the senior leader pay gap increased
The mean total remuneration gender pay gap among senior leaders widened between 2023 and 2025, from 11.2% to 12.5%. At the same time, women’s representation in senior leadership rose from 53.1% to 57.3%. This means that more women reached senior leadership, but their growing presence did not translate to comparable pay with men.
The Commission’s audit data identifies 3 potential drivers for this discrepancy. Firstly, trends within the Victorian Public Service industry influenced the changes. The VPS employs around 43% of the of the sector’s senior leaders, so changes within the VPS industry can shape trends at the sector level. Between 2023 and 2025, the VPS senior leader pay gap rose from 5.3% to 8.5%. While other industries also increased or decreased their senior leader pay gaps, the size of the VPS senior leader cohort means changes to its pay gap largely drove the sector-wide increase.
Secondly, women’s increased share of senior leader roles mainly grew in more entry-level and lower-paid roles. This suggests that as more women moved into senior leadership, they entered at the lower-paid end of the executive range. More women clustered in lower-paying roles widened the leadership pay gap, despite women’s representation improving.
Importantly, the Commission’s data shows that there is also a widening gender pay gap towards the top of the leadership structure. Among the most senior roles examined, women’s representation rose from around 48% to 53% between 2023 and 2025, yet the pay gap widened from 6.9% to 8.8%. The drivers of this require investigation.
While not visible within the Commission’s data, research also shows that salary negotiation affects senior leader pay. Men continue to benefit more than women in negotiation (WGEA 2018). This was once attributed to women negotiating less, but more recent research finds women negotiate just as often as men. However, their requests are more likely to be refused (Artz et al. 2016). This creates a double bind: women who negotiate assertively are more likely to be judged as violating gender norms and viewed unfavourably (Rudman and Phelan 2008), while not negotiating entrenches the gender pay gap.
Organisations should analyse their gender pay gaps at every workforce level to understand what is driving them.
Traditionally women-concentrated occupations had the highest pay gaps
Analysis of the gender pay gap at an occupational level reveals persistent, and sometimes unexpected, inequalities. The highest occupational pay gaps in 2025 were in:
- community and personal service workers, at 24.1% (up 4.1 percentage points since 2021)
- sales workers, at 20.3% (up 6.4 percentage points since 2021)
- professionals, at 16.5% (up 4.2 percentage points since 2021)
- clerical and administrative workers, at 13.2% (up 1.9 percentage points since 2021).
The fact that some of the largest gaps sit in traditionally women-concentrated occupations, such as community and personal services, and clerical and administrative work, shows how inequality can persist even where women predominate.
Research reveals various reasons for gendered pay disparities among professionals. As with many pay gaps, it is driven by many small, incremental disadvantages such as the gendered distribution of workplace tasks and the lasting effects of returning from parental leave (Burns et al. 2015). Yet, there is also a greater scope for bargaining and managerial discretion that affects pay for this occupational group, especially in health (Vecchio et al. 2013). It is also worth noting the breadth of the ‘professional’ category in the ANZSCO classification, which can produce data that is difficult to interpret (Wibrow 2022). This is particularly true for women-concentrated occupations (Lind and Colquhoun 2021; Risse 2025).4 Finer disaggregation will be needed to understand pay inequality among professional workers more fully.
Commissioner expectations
The Commissioner expects strong, targeted action on gender pay gaps. Pay gaps are the cumulative result of inequalities across recruitment, promotion, workforce composition, gendered occupational segregation, leave and flexibility, sexual harassment and discrimination. In each duty holder organisation they must be investigated, addressed, and eventually eliminated.
Some drivers of the gender pay gap are structural and sit across whole industries. Others can be addressed directly within organisations. To act on these, duty holders should:
- analyse their own data to understand what is driving any gap
- look at pay differences within occupations and by level: are gaps more pronounced in particular areas? Is one gender overrepresented at certain levels or in certain roles?
- review starting salaries by gender, and examine whether bias is affecting recruitment, promotion and pay
- investigate whether discriminatory practices or unconscious bias exist in organisational culture and norms.
Because the senior leader gender pay gap has widened, and because gaps in higher pay bands translate into large dollar amounts, it is especially important to examine how pay is distributed in the top bands. Duty holders should apply an intersectional lens wherever the data allows, to see where and why inequalities show up.
Gendered occupational and industrial segregation are significant and hard-to-shift drivers. Organisations have little control over the fact that work traditionally associated with men is valued more highly. Addressing this at the structural level includes improving pay in publicly funded, women-concentrated workforces. At the organisational level, duty holders should focus on what they can control. For example, building pathways into roles and areas where particular genders are underrepresented.
Rural and regional snapshot
Rural and regional workplaces face distinct challenges in embedding gender equality. Families can struggle to access adequate flexibility and childcare, which often limits women’s workforce participation. Women in rural and regional areas can also be reluctant to move into senior roles as workloads can be considerably higher than in metropolitan areas and flexibility may be limited (Tischler et al. 2023).
In the Victorian public sector, overall pay gaps were lower in rural areas than in metropolitan Melbourne, but senior leader pay gaps were higher.
Regional pay gaps were slightly higher than metropolitan ones. The mean total remuneration gap in regional areas was 17.0%, compared to 15.6% in metropolitan areas.
Women’s access to career development was significantly lower than men’s in rural areas. In 2025, every location had a career-development gap in favour of men. However, the gap was most pronounced in rural areas (13.1%), compared with metropolitan areas (8.4%) and regional centres (7.9%). See Indicator 5: Recruitment and promotion for more detail on career development.
Alongside the structural factors above, this lack of advancement opportunity may help explain the more pronounced senior leader pay gap in rural areas. It could potentially be constraining both women’s pathways into leadership and their pay once there.
Table 3.9: Mean total remuneration pay gaps and senior leaders pay gaps by location
| Location | Measure | 2023 | 2025 | Percentage point change 2023-2025 |
|---|---|---|---|---|
| Metropolitan | All employees mean total remuneration gap | 16.1% | 15.6% | -0.5pp |
| Regional | All employees mean total remuneration gap | 16.6% | 17.0% | +0.4pp |
| Rural | All employees mean total remuneration gap | 10.7% | 10.9% | +0.2pp |
| Metropolitan | Senior leader mean total remuneration gap | 11.5% | 11.9% | +0.4pp |
| Regional | Senior leader mean total remuneration gap | 7.1% | 12.4% | +5.3pp |
| Rural | Senior leader mean total remuneration gap | 15.7% | 14.7% | -1.0pp |
Source: Workplace gender audit workforce data, 2023 and 2025.
Notes: Location classifications are based on employee workplace postcodes and use the Modified Monash Model (MMM). MMM categories were aggregated into three groups: Metropolitan areas (MMM1), Regional centres and large rural towns (MMM2–MMM3, referred to here as ‘regional’), and Small-medium rural towns and remote areas (MMM4–MMM7, referred to here as ‘rural’). Location data was not collected in the 2021 workplace gender audit.
Footnotes
4: As explained further under Indicator 7: Gendered segregation, the Australian Bureau of Statistics’ change from ANZSCO to OSCA is designed to alleviate some of these concerns (ABS 2024).
Spotlight on gender pay gap
Where pay gaps hit hardest
The gender pay gap in Victoria’s public sector is 15.7%.
That means that women, on average, are missing out on $23,052 per year, compared to men.
This pay gap sets women in the public sector back financially over a lifetime.
Women in certain industries, job roles, locations and age brackets are set back further than others by wider gender pay gaps. So, who is hurt most by the current gender pay gap – and how much are they losing?
Occupations and industries
Mean total remuneration pay gaps in 2025:
- Public health care: 29.0% ($53,267)
- Community and personal service workers: 24.1% ($29.892)
- Sales workers: 20.3% ($25,371)
- Professionals: 16.5% ($27,086)
Women in regional areas
Mean total remuneration pay gaps in 2025: 17.0% ($23,644)
Women aged 45 and above
The gender pay gap is wider for women aged 45 and above.
Women aged 55-64 experience the widest pay gap at 22%. This means on average they miss out on $24,769 each year compared to men in the same age bracket.
Figure 1: Gender pay gap by age (2025)
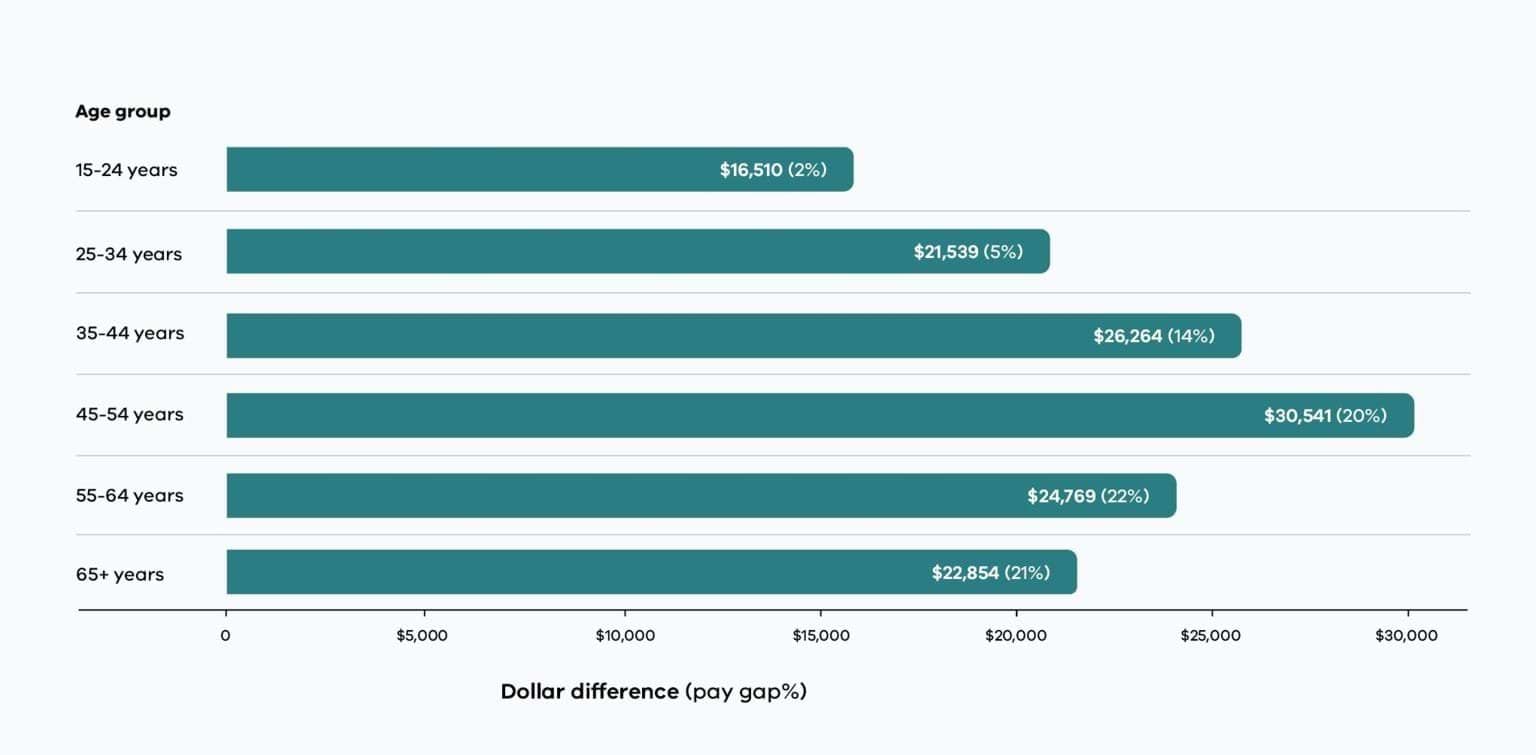
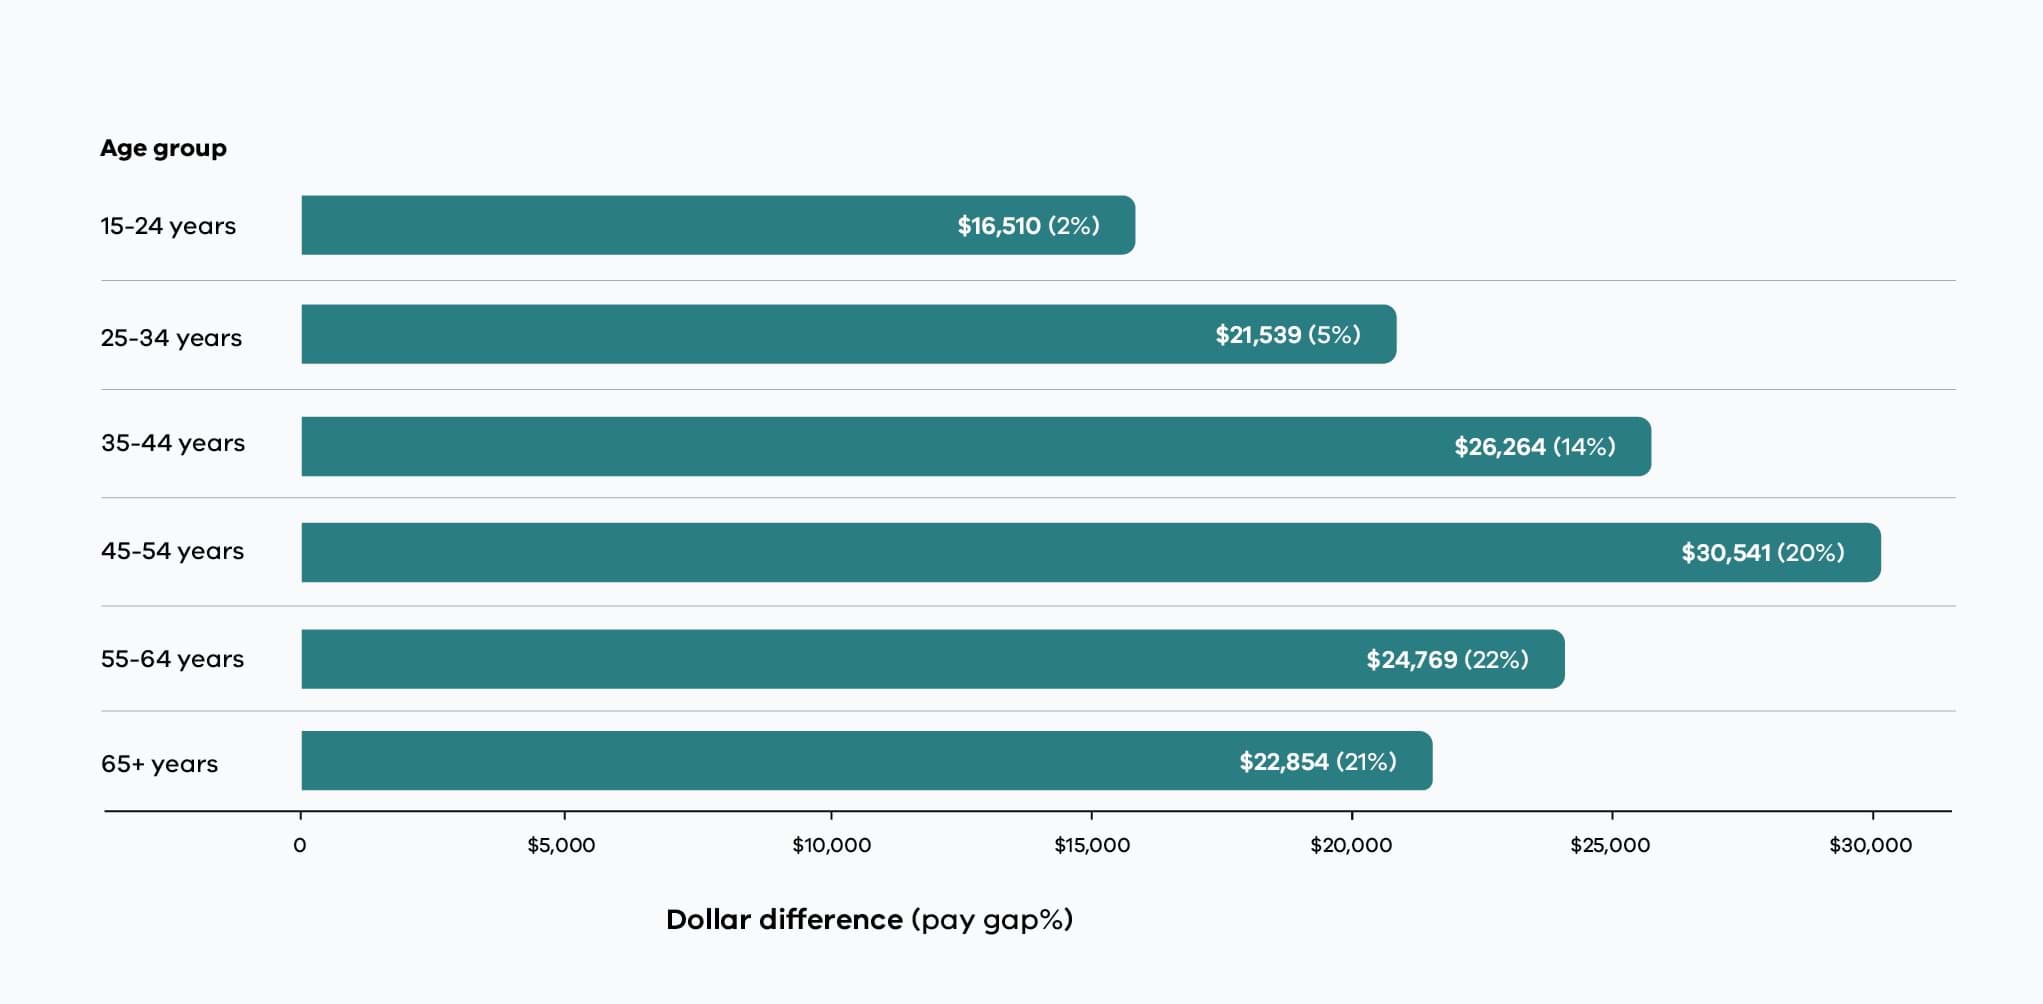
Gendered segregation drives the pay gap
At the sector level, pay gaps persist because more men hold higher paid positions. Women hold more roles with mid-range salaries.
Within industries, the distribution of women and men leads to narrower, or wider, pay gaps.
Note: Figures 2-7 display the central 98% of remuneration values to improve readability (1st to 99th percentile). Extreme values are excluded from the visual range but retained in the mean total remuneration calculations.
Figure 2: Gender pay distribution – all public sector employees (2025)
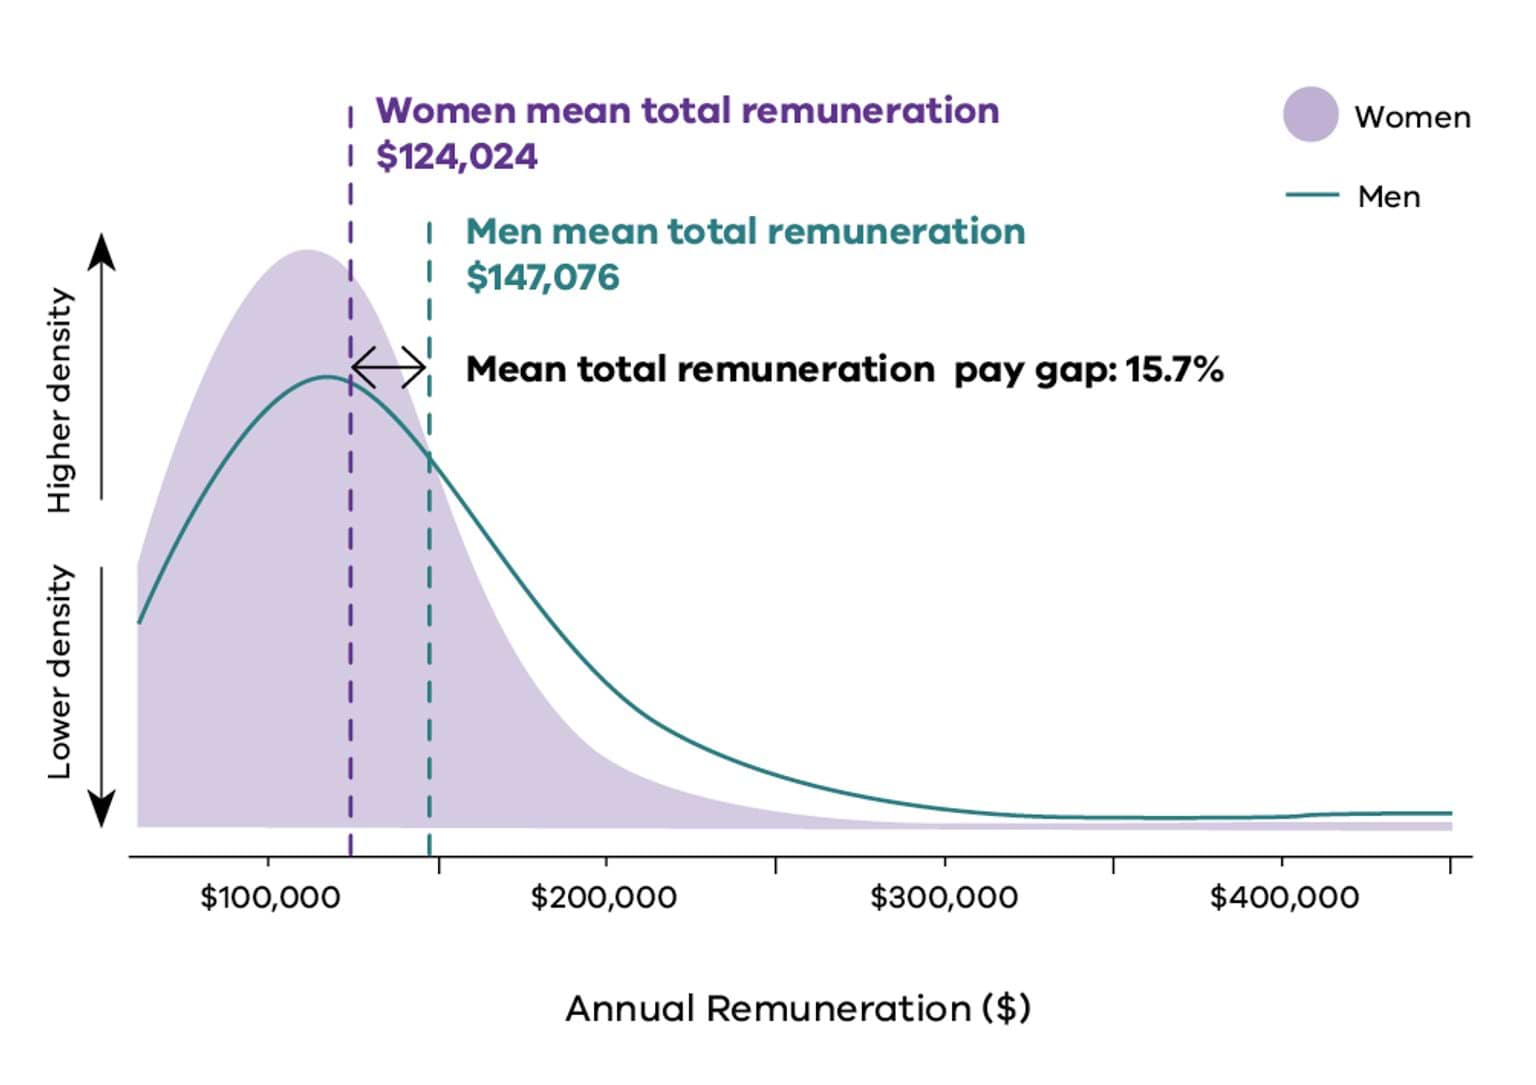
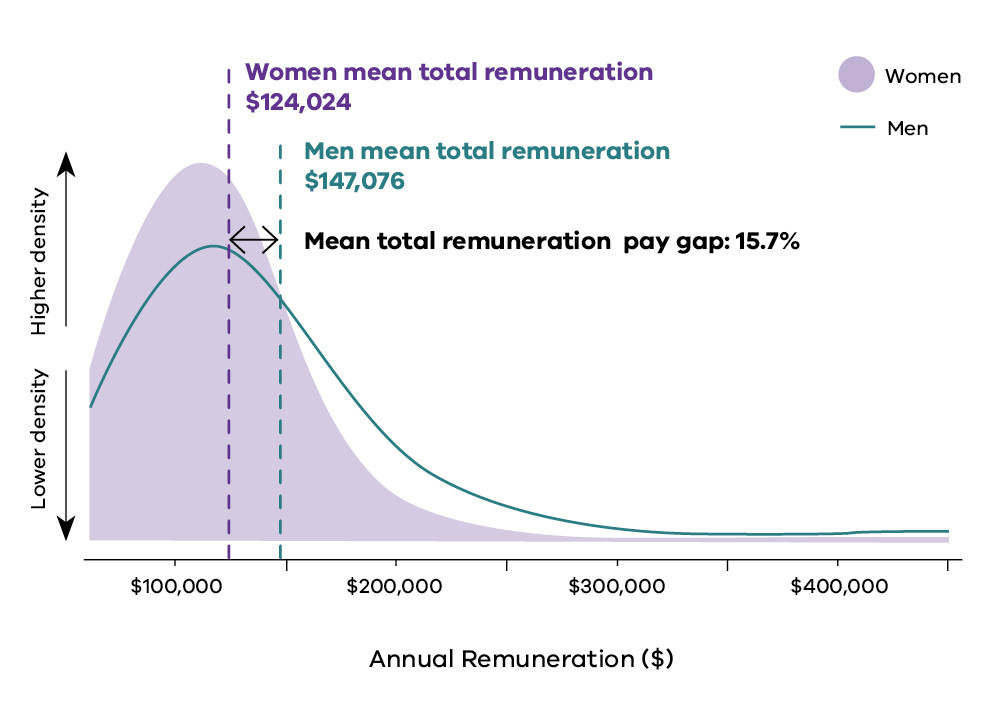
Local government leads the way
Local government has an even gender distribution across salary bands. The gender pay gap in local government is the lowest of all industries in the public sector.
Figure 3: Gender pay distribution in local government (2025)
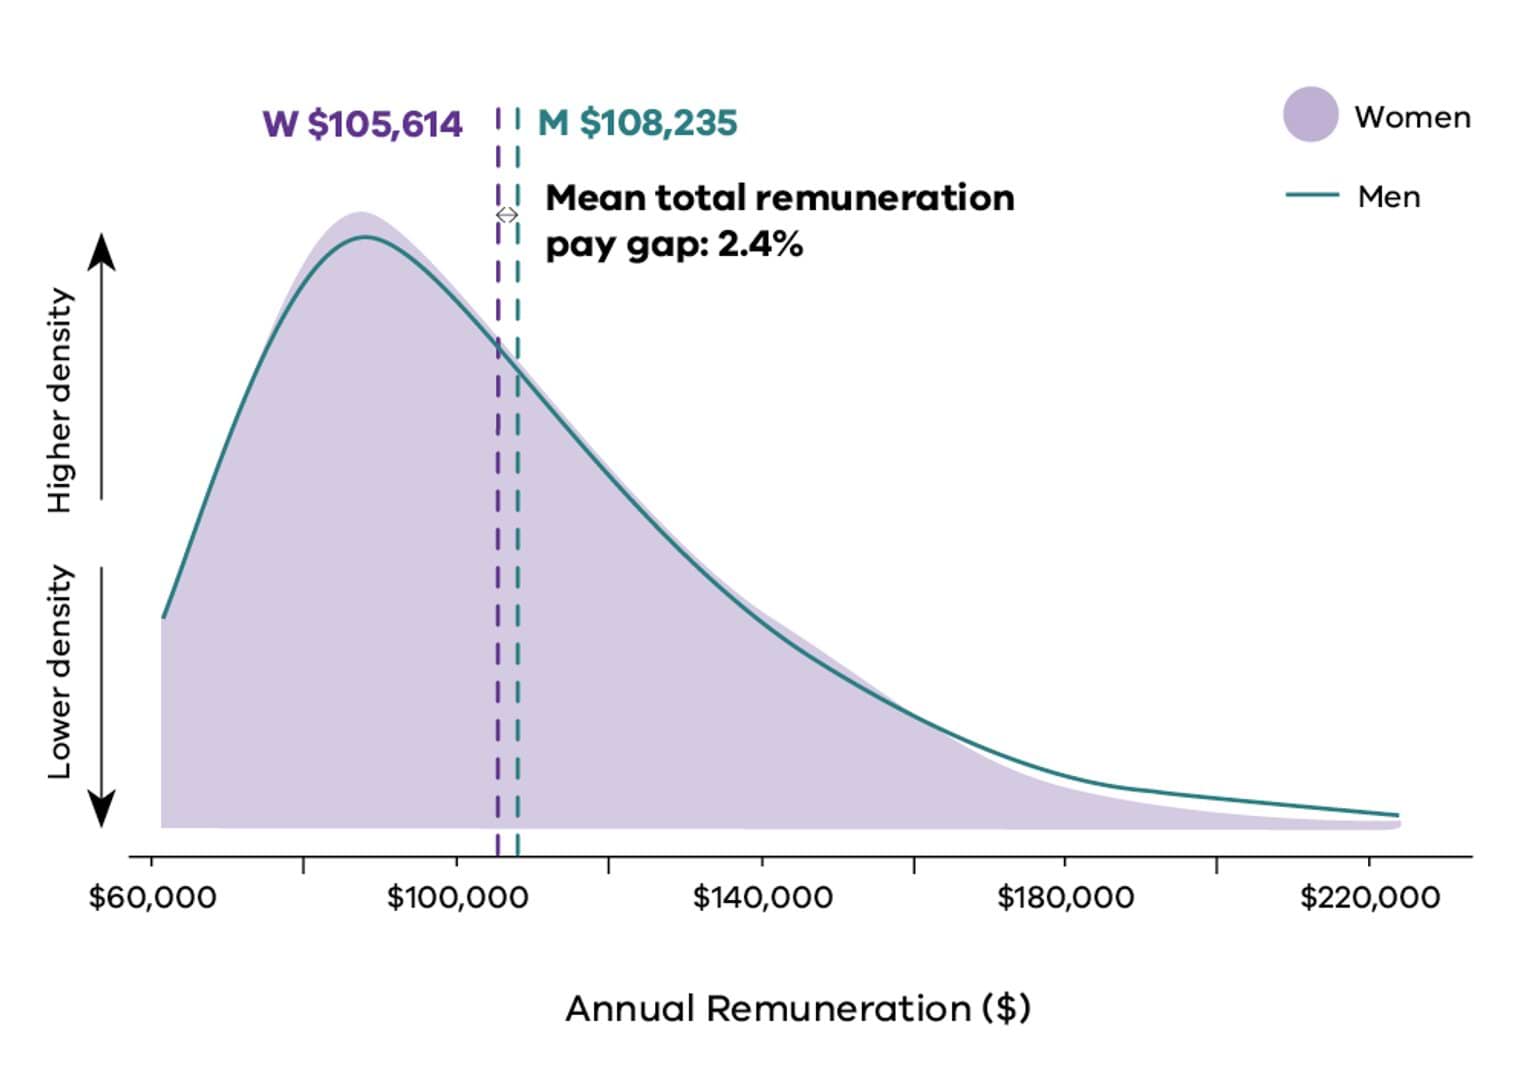
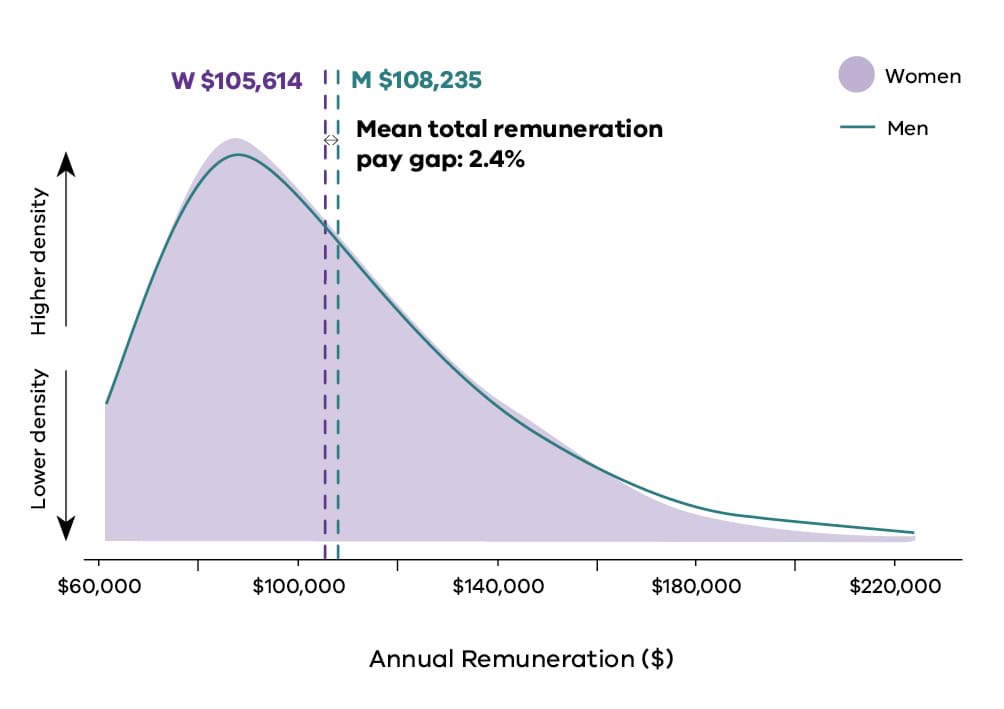
More men in high-paid roles drives the gap
In public health care in 2025, women held more jobs with salaries around $100,000 while men held more high-income roles with salaries above $200,000. This disparity means public health care was the industry with the highest gender pay gap in the public sector, at 29.0%.
Figure 4: Gender pay distribution in public health care (2025)
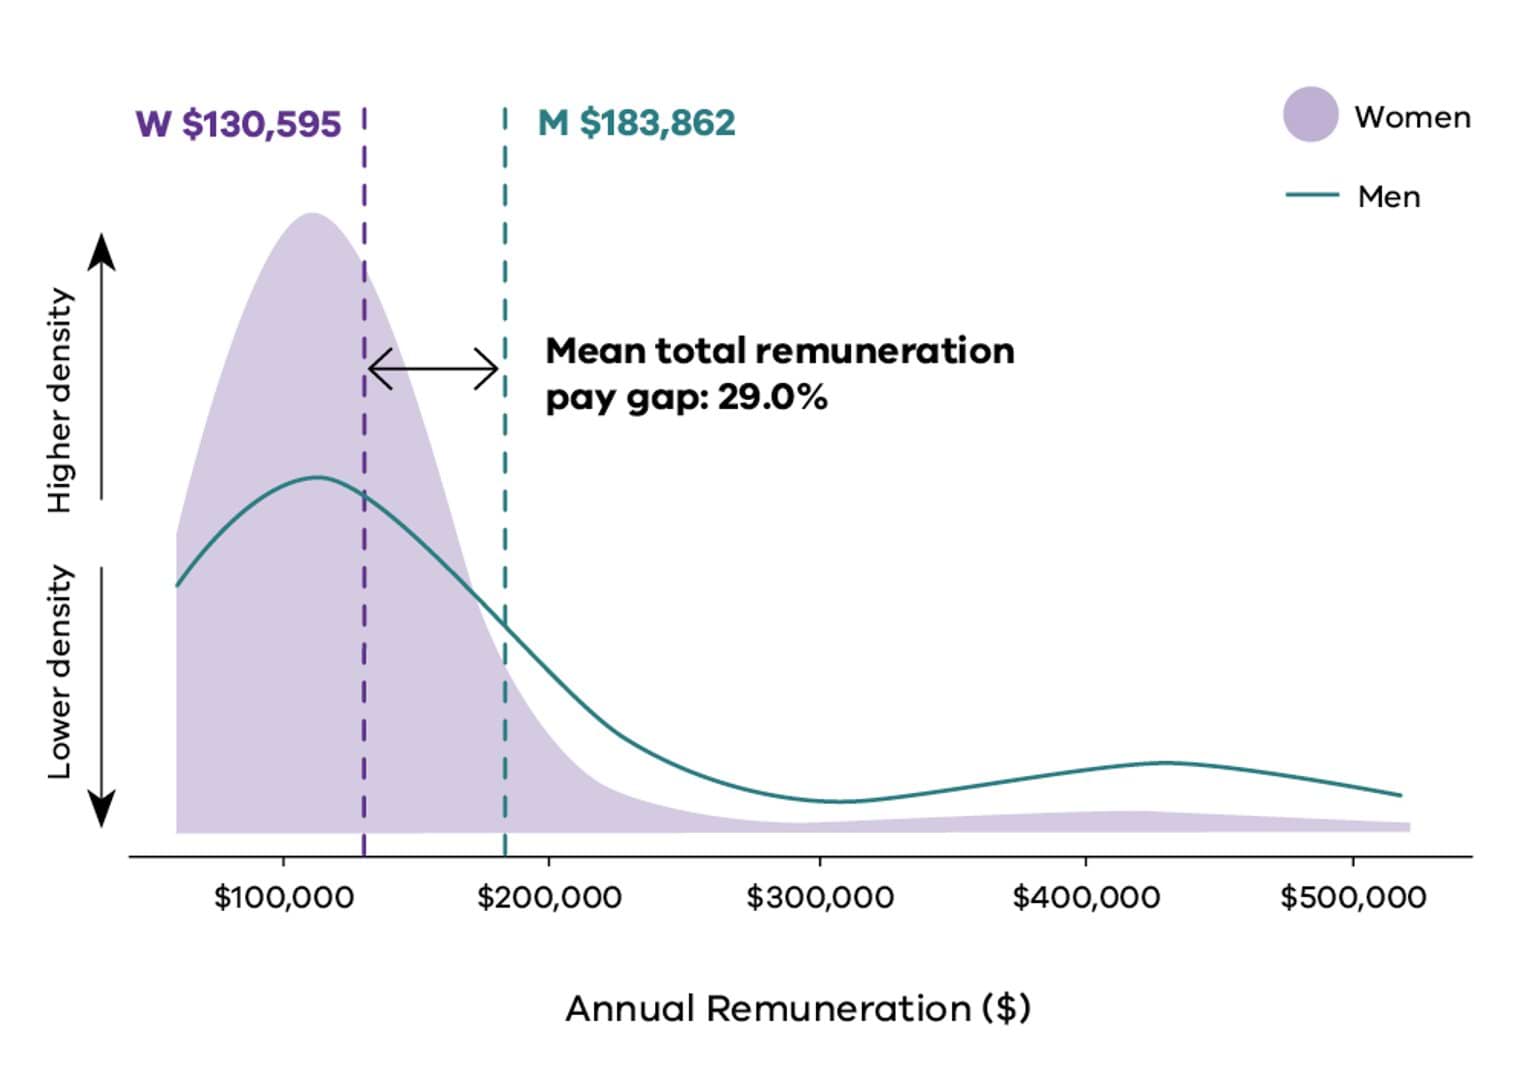
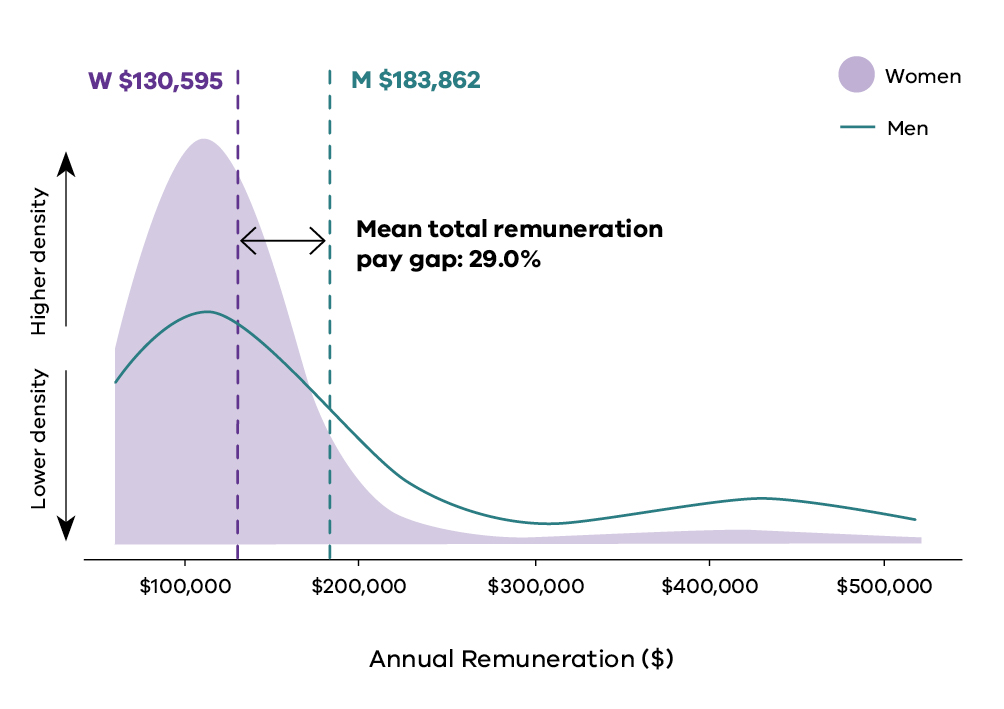
In transport, finance and insurance, the trend is similar - with more men in higher paid roles driving the gender pay gap.
Figure 5: Gender pay distribution in transport (2025)
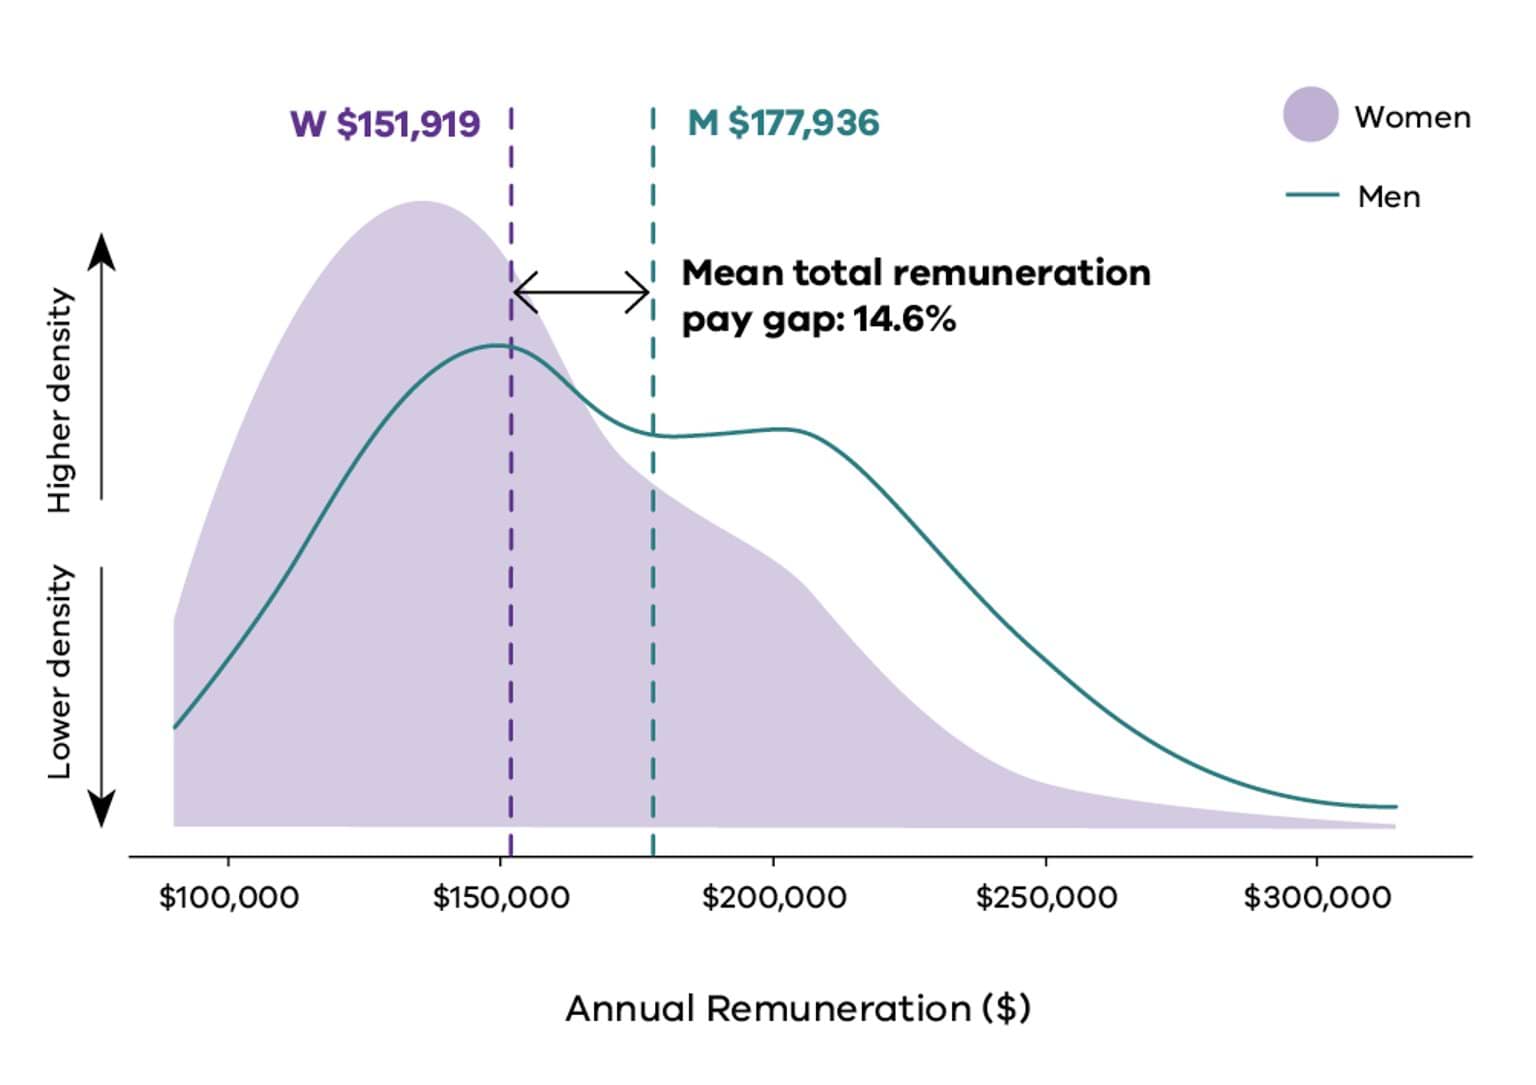
Figure 6: Gender pay distribution in finance and insurance (2025)
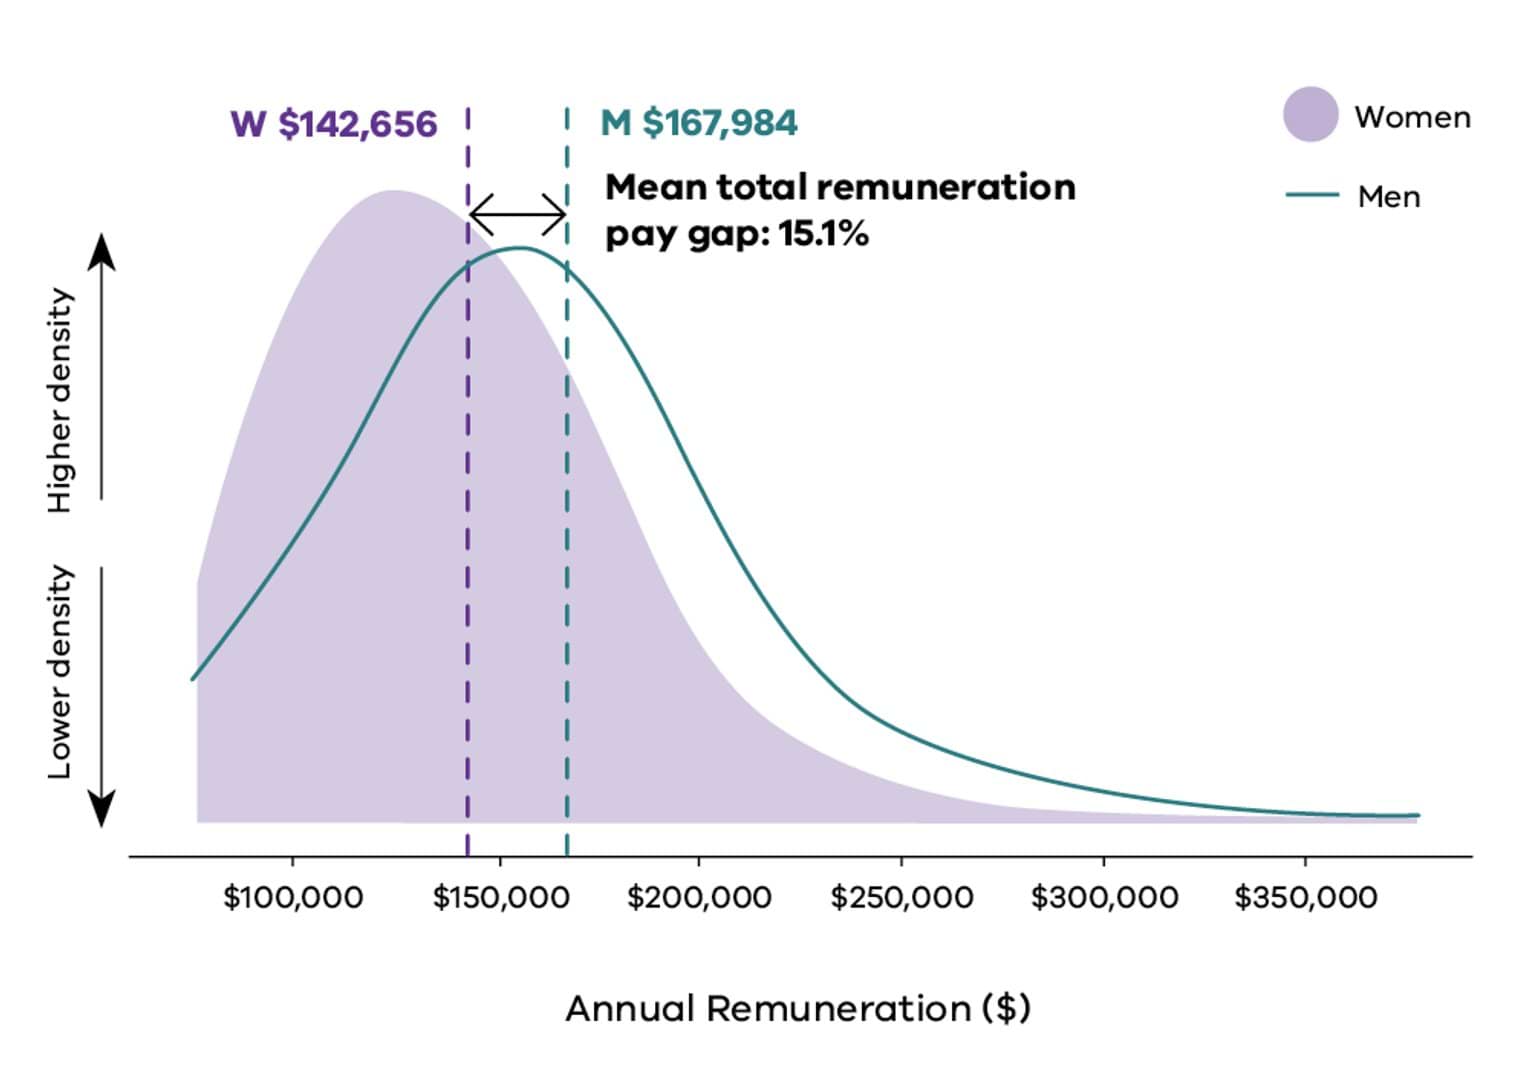
The gap for women in senior leadership increased
The gender pay gap for senior leaders widened in 2025. More women held senior leadership positions, but they were paid on average $31,063 less than men in senior roles.
Figure 7: Senior leader gender pay distribution (2025)
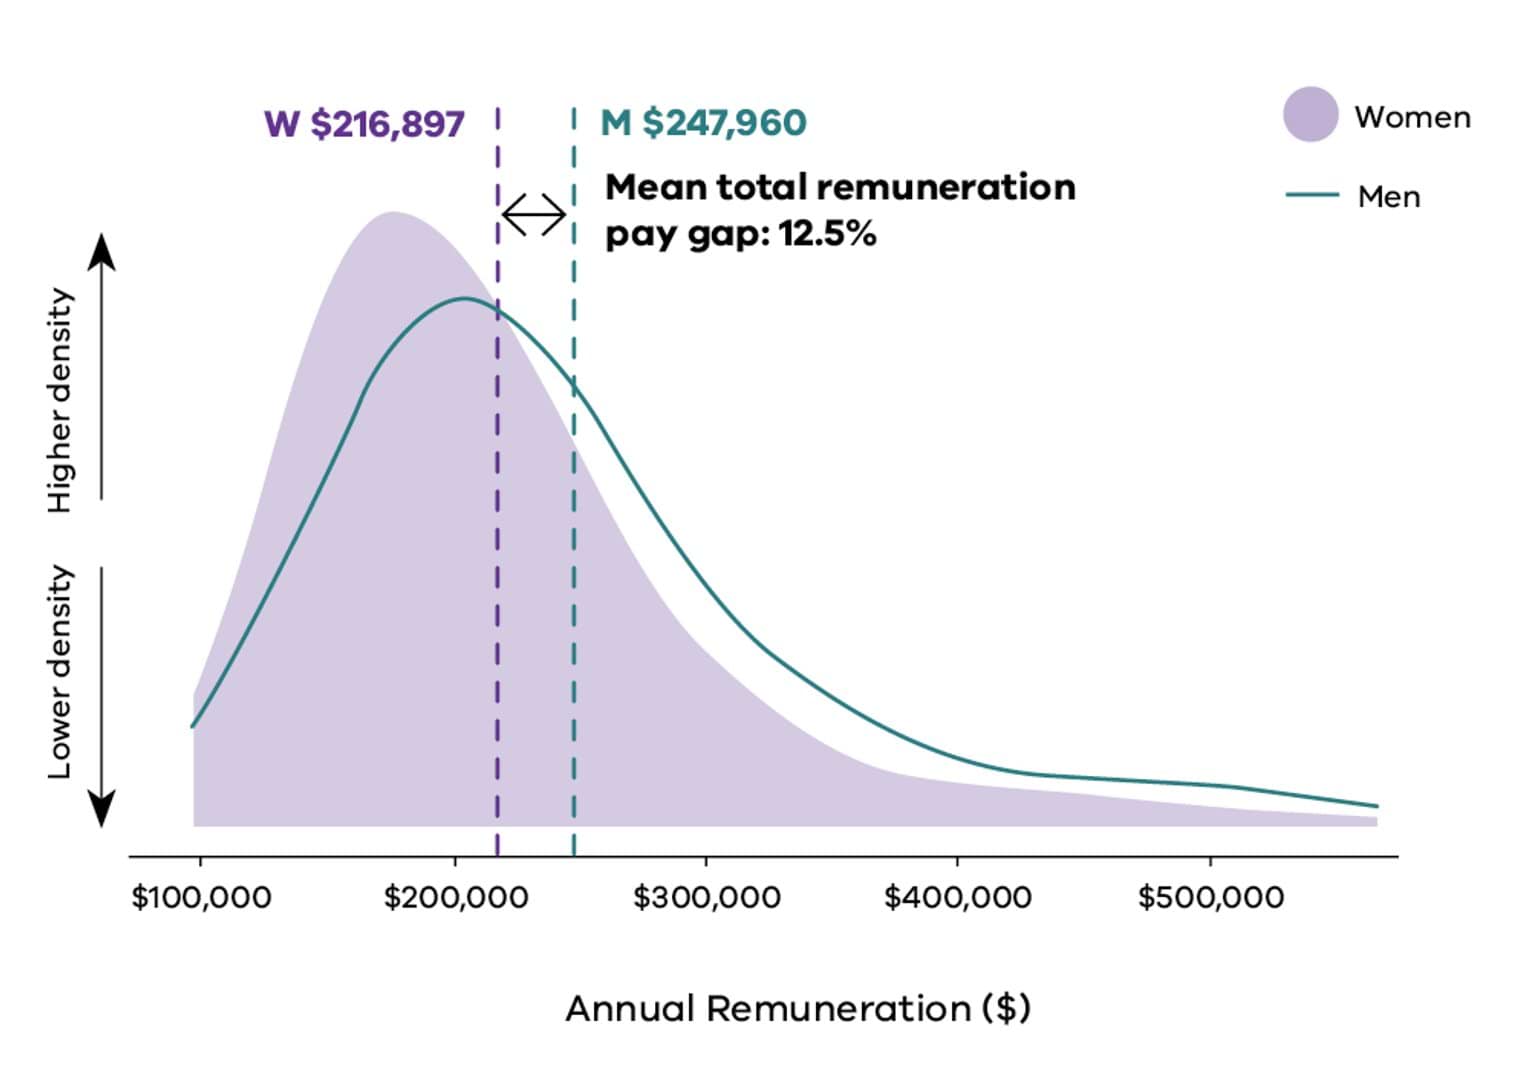
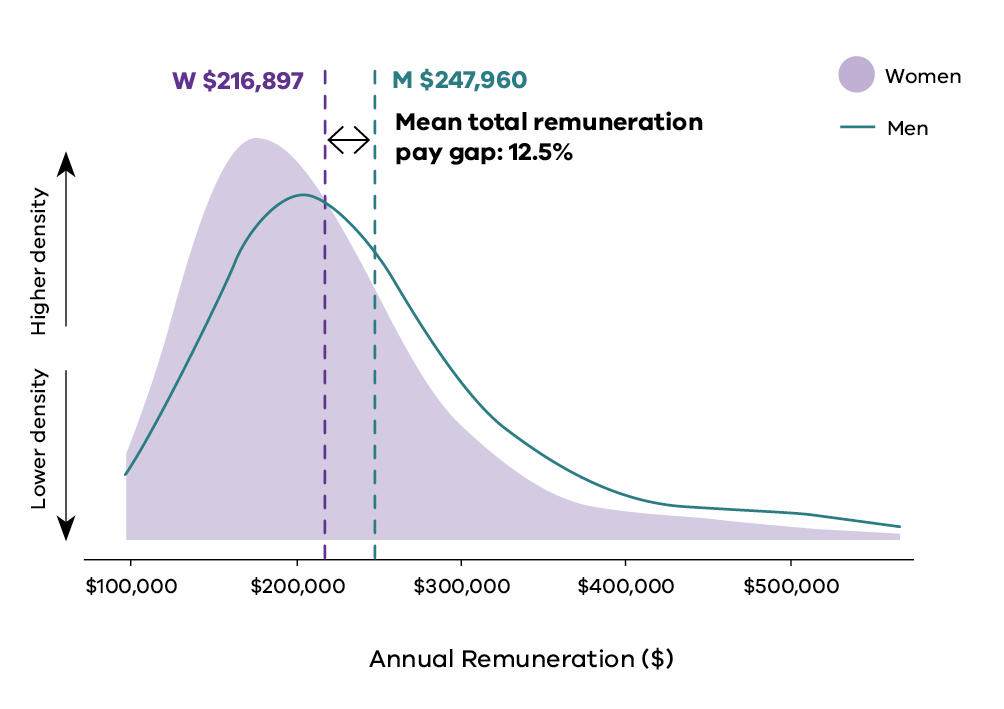
Change is possible - and it's happening
Between 2021 and 2025, gender pay gaps reduced in traditionally men-concentrated industries and occupations. So, where's positive change happening?
Occupations and industries
- Police and emergency services: pay gap down 6.1 percentage points
- Water and land management: pay gap down 2.9 percentage points
- Labouring roles: pay gap down 9.4 percentage points
- Machinery operators and drivers: pay gap down 3.3 percentage points
- Technicians and trade workers: pay gap down 0.8 percentage points
Indicator 4: Workplace sexual harassment
Why this matters
Workplace sexual harassment is one of the most serious and persistent barriers to workplace gender equality. It is also a significant work health and safety issue. Following recent changes to the Sex Discrimination Act 1984 (Cth), employers now have a positive duty to take reasonable and proportionate measures to eliminate sexual harassment, as far as possible. Simply responding to complaints is no longer sufficient – organisations must create safe workplace environments. Similarly, in 2023 changes relating to the prohibition of sexual harassment in the workplace took effect in the Fair Work Act 2009 (Cth). These were the introduction of a prohibition of sexual harassment of workers, an ability for an employer to be found vicariously liable for sexual harassment if they are unable to demonstrate that pro-active measures had been taken to prevent it, and the creation of an alternative path to pursue sexual harassment claims through the Fair Work Commission (FWC). Employers also have obligations under the Occupational Health and Safety Act 2004 (Vic) to provide and maintain a working environment that is safe and without risks to health, including psychological health.
Sexual harassment in the workplace remains too common. It causes psychological, physical and financial harm to victim-survivors. It carries a significant economic cost for organisations and the wider community. It is both a symptom and a driver of workplace gender inequality. It arises from unequal power relations and, if left unaddressed, reinforces them by limiting safety, participation and career progression.
Under the Gender Equality Act, duty holders collect complementary sources of information about workplace sexual harassment. Workforce data records the number of formal sexual harassment reports received by an organisation. Anonymous employee experience data captures both people's experiences of workplace sexual harassment and whether they said they had formally reported those experiences. Together, these data provide a more complete picture of workplace sexual harassment than either source can alone.
While other regulators such as WorkSafe Victoria, the Victorian Equal Opportunity and Human Rights Commission, and the Fair Work Commission, can respond to cases of sexual harassment when a complaint is made, the Public Sector Gender Equality Commissioner is the only regulator requiring Victorian public sector organisations to regularly and transparently report on sexual harassment at a workplace level.
This is important because many people who experience workplace sexual harassment never make a formal report. Barriers include fear of reprisal, uncertainty about reporting processes, lack of confidence that action will be taken, and limited understanding of what constitutes sexual harassment. Together, these barriers, and failures to formally record reports that are made, mean organisations may underestimate both the prevalence of workplace sexual harassment and the effectiveness of their reporting systems. These issues are examined in more detail below.
You can read more about sexual harassment, including its drivers and risk factors, in the Commission’s Insights report: Sexual harassment (2025).
How we define progress
The goal for this indicator is a workplace free from sexual harassment. This means an experience rate of zero, together with reporting systems that employees trust and use, and organisations consistently recording if incidents occur.
As organisations progress towards this goal, anonymous experience rates should decline. Organisations should also see the gap narrow between the proportion of employees who say they formally reported workplace sexual harassment in their employee experience data and the number of formal reports recorded in workforce data. A large gap between these measures suggests that some employees who believe they have made a formal report are not being captured in organisational reporting systems. Organisations need to ensure that employees understand how to make a formal report and feel safe doing so, and that managers consistently record and escalate reports in line with organisational processes, so they are reflected in workforce data (see Commissioner expectations below for more detail).
Experience rates should generally decline over time. However, temporary increases do not necessarily indicate that workplace sexual harassment has become more common. They may, for example, reflect improved awareness or greater confidence in recognising and naming sexual harassment. For this reason, workforce audit and employee experience data should always be interpreted together.
Workplace sexual harassment remains one of the Commissioner’s regulatory priorities because of the serious harm it causes and the persistence of employee experience rates. In 2023, only 60% of duty holders demonstrated compliance with the requirement to make progress on this indicator (or adequately explain their lack of progress). Strengthening the prevention of workplace sexual harassment, improving employees’ confidence to report it, and ensuring reports are consistently recorded and acted on will remain key priorities of the Commission’s regulatory work.
Progress between 2021 and 2025
Rates of sexual harassment have not decreased. Across the sector, employee experience rates barely changed between 2021 and 2025, and for non-binary and gender-diverse employees they increased substantially. The data also raises a serious question about how much harassment is visible to organisations. In employee experience data, more employees say they formally reported their experience of sexual harassment than the number reflected in organisations’ workforce data. This suggests that some reports are not being consistently recorded through formal organisational reporting systems. When this happens, victim-survivors may not receive appropriate support or a consistent organisational response. It also makes it harder for organisations to identify patterns of behaviour, detect repeat perpetrators, learn from incidents and prevent future harm.
There is an encouraging sign within this picture. In 2025 a larger proportion of people who said they experienced harassment in employee experience data also said they reported it formally. A greater number of formal reports from women were also recorded in workforce data, with the increase primarily driven by the public health care sector. A small proportion of the increase came from organisations that did not have available data in previous reporting periods, or that were new duty holders in 2025. These shifts sit firmly within an overall finding of insufficient progress. Sexual harassment is a serious work health and safety issue with lasting effects on individuals and organisations. It is always unacceptable, and organisations have a legal duty to prevent it and respond appropriately when incidents occur.
Key data measures are presented in Tables 4.1 to 4.3. Findings are discussed in further detail after the tables.
Sexual harassment experience
Table 4.1a: Survey respondents who said they experienced sexual harassment at work
| Gender | 2021 | 2023 | 2025 | Percentage point change 2021-2025 | Progress |
|---|---|---|---|---|---|
| Women | 6.5% | 6.6% | 6.4% | -0.04pp | Poor (8 – Matrix) |
| Men | 3.6% | 3.5% | 3.5% | -0.05pp | Moderate (9 – Matrix) |
| Self-described | 12.7% | 13.7% | 16.9% | +4.18pp | n/a |
Table 4.1b: Proportion of respondents who said they experienced sexual harassment, who also said they reported it
| Gender | 2021 | 2023 | 2025 | Percentage point change 2021-2025 | Progress |
|---|---|---|---|---|---|
| Women | 4.6% | 6.9% | 7.3% | +2.75pp | Poor (7 – Matrix) |
| Men | 3.4% | 4.0% | 4.2% | +0.79pp | Poor (7 – Matrix) |
| Self-described | 4.2% | 4.9% | 8.3% | +4.06pp | n/a |
Table 4.1c: Number of complainants formally reporting sexual harassment according to workforce data
| Gender | 2021 | 2023 | 2025 | Percentage point change 2021-2025 | Progress |
|---|---|---|---|---|---|
| Woman or group of women | 844 | 615 | 1165 | +321 | n/a |
| Man or group of men | 376 | 139 | 164 | -212 | n/a |
| Person or people of self-described gender | 4 | 3 | 6 | +2 | n/a |
| Group of mixed genders, or prefer not to say | Not available | 105 | 80 | +80 | n/a |
| Gender data unavailable | Not available | 118 | 782 | +782 | n/a |
Source: Workplace gender audit workforce data, 2021, 2023 and 2025. People matter survey data, 2021, 2023 and 2025.
Notes: To understand how to interpret the different types of progress ratings, see Data measures in Appendix 1. Public health participation in the survey was lower in 2025 than in 2023. We tested whether this affected these results and it did not. See Data caveats in Appendix 1 for more details. The number of complainants is an underrepresentation. Duty holders under the Act are required to report on each formal complaint received by the organisation, and whether the complaint was made by an individual or group, of what gender(s). Duty holders optionally provide the number of complainants. The figure in table 4.1 includes the total number of complainants reported to the Commission. But the optional nature of this data in 2021 and 2023 means that not all duty holders provided data. The percentage point change column may not always reflect the exact difference between years due to rounding.
Sexual harassment response
Table 4.2a: Survey respondents who did not report due to a lack of trust and confidence
| Gender | 2021 | 2023 | 2025 | Percentage point change 2021-2025 | Progress |
|---|---|---|---|---|---|
| Women | 60.0% | 56.5%
| 59.5% | -0.50pp | n/a |
| Men | 64.1% | 63.7% | 63.0% | -1.12pp | n/a |
| Self-described | 78.8% | 73.5% | 72.9% | -5.89pp | n/a |
Table 4.2b: Survey respondents who did not report due to a lack of information and guidance
| Gender | 2021 | 2023 | 2025 | Percentage point change 2021-2025 | Progress |
|---|---|---|---|---|---|
| Women | 53.7% | 54.6% | 50.3% | -3.43pp | n/a |
| Men | 46.6% | 49.2% | 49.6% | +3.00pp | n/a |
| Self-described | 48.7% | 51.6% | 45.2% | -3.46pp | n/a |
Table 4.2c: Survey respondents who were satisfied with how their report was handled
| Gender | 2021 | 2023 | 2025 | Percentage point change 2021-2025 | Progress |
|---|---|---|---|---|---|
| Women | 53.8% | 60.8% | 57.7% | +3.85pp | Poor (7 – Matrix) |
| Men | 25.7% | 55.1% | 38.3% | +12.58pp | Moderate (13 – Matrix) |
| Self-described | 50.0% | 14.3% | 28.6% | -21.43pp | n/a |
Source: People matter survey data, 2021, 2023 and 2025.
Notes: To understand how to interpret the different types of progress ratings, see Data measures in Appendix 1. The percentage point change column may not always reflect the exact difference between years due to rounding.
Table 4.3: Total number of complainants who formally reported sexual harassment according to workforce data by industry
| Industry | 2021 | 2023 | 2025 | Change 2021-2025 |
|---|---|---|---|---|
| Community and cultural services | 19 | 25 | 86 | +67 |
| Finance and insurance | 3 | 6 | 6 | +3 |
| Local government | 37 | 81 | 163 | +126 |
| Other | 1 | 3 | 9 | +8 |
| Police and emergency services | 87 | 229 | 109 | +22 |
| Public health care | 946 | 409 | 1464 | +518 |
| TAFE and other education | 4 | 14 | 61 | +57 |
| Transport | 4 | 11 | 9 | +5 |
| Universities | 27 | 47 | 116 | +89 |
| Victorian Public Service | 88 | 145 | 155 | +67 |
| Water and land management | 8 | 10 | 19 | +11 |
Table 4.4: Sexual harassment experience for groups facing intersecting inequalities
| Measure | 2021 | 2023 | 2025 | Percentage point change 2021-2025 |
|---|---|---|---|---|
| Women aged 15-24 | 14.1% | 15.4% | 13.9% | -0.12pp |
| First Nations women | 6.5% | 9.1% | 7.6% | +1.12pp |
| Women with disability | 11.6% | 11.8% | 11.7% | +0.11pp |
| CARM women | 5.4% | 6.2% | 5.7% | +0.26pp |
| Non-binary or gender-diverse people | 12.7% | 13.7% | 16.9% | +4.18pp |
Source: People matter survey data, 2021, 2023 and 2025.
Notes: The percentage point change column may not always reflect the exact difference between years due to rounding. CARM is an acronym for ‘culturally and racially marginalised’. See Intersectionality at work (2023) for further discussion around language the Commission uses to describe groups that experience compounded discrimination.
Signs of progress
More sexual harassment reporting was visible in the data in 2025, in two different ways
Within an overall picture of insufficient progress, the data shows some encouraging movements in reporting.
In the employee experience survey data, a growing share of people who experienced sexual harassment said they went on to report it formally. Among women, the proportion rose from 4.6% in 2021 to 7.3% in 2025. For men it rose from 3.4% to 4.2%, and for non-binary and gender-diverse people it rose from 4.2% to 8.3%.
In the workforce data, the number of formal reports recorded by organisations also rose for women. In 2025, Victorian public sector organisations recorded 1165 formal reports through formal reporting mechanisms made by women who witnessed or experienced sexual harassment – 321 more than in 2021. Over the same period, formally recorded reports from men fell from 376 to 164, and formal reports from people who self-describe their gender rose slightly, from 4 in 2021 to 6 in 2025.
The data shows that increased formal reporting was largely driven by the public health care industry. Several large, metropolitan health services increased their numbers of formal reports of sexual harassment significantly, even between 2023 and 2025. This is likely due to a combination of improved data collection and reporting, as well as a potential increase in actual reports made. Given the public health care industry has among the highest rates of sexual harassment in the Victorian public sector, increased ability to monitor and respond to sexual harassment through improved reporting processes and systems is a positive step. Centralised formal reporting matters. It is what allows a person who reports to be supported safely, and an incident to be investigated and appropriately dealt with.
Areas for attention
The sector did not make sufficient progress in reducing sexual harassment
Sexual harassment remains one of the most concerning areas in duty holders’ data. Experience rates for women and men were essentially unchanged from 2021, and the rate for non-binary and gender-diverse employees rose. In 2025, anonymous survey data showed 6.4% of women experienced sexual harassment (6.5% in 2021) and 3.5% of men (3.6% in 2021), while the rate for non-binary and gender-diverse people rose from 12.7% to 16.9%. Despite years of awareness-raising and policy attention, many organisations are not yet demonstrating sufficient progress in prevention.
The industries with the highest sexual harassment experience rates for women were police and emergency services (11.8%), transport (10.6%) and community and cultural services (10.2%). For men, the highest rates were in public health care (6.1%), police and emergency services (4.7%) and local government (4.6%).
As noted above, there has been a concerted push from governments to prevent and address workplace sexual harassment in recent years. The Gender Equality Act has been in operation for 5 years, requiring duty holders in Victoria to demonstrate reasonable and material progress on sexual harassment every 2 years. At the federal level, changes to the Sex Discrimination Act 1984 also placed a positive duty on organisations to actively prevent sexual harassment, rather than just respond to occurrences. Within this legislative and policy environment, duty holders must be able to show they are identifying risks, implementing effective prevention measures, responding appropriately when harassment occurs, and reviewing whether those measures are working. Where an organisation cannot demonstrate meaningful progress or effective prevention, the Commissioner will continue to use the regulatory and compliance powers available under the Gender Equality Act to drive change.
Read more about recent changes to sexual harassment regulation, and how to prevent and respond to sexual harassment, in the Commission’s Insights report: sexual harassment 2025.
Rates of sexual harassment were much higher for groups experiencing intersectional gender inequality
Employees who experience intersecting forms of discrimination and disadvantage continued to experience sexual harassment at higher rates. The highest rates of all were experienced by non-binary and gender-diverse people, whose experience rate rose 4.18 percentage points since 2021 (from 12.7% to 16.9%). This is the largest increase of any group in Table 4.4. The next largest increase was among First Nations women (7.6% in 2025, up 1.12 percentage points). Rates for CARM women (6.4%), young women (13.9%) and women with disability (11.7%) were largely unchanged since 2021. All require immediate attention.
Patterns in who reports sexual harassment were strongly gendered
Women continued to report sexual harassment more often than men. Research indicates the reasons are highly gendered. Women experience more severe forms of harassment, at higher rates (Nielsen et al. 2010; AHRC 2022). Men are less likely to label their experiences as harassment (Keenan et al. 2024; Węziak-Białowolska et al. 2020). And, men are more reluctant to report formally, because doing so conflicts with traditional gender roles (McDonald and Charlesworth 2016).
Formal reporting by men and by non-binary and gender-diverse employees was low, and confidence and sense of safety among gender-diverse employees was poor. Together with the high and increased experience rate for this group, this points clearly to the need for reporting pathways that are safe and inclusive for employees of all genders.
Much sexual harassment was invisible to the systems meant to manage it
Sexual harassment cannot be prevented if organisations cannot see where it is occurring. Yet the data suggests that, in many workplaces, a significant proportion of sexual harassment remains invisible to the systems responsible for addressing it.
Employee experience survey data consistently shows that some employees who experience sexual harassment say they have formally reported it. However, the number of formal reports recorded in workforce reporting data is often substantially lower than those survey responses would lead us to expect. Formal reports include complaints made by witnesses or bystanders (as well as victim-survivors), and can come from members of the public, clients and patients, as well as employees. They are therefore not directly comparable to the employee experience survey data. But given formal reports cast a wider net, they should reflect higher numbers of reports.
The discrepancy between employees who say they experienced sexual harassment and the number of formal reports raises important questions about how reports are being captured. It may indicate that employees are reporting incidents to managers or supervisors, but that these reports are not always being formally documented, escalated through organisational processes, or reflected in workforce reporting systems. As a result, senior leaders may have an incomplete picture of the scale and nature of sexual harassment in their organisation and how complaints are being addressed.
This gap has significant consequences. People who disclose harassment may not receive appropriate support, follow-up or resolution. Organisations may be unable to identify patterns of behaviour, detect problem areas or assess whether prevention initiatives are working. Most importantly, an organisation cannot meet its positive duty to prevent sexual harassment if incidents are not visible within its own systems.
Closing this gap requires more than encouraging people to speak up. Organisations must ensure that every disclosure at every level is consistently recorded, appropriately escalated, and built into organisational reporting and risk-management processes. Employees need confidence that reporting is safe, meaningful and will lead to action. Leaders need confidence that the information reaching them reflects their employees lived experiences.
Read together, experience and workforce data show both the prevalence of harassment (survey data) and whether reporting and response systems are working (workforce reporting data). A large gap between them is a signal that harassment is occurring but is not being systematically captured. The Commissioner expects duty holders to treat this as a governance and work health and safety issue, requiring the same rigour applied to any other significant workplace risk.
Commissioner expectations
The Commissioner expects urgent action to drive down sexual harassment and to improve formal reporting. The lack of progress on this indicator is concerning. Sexual harassment causes serious emotional, psychological and physical harm. It damages careers and workplace culture and disproportionately impacts women and gender diverse people. Any instance of sexual harassment is unacceptable and must be taken extremely seriously.
Organisations are legally required to take proactive steps to prevent and eliminate sexual harassment under anti-discrimination and occupational health and safety laws. Relevant legislation includes the Sex Discrimination Act 1984 (Cth), Equal Opportunity Act 2010 (Vic), and the Occupational Health and Safety (Psychological Health) Regulations 2025 (Vic). This means that organisations must treat sexual harassment as a workplace hazard, not a misconduct or complaints issue. Under the Fair Work Act 2009 (Cth), organisations may also be found to be liable for sexual harassment of an employee where they have failed to take proactive measures to prevent it.
To comply with these obligations, organisations must have effective systems to collect and report robust and timely workplace sexual harassment data. Without this data, it is not possible to genuinely identify, assess and develop strategies to eliminate workplace sexual harassment and its root causes as a psychosocial hazard. It is also not possible to track progress. The current gaps in this data would be unacceptable in any other area of work health and safety. Duty holders must improve their ability to capture this information with the same amount of due diligence they apply to the other areas of their work health and safety obligations.
Anonymous survey data and formal reporting data each tell organisations something different, and both are needed. Survey data reveals the true extent of harassment – who is experiencing it, who is perpetrating it, what kind of harassment is occurring, how many people say they have reported it, and what stops people reporting. Formal reporting data shows whether the organisation’s own systems are working. This includes whether disclosures are being recorded, victim-survivors are supported, incidents are addressed, patterns of perpetration are identified, and complaints processes are holding up.
When formal reporting falls well short of what the survey data would predict, it is not a neutral data gap. It is a system failure. It means disclosures are being made but are not reaching the systems meant to act on them. People who have spoken up may not be well supported. And leaders are making decisions on an incomplete picture of the risk in their own organisation. The Commissioner expects duty holders to actively close this gap and to treat a persistent divergence between employees who say they have experienced sexual harassment, employees who say they have reported sexual harassment, and workforce data on formal reports, as a serious governance and work health and safety failure.
Certain groups that experience intersecting forms of discrimination are at higher risk of sexual harassment. Sexual harassment for these groups may also take different forms (see, for example, AHRC 2025). Organisations must be aware of these risks in their prevention and response strategies. Limited data about the experiences of these groups does not excuse inaction. Sexual harassment prevention and response should consider how intersecting inequalities shape risk and safety to speak up. Improving data collection and analysis from an intersectional perspective will also help to strengthen prevention efforts and ensure people facing heightened risk are able to report safely.
A concrete step duty holders should take is to establish a clear pathway so that no disclosure of sexual harassment stops at an individual people leader. At a minimum, this means establishing:
- a recording obligation on every people leader to log each disclosure of actual or suspected sexual harassment they receive – including disclosures made informally and by third party witnesses – in the organisation’s central reporting system. This ensures the complaint is captured as workforce data even where the person does not wish to make a formal complaint
- a de-identified recording option, so a disclosure can be logged for risk and pattern-detection purposes without naming the person, where that is the discloser’s preference. This will separate capturing the data from triggering a formal process and protects the discloser’s control over what happens next
- a clear distinction between recording and acting, that is understood by all leaders. Recording is expected in every case, while the decision to proceed to formal investigation should ordinarily follow the wishes of the person affected. There should be defined exceptions where there is a serious or ongoing risk to that person or others
- manager capability and accountability, so people leaders know how to receive a disclosure safely, understand their recording obligation and can explain the de-identified option
- Health and Safety Representative training specific to identifying, reporting and responding to workplace sexual harassment
- workforce awareness and training, so that employees are aware of the reporting options available to them and the ability to report an incident of sexual harassment without an obligation to pursue a formal complaint
Recording protocols must protect confidentiality in practice, not only by removing a name. In small teams or organisations, the details of an incident may identify those involved regardless. Organisations should design recording and reporting processes in a way that keeps individuals safe and maintains trust. Done well, this approach means disclosures reach the organisation’s systems and inform its risk identification and control approach, without removing the discloser’s autonomy or deterring people from speaking up.
Reporting protocols should also be tailored to the organisation’s specific context and what is known about the nature and experience of sexual harassment. For example, organisations with large public-facing workforces have the same legal obligation to eliminate and prevent sexual harassment of their employees by third parties (such as customers, patients and students). It is important that data capturing practices and reporting protocols are designed to account for this.
Ultimately, duty holders must demonstrate targeted, context-specific prevention and culture-change strategies. They must consider how, when, where and why harassment is occurring: How safe do employees feel to report, and how do they navigate the process? Is harassment concentrated in particular work areas, and who is perpetrating it – colleagues, managers or members of the public?
Five years after the Act came into effect, duty holders need to move beyond generic approaches built on training alone or basic reporting systems. They must be designing and implementing context-specific strategies that measurably drive down the sexual harassment experience rate and increase formal reporting.
Spotlight on sexual harassment
In 2025, 2197 formal reports of sexual harassment were made across the public sector.
Sexual harassment causes serious harm. Organisations must take urgent action to prevent and address it.
Experience of sexual harassment persists
The experience rate of workplace sexual harassment across the sector has remained persistent.
Employee experience surveys show that in 2025, sexual harassment was experienced across the sector by:
- Women: 6.4%
- Men: 3.5%
- Non-binary or gender-diverse people: 16.9%
Industries with highest rates of sexual harassment of women:
- Police and emergency services: 11.8%
- Transport: 10.6%
- Community and cultural services: 10.2%
Industries with highest rates of sexual harassment of men:
- Public health care: 6.1%
- Police and emergency services: 4.7%
- Local government: 4.6%
Groups experiencing compounded gender inequality
Some people experience more workplace sexual harassment:
- Women aged 15-24: 13.9%
- Women with disability: 11.7%
- First Nations women: 7.6%
- CARM women: 6.4%
Reporting gaps cause blind spots
Not everyone who experiences sexual harassment in the workplace formally reports it.
Some people do not report sexual harassment because they don’t know how to. Others don’t trust that the issue will be dealt with fairly.
In some cases, a person discloses to their manager, but the disclosure is never formally recorded or escalated.
When sexual harassment happens, but is not formally reported, it causes reporting gaps. Reporting gaps mean that leaders are making decisions on an incomplete picture of the risk in their organisation. They also mean people who have spoken up about sexual harassment to their manager may not be appropriately supported, and perpetrator behaviour may not be properly addressed.
Figure 8: Sexual harassment experience and reporting rates (employee experience survey data, 2025)
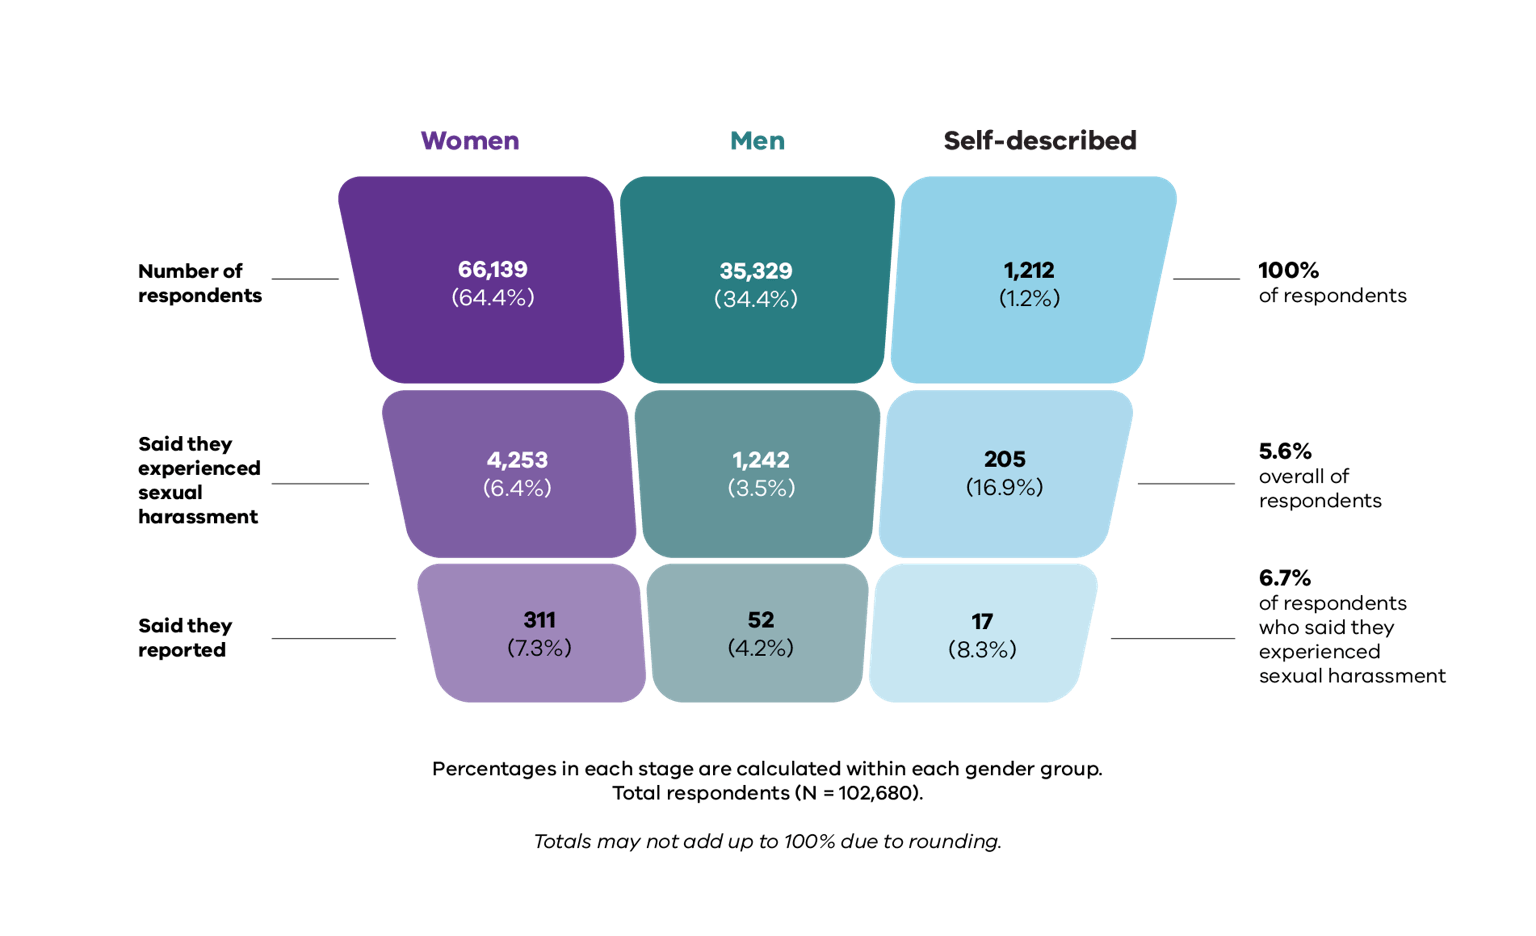
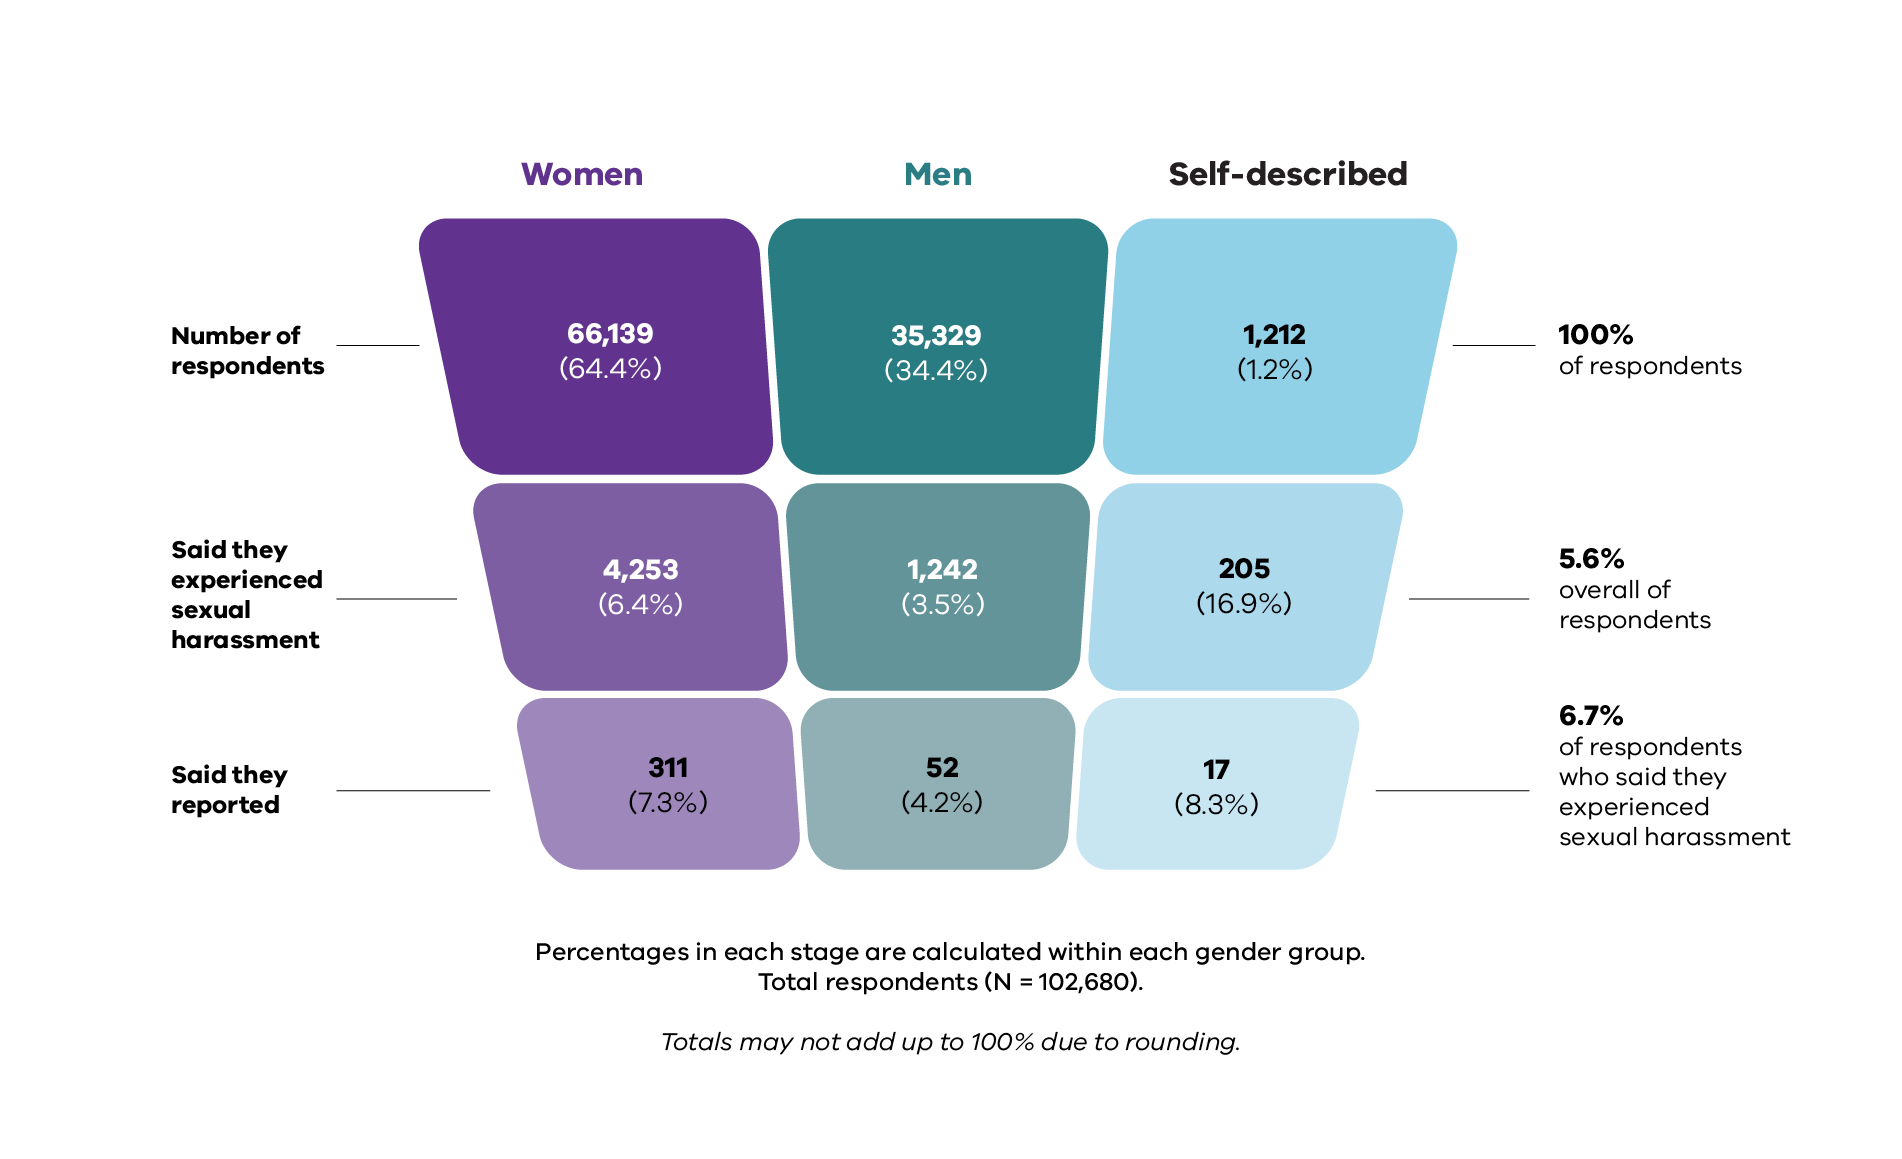
Reporting and experience rates considered together
TAFE and other education and the Victorian Public Service have lower experience rates (3.8% for TAFE, 3.2% for VPS) and higher reporting rates (7.6% for TAFE, 6.7% for VPS) according to employee survey data. These industries have the strongest result when looking at both measures together.
Figure 9: Sexual harassment experience and reporting rates by industry (survey data, 2025)
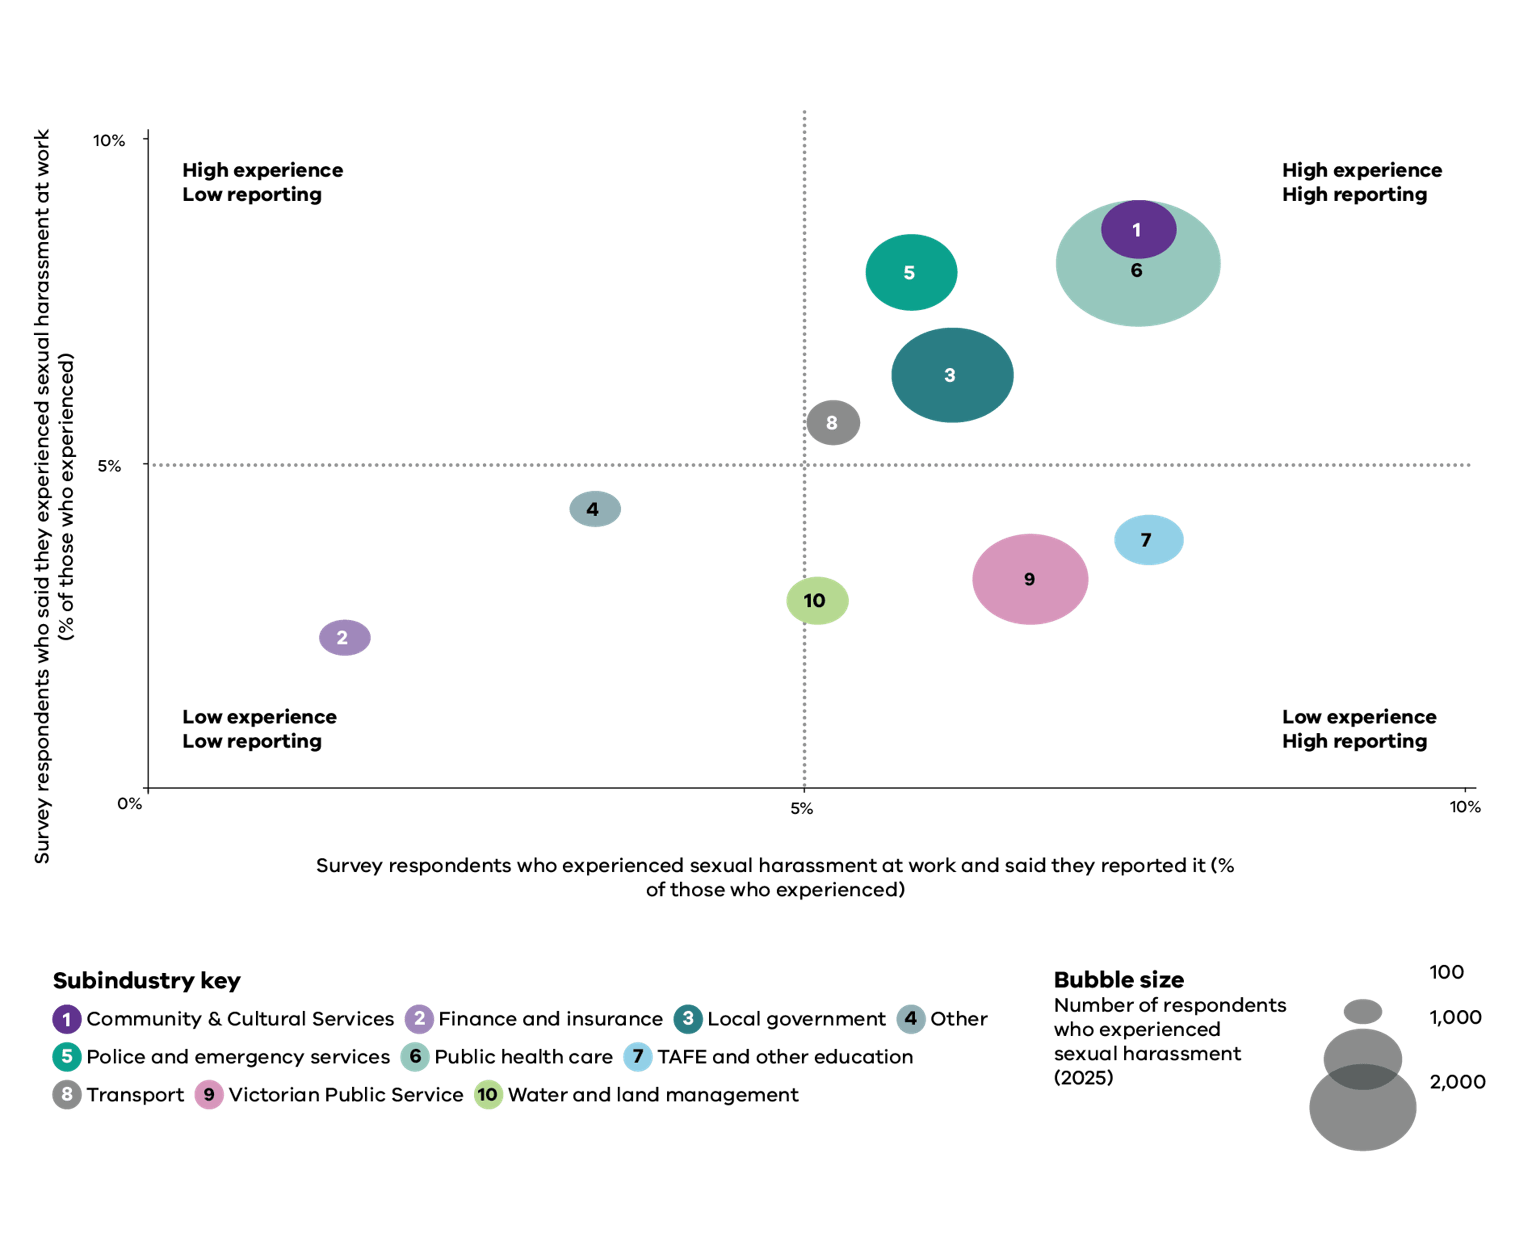
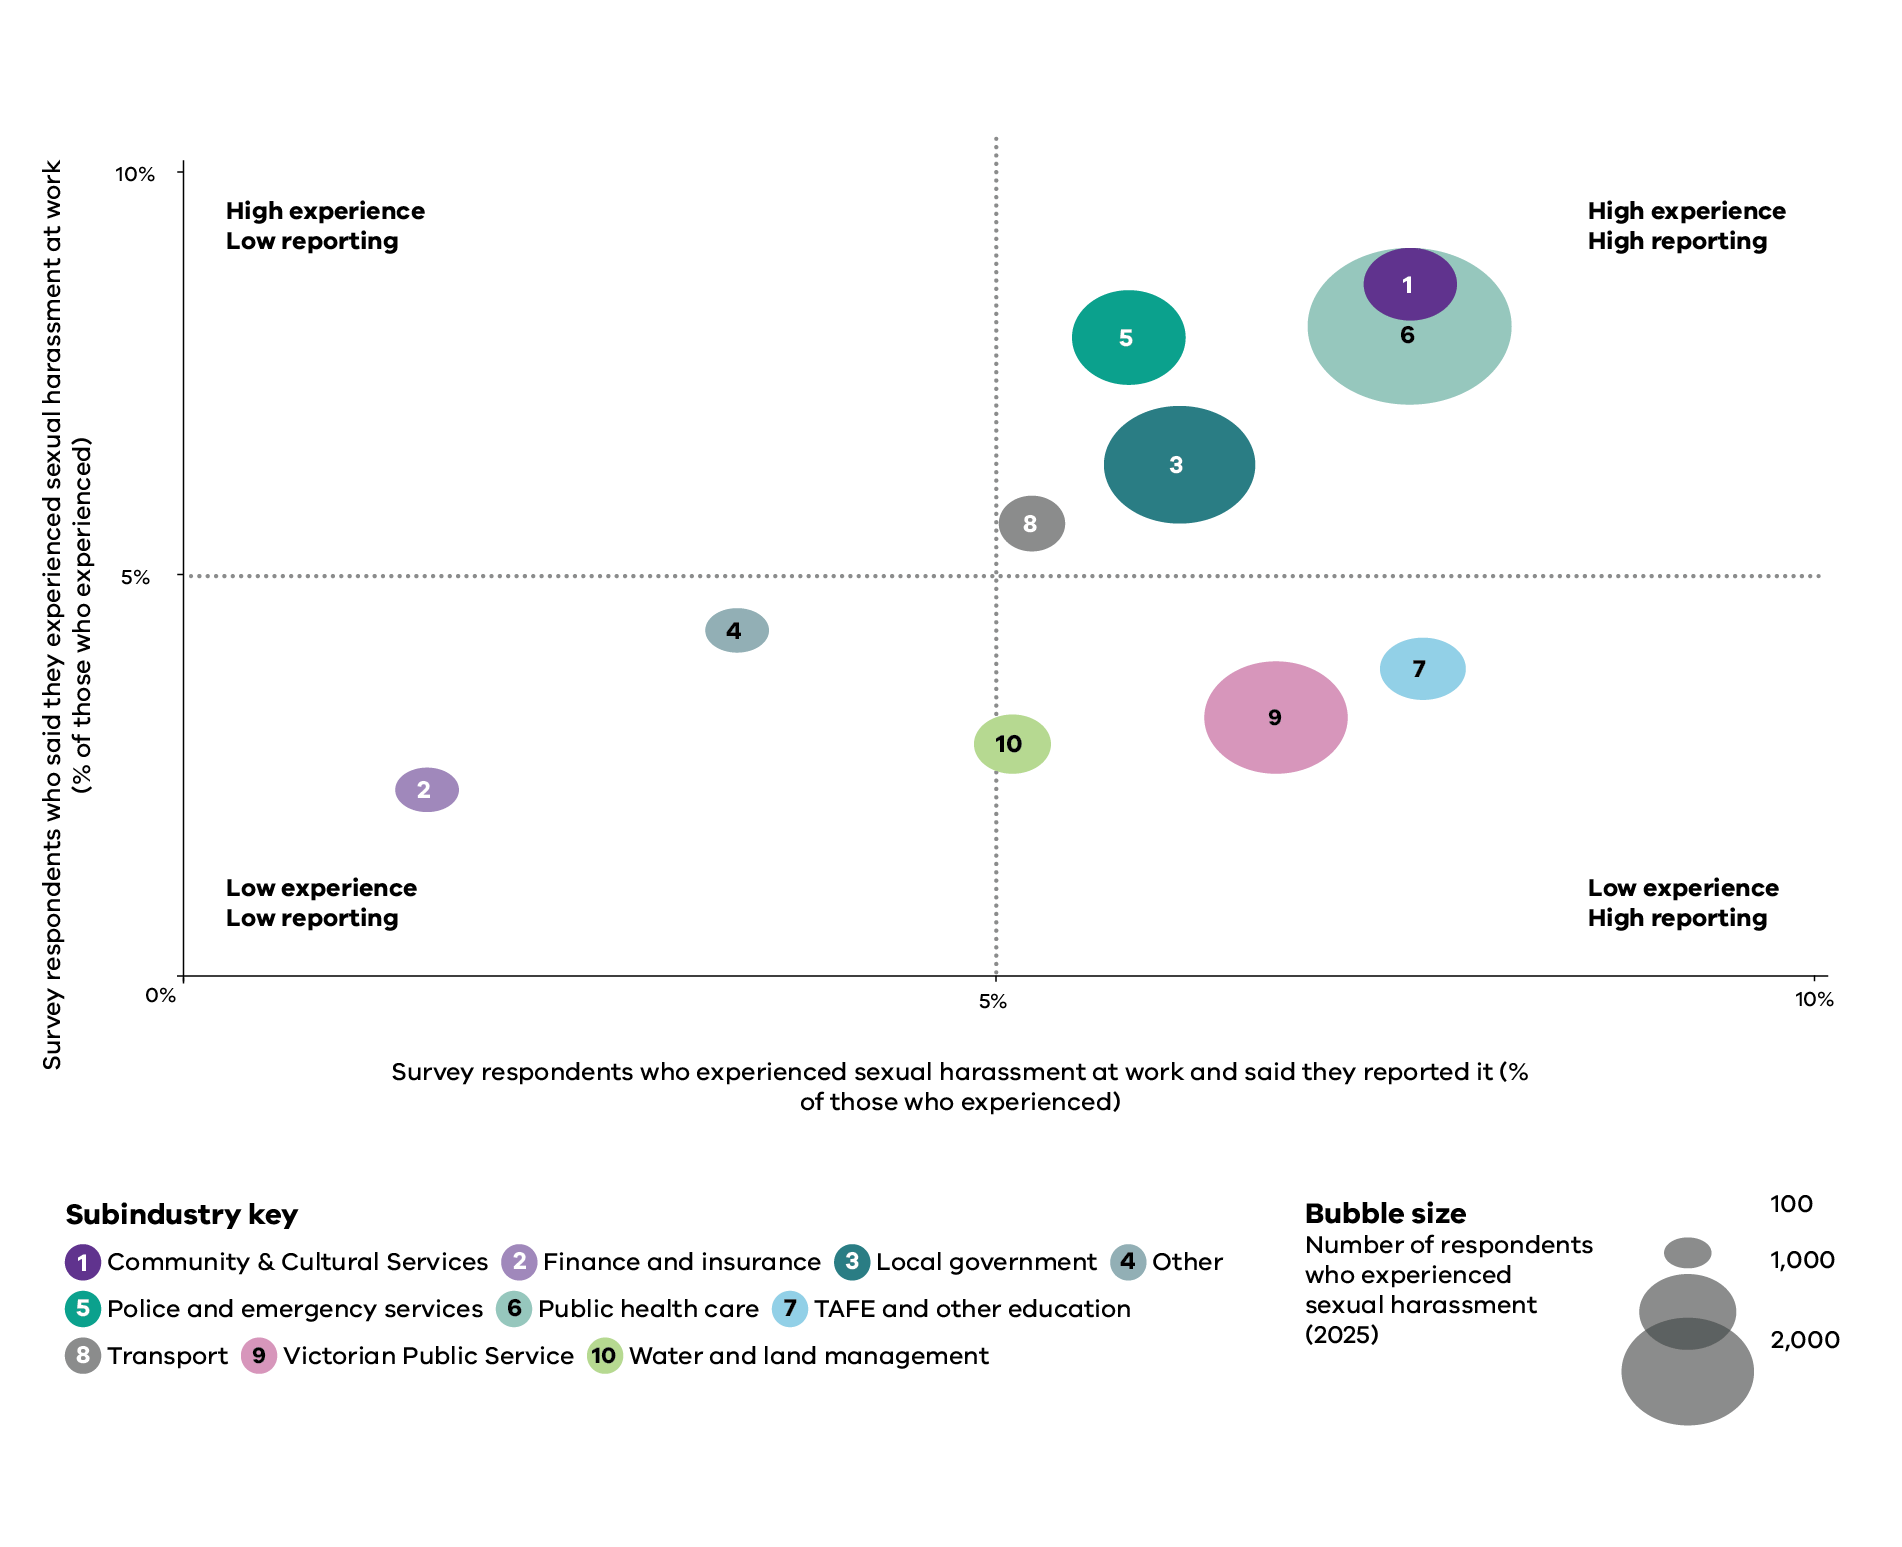
Indicator 5: Recruitment and promotion
Why this matters
Gender equitable recruitment and promotion practices are central to gender equality. Recruitment and promotion are pivotal moments that shape pay, progression and the gender composition of the workforce, so where access is unequal, the effects compound across careers.
Gender bias and stereotypes can shape recruitment, promotion and career progression, meaning women do not always have the same access to opportunities as men. This is often because particular industries or occupations have long been associated with a particular gender.
Many jobs are still designed around an ‘ideal worker’ who does not have caring responsibilities. Women can be discouraged from applying for roles by arbitrary requirements in job advertisements, gendered language in position descriptions, and unexamined assumptions about when and where work must be done. Other practices mean women can miss out on an interview or a role because of bias and dominant social norms. Recruitment is therefore a key point at which organisations can either entrench gender concentration or begin to shift it.
Bias does not stop at hiring. Women who take leave for caring responsibilities, or who work part time or flexibly, are often seen as less committed. Being denied equal access to promotion and training is also a key driver of the gender pay gap, because it constrains progression into more senior, better-paid roles.
Data on recruitment and promotion outcomes shows where careers may be stalling and helps organisations design fairer opportunities. This helps organisations improve gender composition across the workforce and within specific areas. You can read more in the Baseline report (2021, pp. 73-74).
How we define progress
In recruitment, context determines what progress looks like. The goal is movement towards a more gender balanced workforce. In a women-concentrated organisation (for example, one where 70% of employees are women), recruiting more women is unlikely to represent progress unless they are being recruited into occupations, roles or parts of the organisation where women are currently underrepresented. In these organisations, progress will often mean attracting, recruiting and retaining more men in women-concentrated roles and areas of the workforce. Equally, organisations should ensure that men are not recruited predominantly into senior or traditionally masculine roles, as this would reinforce existing inequalities rather than reduce them.
For promotion, the key question is whether those promoted reflect the gender composition of the workforce. If women make up 70% of an organisation, they would generally be expected to receive around 70% of promotions. If they receive substantially fewer, men are being promoted disproportionately. Progress therefore means moving towards promotion outcomes that reflect the workforce composition. As discussed under Indicator 1: Gender composition of the workforce, organisations in men-concentrated industries may also choose to promote more women deliberately to increase women’s representation at all levels (Gould et al. 2018).
Organisations should analyse their employee experience survey data to understand whether perceptions of recruitment and promotion processes differ by gender. This can help identify barriers that may not be apparent from workforce data alone.
Progress between 2021 and 2025
The Victorian public sector has improved access to promotion and development for people of all genders since 2021. Perceptions of recruitment fairness also rose across the board. These are real gains.
They are not evenly shared, however. Two findings warrant close attention: the gap in access to development opportunities widened in favour of men, and gender-diverse employees reported barriers to career advancement at more than twice the rate of men. At the same time, the proportion of men reporting barriers reduced, widening the gap with gender-diverse employees.
Key data measures are presented in Tables 5.1 to 5.4. Findings are discussed in further detail after the tables.
Table 5.1: Development and promotion trends5
| Measure | 2021 | 2023 | 2025 | Percentage point change 2021-2025 | Progress |
|---|---|---|---|---|---|
| Proportion of women promoted | 2.3% | 4.0% | 8.2% | +5.9pp | n/a6 |
| Proportion of men promoted | 2.7% | 5.1% | 8.3% | +5.5pp | n/a |
| Gender gap in promotions | 0.4% | 1.1% | 0.0% | -0.4pp | Excellent (18 – Matrix) |
| Proportion of women accessing development opportunities | n/a | 20.2% | 27.5% | +7.2pp | n/a |
| Proportion of men accessing development opportunities | n/a | 26.5% | 36.1% | +9.6pp | n/a |
| Proportion of people of self-described gender accessing development opportunities | n/a | 11.9% | 12.6% | +0.8pp | n/a |
| Gender gap in development opportunities (percentage point) | n/a | 6.3% | 8.6% | +2.4pp | Moderate (12 – Matrix) |
Source: Workplace gender audit workforce data, 2021, 2023 and 2025.
Notes: To understand how to interpret the different types of progress ratings, see Data measures in Appendix 1. To read more about how the Commission calculates gender gaps, see Gender gaps in Appendix 1. Gender gaps are always calculated between men and women. A gap greater than zero is in favour of men, and a gap less than zero is in favour of women. The percentage point change column may not always reflect the exact difference between years due to rounding.
Table 5.2: Gender gap in promotions by industry
| Industry | 2021 | 2023 | 2025 | Percentage point change 2021-2025 | Progress |
|---|---|---|---|---|---|
| Community and cultural services | -1.0% | -0.2% | -0.5% | +0.5pp | Excellent (18 – Matrix) |
| Finance and insurance | 0.0% | -1.3% | 1.1% | +1.1pp | Excellent (18 – Matrix) |
| Local government | 0.0% | -0.3% | -0.3% | -0.3pp | Excellent (18 – Matrix) |
| Other | -0.6% | -1.6% | -0.8% | -0.2pp | Excellent (18 – Matrix) |
| Police and emergency services | 0.0% | 0.6% | 2.6% | +2.6pp | Excellent (18 – Matrix) |
| Public health care | -0.6% | -0.2% | -0.1% | +0.6pp | Excellent (18 – Matrix) |
| TAFE and other education | -0.5% | -2.2% | -1.2% | -0.7pp | Excellent (18 – Matrix) |
| Transport | -2.1% | -1.3% | -2.8% | -0.6pp | Excellent (18 – Matrix) |
| Universities | -0.3% | -0.1% | -0.3% | 0.0pp | Excellent (18 – Matrix) |
| Victorian Public Service | 0.0% | 1.3% | -0.3% | -0.3pp | Excellent (18 – Matrix) |
| Water and land management | -0.7% | -0.9% | -0.9% | -0.2pp | Excellent (18 – Matrix) |
Source: Workplace gender audit workforce data, 2021, 2023 and 2025.
Notes: To understand how to interpret the different types of progress ratings, see Data measures in Appendix 1. To read more about how the Commission calculates gender gaps, see Gender gaps in Appendix 1. Gender gaps are always calculated between men and women. A gap greater than zero is in favour of men, and a gap less than zero is in favour of women. The percentage point change column may not always reflect the exact difference between years due to rounding.
Table 5.3: Perceptions of fairness in recruitment trends
| Measure | 2021 | 2023 | 2025 | Percentage point change 2021–2025 | Progress |
|---|---|---|---|---|---|
| Proportion of women who believe recruitment processes are fair | 58.0% | 66.4% | 64.8% | +6.8pp | Moderate (11 – Matrix) |
| Proportion of men who believe recruitment processes are fair | 55.3% | 63.3% | 65.0% | +9.7pp | Moderate (11 – Matrix) |
| Proportion of people of self-described gender who believe recruitment processes are fair | 36.0% | 48.7% | 47.8% | +11.8pp | n/a |
Source: People matter survey data, 2021, 2023 and 2025.
Notes: To understand how to interpret the different types of progress ratings, see Data measures in Appendix 1. The percentage point change column may not always reflect the exact difference between years due to rounding.
Table 5.4: Career advancement satisfaction and barriers
| Measure | 2021 | 2023 | 2025 | Percentage point change 2021–2025 | Progress |
| Women satisfied with their career advancement | 39.3% | 36.5% | 42.3% | +3.0pp | Poor (7 – Matrix) |
| Men satisfied with their career advancement | 39.1% | 35.8% | 43.4% | +4.3pp | Moderate (10 – Matrix) |
| People of self-described gender satisfied with their career advancement | 24.3% | 23.8% | 28.2% | +3.9pp | n/a |
| Women experiencing barriers to career advancement7 | 27.7% | 27.3% | 27.4% | -0.3pp | Poor (7 – Matrix) |
| Men experiencing barriers to career advancement | 28.0% | 23.8% | 22.8% | -5.2pp | Moderate (10 – Matrix) |
| People of self-described gender experiencing barriers to career advancement | 51.8% | 52.8% | 56.4% | +4.7pp | n/a |
Source: People matter survey data, 2021, 2023 and 2025.
Notes: To understand how to interpret the different types of progress ratings, see Data measures in Appendix 1. The percentage point change column may not always reflect the exact difference between years due to rounding.
Signs of progress
Men and women were promoted at similar rates
Between 2021 and 2025, the Victorian public sector closed the small gender gap in promotions. In 2025 there was effectively no gap, with 8.2% of women and 8.3% of men promoted over a 12-month period. This indicates that, at the aggregate level, women and men were promoted at similar rates during the reporting period. It does not necessarily mean they had equal access to development opportunities or senior leadership positions.
Industry-level gaps were minor. The largest gap, in transport (2.8 percentage points in favour of women), is consistent with that industry’s sustained effort to attract, retain and promote women. To read more about the barriers and enablers to increasing women in transport in the Victorian context, see Ghalebeigi et al. (2022).
More employees of all genders believed that recruitment processes were fair
Between 2021 and 2025, perceptions of the fairness of recruitment processes improved across all genders. The proportion of men who believed recruitment processes in their organisation were fair increased by 9.7 percentage points (to 65.0%), while the proportion of women increased 6.8 percentage points (to 64.8%). The largest increase was among employees of self-described gender, up 11.8 percentage points (to 47.8%). Gender-diverse employees’ confidence, while improving, remains well below that of women and men.
These results show improved perceptions of fairness in recruitment and promotion practices. This is separate to material recruitment and promotion outcomes. The Commission’s data shows almost no gender difference in perceived fairness, but research suggests that perceptions of fairness can themselves be shaped by gendered expectations and organisational position. Men are more often socialised to expect rapid advancement and may rate their own prospects more highly than equally performing women (Adamecz-Völgyi and Shure 2022). Women concentrated at lower levels may simply have less visibility of how recruitment decisions are made, such as informal and behind-the-scenes factors that contribute to decision-making. Perceptions of fairness should not, therefore, be read as proof of equal opportunity or equal outcomes.
Satisfaction with career advancement increased for all genders
Women’s satisfaction with their career advancement rose to 42.3% in 2025 (from 39.3% in 2021) and men’s to 43.4% (from 39.1%). Gender-diverse employees saw similar growth (up 3.9 points to 28.2%) but remained substantially lower than for women and men.
These findings should be interpreted with caution. Job satisfaction measures how employees feel about their careers, not whether career opportunities and outcomes are equitable. High satisfaction can exist alongside unequal pay, limited progression opportunities and other forms of workplace inequality.
Research has identified several possible explanations for this disconnect, sometimes referred to as the ‘paradox of the contented female worker’. These include differences in what employees value at work, adaptation to workplace conditions, caring responsibilities, and differences in the expectations or reference points people use when assessing their careers (Walters 2005; Long 2005; Gerson et al. 2007; Aletraris 2010; Fleming and Kler 2014; Kifle et al. 2014; Zou 2015; Carvajal et al. 2021; Dockery and Buchler 2023). Research funded by the Commission also found that the flexibility offered in the Victorian public sector makes it an attractive workplace for many employees with caring responsibilities (Dangar et al. 2023).
For these reasons, satisfaction should not be interpreted as evidence that career opportunities or outcomes are equitable. Instead, it is one measure that should be considered alongside objective workforce data on recruitment, promotion and development opportunities, and reported barriers to career advancement.
Areas for attention
Men had more access to development opportunities
Access to development opportunities increased for all genders between 2023 and 2025 – by 9.6 percentage points for men, 7.2 for women and 0.8 for gender-diverse employees. Because access increased more for men than women, the gender gap in access to development opportunities widened by 2.4 percentage points in men’s favour. In 2025, men were almost 3 times as likely as gender diverse employees to access development opportunities, while women were around twice as likely.
This measure is only available from 2023, so it reflects a 2-year rather than a full 4-year change. Results for gender-diverse employees rest on a small number of respondents and should interpreted with caution. Even allowing for this, the substantial difference in access is a concern. Development opportunities are an important pathway to promotion, leadership and higher-paid roles. Unequal access therefore risks reinforcing inequalities in career progression and remuneration over time.
Gender-diverse employees faced markedly higher barriers to career advancement
The most concerning finding for this indicator relates to gender-diverse employees. In 2025, 56.4% reported barriers to career advancement. That’s more than twice the rate of men (22.8%). This figure rose by 4.7 percentage points since 2021, while reported barriers declined for men (down 5.2 percentage points) and held steady for women (27.4%).
This sits alongside some encouraging findings. Gender-diverse employees reported improved satisfaction with career advancement, and greater confidence in the fairness of recruitment processes between 2021 and 2025. However, these improvements were not matched by a reduction in reported barriers to career advancement. More than half of gender diverse employees reported barriers to getting ahead, and the gap between them and other employees widened.
Public sector employers need to understand the barriers facing gender-diverse employees and take deliberate action to remove them. Because gender-diverse employees have a small share of the workforce, the experiences behind these figures can be easy to overlook in organisation-level data. Careful analysis and targeted action are therefore essential to ensure career opportunities are equitable for employees of all genders.
Commissioner expectations
The Commissioner expects recruitment and promotion practices to be free from gender bias and discrimination, and to actively support gender balance at all levels of organisations and across occupations and industries.
Recruitment strategies should respond to an organisation’s current composition. Women-concentrated organisations should focus on attracting and retaining more men, and men-concentrated organisations on attracting and retaining more women. Organisations should also ensure recruitment does not reinforce existing segregation by disproportionately appointing one gender into senior or traditionally gendered roles. Reviewing job advertisements, role requirements and recruitment processes can help identify and remove unintended barriers.
The Commissioner expects duty holders to analyse promotion outcomes using pipeline analysis. This means assessing whether the gender composition at each level of the organisation reflects the level immediately below it and identifying where women or men are disproportionately dropping out of progression pathways. Where these ‘glass ceilings’ or ‘leaks’ exist, organisations should identify and address the structural barriers contributing to them (Chilazi et al. 2021).
The Commissioner is particularly concerned by the widened gap in access to development opportunities and the persistently high barriers to career advancement reported by gender-diverse employees. Development opportunities are a critical pathway to promotion and higher-paid roles. Duty holders should therefore monitor who is accessing these opportunities, investigate any disparities, and take action where access is unequal.
Because gender-diverse employees may represent a small proportion of the workforce, their experiences can be masked in organisation-level data. The Commissioner expects duty holders to analyse this data carefully, engage directly with gender-diverse employees where appropriate, and take deliberate action to identify and remove barriers to career progression. Progression pathways should be inclusive for employees of all genders.
Footnotes
- Development opportunities refer to employees who had one or more secondments, training opportunities or higher duties. This measure cannot be calculated for 2021 because these activities were reported on differently. As a result, comparisons are currently limited to 2023 and 2025 data.
- Progress ratings are not assigned here because the Commission does not collect data on the underlying promotional or developmental opportunities available in any given reporting period. It also does not collect information on who was eligible or who applied for them. It is therefore impossible to assess how many people of a given gender ‘should’ have been promoted or given access to development opportunities.
- This question from the People matter survey asks respondents ‘During the last 12 months in your current organisation, have you experienced any barriers to your success at work due to any of the following (Select all that apply)’. The response options include a range of personal attributes, such as ‘My race’ or ‘My disability’, as well as other common reasons for discrimination, such as ‘My industrial activity’.
- Measures in Table 5.1 are drawn from an analysis of responses to the People matter survey question ‘My workplace hires people fairly’. The Commission is working on the feasibility of developing a pipeline analysis to more concretely assess progress against this indicator. Pipeline analysis measures progress by comparing the gender composition of an organisation, disaggregated by organisational levels, over time. Seeing how many people of different genders move up through levels of seniority over time can help to assess gender equality in promotion and progression.
Indicator 6: Leave and flexibility
Why this matters
Who undertakes unpaid care is one of the biggest drivers of workplace gender inequality. Flexible work and leave entitlements, including parental leave, help Victorians of all genders balance paid work with caring and other responsibilities. But structural and cultural factors mean women continue to undertake a disproportionate share of unpaid care, particularly in heterosexual relationships. Increasing men’s uptake of flexible work and parental leave is therefore critical to achieving gender equality.
The Commission defines flexible work as an agreement initiated by an employee with their employer to work in a way that is outside the standard arrangement for that role. This can include things like working more hours over fewer days, flexible start and finish times or job-share arrangements. It is different to part-time work, which is a specific employment type. Read the full definition in the audit guidance. Access to supportive flexible work and leave is vital so that carers of all genders can stay and progress in paid work. It can improve quality of life and community participation and is particularly valuable for people with disability.
However, where uptake of leave and flexibility is heavily skewed by gender, these same arrangements can reinforce inequality rather than reduce it. For example, those working flexibly may be less visible to managers, or may be seen as less committed to their job. If these people are mostly women, it can lead to gender-unequal outcomes at work.
You can read more in the Baseline report (2021, pp. 83-84).
How we define progress
Parental leave and flexible work help employees balance paid work with family and other responsibilities, but it is overwhelmingly women who access them. When men take more parental leave and work more flexibly, they become more engaged in family and community life. In heterosexual relationships, men accessing leave and flexibility enables their women partners to participate more in paid work.
For this reason, the Commission assesses this indicator holistically, focusing mainly on whether men’s uptake is increasing, because increasing men’s uptake is the clearest indicator that unpaid care is becoming more equally shared. Changes in women’s uptake are harder to read. This is because increased use of flexible work and leave by women can signal better organisational support (and may help some women move from part-time to full-time work where they wish), but it can also signal a widening gap in who carries unpaid care at home. The Commission therefore considers whether more men are working flexibly or taking parental leave, whether men are taking longer parental leave on average, whether gender gaps are closing, and any significant shifts in women’s access. Gender-disaggregated survey data further reveals how perceptions of leave and flexibility differ by gender.
Progress between 2021 and 2025
The data shows encouraging shifts in workplace flexibility and care arrangements. Between 2021 and 2025, men’s uptake of flexible work increased more than women’s. Both women and men had greater access to carer’s leave in 2025. Most industries achieved increases in the amount of parental leave taken by men, with the most significant increases in:
- community and cultural services
- universities
- TAFE and other education
- transport
- local government.
These trends are important because sustainable gender equality requires not only increased participation of women in leadership and higher-paid roles, but also more equal participation of men in unpaid care.
However, the picture here is mixed. Across the sector as a whole, the average duration of men’s parental leave fell between 2023 and 2025. At the same time, women’s leave duration increased, widening the gap in who takes time out to care. This is despite more supportive entitlements for all parents in many enterprise agreements and policies. It is clear that policy settings alone are insufficient to change behaviour, and that cultural and behavioural barriers continue to influence who takes primary responsibility for care. Given that most industries improved men’s uptake of parental leave, the overall drop in the duration of men’s leave suggests that the sector-wide decline is heavily influenced by large falls in a few big industries (see table 6.4 for the average duration of men’s parental leave by industry).
Because these patterns persist, increasing men’s uptake of parental leave will now be one of the Commissioner’s regulatory priorities.
Key data measures are presented in Tables 6.1 to 6.4. Findings are discussed in further detail after the tables.
Table 6.1: Uptake of flexible work
| Arrangement type | 2021 | 2023 | 2025 | Change 2021-2025 | Progress |
|---|---|---|---|---|---|
| Women’s uptake of flexible work | 23.7% | 22.0% | 27.1% | +3.4pp | Moderate (Holistic) |
| Men’s uptake of flexible work | 14.9% | 15.7% | 19.6% | +4.7pp | |
| Gender gap in uptake of flexible work | -8.8% | -6.3% | -7.4% | +1.4pp | |
| Women’s workplace flexibility support index (score out of 5) | 3.9 | 4.1 | 4.2 | +0.2 | Excellent (18 – Matrix) |
| Men’s workplace flexibility support index (score out of 5) | 3.9 | 4.1 | 4.2 | +0.2 | Excellent (18 – Matrix) |
| Workplace flexibility support index for people of self-described gender (score out of 5) | 3.6 | 3.8 | 3.9 | +0.3 | n/a |
Source: Workplace gender audit workforce data, 2021, 2023 and 2025.People matter survey data, 2021, 2023 and 2025.
Notes: To understand how to interpret the different types of progress ratings, see Data measures in Appendix 1. To read more about how the Commission calculates gender gaps, see Gender gaps in Appendix 1. Gender gaps are always calculated between men and women. A gap greater than zero is in favour of men, and a gap less than zero is in favour of women. The workplace flexibility support index figure brings together 3 questions from the People matter survey: ‘I am confident that if I requested a flexible work arrangement, it would be given due consideration’; ‘My organisation would support me if I needed to take family violence leave’; and ‘My direct line manager supports working flexibly’. It is measured on a 5-point scale. The change column may not always reflect the exact difference between years due to rounding.
Table 6.2: Gender gap in flexible work by industry
| Industry | 2021 | 2023 | 2025 | Percentage point change 2021-2025 |
|---|---|---|---|---|
| Community and cultural services | -11.5 % | -9.2% | -8.2% | +3.3pp |
| Finance and insurance | -5.5% | -23.9% | -15.6% | -10.1pp |
| Local government | +0.2% | -2.2% | -2.2% | -2.4pp |
| Other | -6.9% | -1.8% | -2.4% | +4.5pp |
| Police and emergency services | -44.7% | -16.5% | -19.8% | +24.9pp |
| Public health care | -1.6% | -1.8% | -0.7% | +0.9pp |
| TAFE and other education | -6.8% | -7.9% | -8.6% | -1.8pp |
| Transport | -1.7% | -5.5% | -8.0% | -6.3pp |
| Universities | -10.4% | -2.8% | -2.3% | +8.1pp |
| Victorian Public Service | -18.9% | -21.2% | -21.5% | -2.6pp |
| Water and land management | -3.9% | -15.9% | -15.2% | -11.4pp |
Source: Workplace gender audit workforce data, 2021, 2023 and 2025.
Notes: To read more about how the Commission calculates gender gaps, see Gender gaps in Appendix 1. Gender gaps are always calculated between men and women. A gap greater than zero is in favour of men, and a gap less than zero is in favour of women. The percentage point change column may not always reflect the exact difference between years due to rounding.
Table 6.3: Parental and carers leave trends
| Measure | 2021 | 2023 | 2025 | Change 2021-2025 | Progress |
|---|---|---|---|---|---|
| Average parental leave taken by women (weeks) | n/a | 25.7 | 27.0 | +1.2 | Poor (Holistic) |
| Average parental leave taken by men (weeks) | n/a | 7.4 | 5.7 | -1.8 | |
| Gender gap in average weeks of parental leave taken | n/a | -71.1% | -78.9% | -7.9pp | |
| Women accessing carer’s leave | 29.9% | 33.5% | 38.4% | +8.5pp | n/a |
| Men accessing carer’s leave | 27.9% | 30.9% | 34.2% | +6.3pp | n/a |
Source: Workplace gender audit workforce data, 2021, 2023 and 2025.
Notes: 2021 parental leave data is excluded from this analysis because of inconsistencies in how data was captured and reported across organisations in that reporting year. To support comparability and consistency of analysis, parental leave insights are based on 2023 and 2025 data only. To understand how to interpret the different types of progress ratings, see Data measures in Appendix 1. To read more about how the Commission calculates gender gaps, see Gender gaps in Appendix 1. Gender gaps are always calculated between men and women. A gap greater than zero is in favour of men, and a gap less than zero is in favour of women. The change column may not always reflect the exact difference between years due to rounding.
Table 6.4: Men’s average weeks of parental leave by industry
| Industry | 2023 | 2025 | Number of weeks change 2023-2025 |
|---|---|---|---|
| Community and cultural services | 4.3 | 8.5 | +4.2 weeks |
| Finance and insurance | 7.9 | 6.2 | -1.7 weeks |
| Local government | 6.2 | 7.3 | +1.1 weeks |
| Other | 7.4 | 6.0 | -1.4 weeks |
| Police and emergency services | 8.0 | 1.8 | -6.2 weeks |
| Public health care | 12.3 | 4.4 | -7.9 weeks |
| TAFE and other education | 2.6 | 4.7 | +2.1 weeks |
| Transport | 3.1 | 5.0 | +1.8 weeks |
| Universities | 4.7 | 8.3 | +3.6 weeks |
| Victorian Public Service | 5.6 | 5.5 | -0.1 weeks |
| Water and land management | 5.0 | 8.6 | +3.6 weeks |
Source: Workplace gender audit workforce data, 2021, 2023 and 2025.
Notes: The number of weeks change column may not always reflect the exact difference between years due to rounding.
Signs of progress
Industry breakdowns showed positive trends in parental leave
Men’s uptake of parental leave improved across 6 out of 11 industries between 2023 and 2025. The greatest increase was in community and cultural services, where the average duration of men’s parental leave increased by 4.2 weeks. This was followed by water and land management and universities, where men’s uptake increased by 3.6 weeks. Other improvements were achieved in TAFE and other education (up 2.1 weeks), transport (up 1.8 weeks), and local government (up 1.1 weeks).
Industries where men’s uptake of parental leave declined significantly between 2023 and 2025 include:
- public health care (-7.9 weeks)
- police and emergency services (-6.2 weeks).
These mixed results show that meaningful increases in men’s leave-taking are achievable and are already happening in much of the sector. The task is to understand why some large industries moved sharply in the other direction, and to spread the conditions that are working elsewhere.
More men worked flexibly, narrowing the gender gap
Men’s uptake of flexible work increased to 19.6% in 2025 (up 4.7 percentage points since 2021). Women’s increased to 27.1% (up 3.4 points). This narrowed the gender gap in flexible work. The Commission gave flexible work a holistic rating of ‘moderate’, because both groups increased their uptake, men’s grew more, and the gap is closing.
This is a more meaningful marker of progress than it might first appear. Higher flexible work uptake among women supports their workforce participation, but men’s uptake is the clearer signal of structural change. This is because it suggests men are taking on more of the responsibility for care and domestic life (see, for example, Eikhof 2012; Elson 2017).
More women and men accessed carer’s leave
The proportion of both women and men using carer’s leave grew between 2021 and 2025 to 38.4% of women (up 8.5 points) and 34.2% of men (up 6.3 points). Further research is needed to understand the gendered dynamics: the data shows who took carer’s leave over a 12-month period, but not how often or for how long.9 As with parental leave, the duration of leave taken is a crucial marker of equality in caring and is the more revealing measure.
Satisfaction with access to flexible work increased for all genders
The ‘workplace flexibility support index’ brings together several measures from the employee experience survey data that relate to working flexibly.10 The index is measured on a 5-point scale, with anything above 4 classed as within the ideal range. A score of 4 or 5 correlates to an answer of ‘agree’ or ‘strongly agree’ to the positive statements about flexible work in the survey.
In 2025, the workplace flexibility support index was 4.2 for both women and men, up 0.2 since 2021. Gender diverse employees’ satisfaction rose 0.3 over the same period to 3.9.
While the workplace flexibility support index results are positive, duty holders should not be complacent. Some public sector roles cannot be performed from home, and for frontline and client-facing work employers need to find other ways to offer flexibility. Sustaining and broadening access so flexibility is genuinely available across all roles and levels, not only those easily done remotely, remains important.
Areas for attention
The whole-of-sector gap in the duration of women’s and men’s parental leave increased
At the sector level, the average duration of parental leave taken by men fell between 2023 and 2025. At the same time, women’s rose slightly. This resulted in a wider gender gap. The scale of the imbalance is stark. For every week of parental leave women took in 2023, men took around a third of a week. By 2025, this fell to around a fifth of a week.
This decline came despite more supportive parental leave provisions in many enterprise agreements and policies. For example, recent years have seen a national focus on encouraging parents of all genders to take parental leave, alongside a marked improvement in government-funded parental leave provisions (Prime Minister and Cabinet 2024). In addition, the most recent Victorian Public Service enterprise agreement included improved parental leave provisions. When entitlements improve but men’s uptake falls, the barrier is cultural rather than structural. Men are not taking leave that is increasingly available to them. The Commission assigned a holistic rating of ‘poor’ to parental leave, reflecting both the fall in men’s uptake and the widening gender gap. Given this, parental leave will now be one of the Commissioner’s regulatory priorities.
The sector-level fall in men’s uptake of parental leave is heavily shaped by large declines in a few major industries. Most notably, this included public health care (down 7.9 weeks) and police and emergency services (down 6.2 weeks). Because public health care is one of the largest industries in the sector, a change there can move the whole-of-sector figure substantially.
At the industry level, changes to the gender gap in flexible work were mixed
At the whole-of-sector level the gender gap in flexible work narrowed slightly, but industry results were mixed. The headline results therefore need careful interpretation. In 5 of 11 industries, the gap narrowed. The largest apparent reduction, in police and emergency services (where the gap narrowed by 24.9 percentage points), was driven mainly by a fall in women’s uptake rather than a rise in men’s uptake of flexible work. This means the result should not be read as straightforward progress.
By contrast, in water and land management, and finance and insurance, the gap widened in favour of women. Yet these industries also recorded the strongest growth in men’s uptake (up 20.7 and 19.3 percentage points respectively). The gap widened only because women’s uptake grew even more (up 32.1 and 29.4 percentage points). This illustrates why the gap alone must be interpreted with care. The same direction of movement can reflect either progress or its opposite, depending on what is driving it.
Commissioner expectations
Reducing gender inequality cannot rely solely on supporting women to participate more equally in paid work. It also requires workplaces where men are expected, supported and encouraged to take on a greater share of unpaid care.
The Commissioner expects duty holders to increase men’s uptake and duration of parental leave, and to build workplace cultures that genuinely support flexible work and leave-taking for people of all genders. Taking parental leave, carer’s leave or working flexibly should never be a barrier to career progression, leadership opportunities or access to development.
Culture is the key lever, particularly for parental leave. Where entitlements have improved but men’s uptake has fallen, the barrier lies in workplace, cultural and behavioural norms, not policy. Men taking parental leave should be normal, visible and actively encouraged at every level of the organisation, including among senior leaders who set the tone. Removing primary/secondary carer distinctions from parental leave policies and enterprise agreements is one practical step that supports a more equal division of care.
Organisations should monitor gender differences in the uptake of flexible work and leave and interpret these patterns carefully. Narrowing gender gaps can reflect increased uptake by men, but they can also result from reduced access for women. Organisations should therefore ensure flexible work is genuinely available, supported and visible across all roles and levels.
For frontline and client-facing roles, duty holders should design flexible work arrangements that respond to operational requirements while meeting the needs of their workforce. Options may include flexible hours, job sharing and other innovative models. Above all, people of all genders who work flexibly or take leave must have the same opportunities to develop their careers. This is essential if organisations are to retain talent, reduce gender inequality and ensure employees of all genders can participate fully in both paid work and unpaid care.
Footnotes
- The Commission has funded research to better understand the gendered experiences of caring in the Victorian public sector (see Dangar 2023). The project highlighted the continuing gendered nature of care work and how it affects career trajectories. It also emphasised that groups facing intersecting inequalities have higher rates of caring responsibilities. The researchers advocated for organisations to collect workforce data which captures the diversity of caregiving leave-taking patterns among staff.
- The index brings together 3 questions from the employee experience survey data: ‘I am confident that if I requested a flexible work arrangement, it would be given due consideration’, ‘My organisation would support me if I needed to take family violence leave’, and ‘My direct line manager supports working flexibly’.
Indicator 7: Gendered segregation
Why this matters
Women make up a higher proportion of some occupations and industries, while men are concentrated in others. This is gendered segregation. It operates in two directions: horizontally, across occupations and industries, and vertically, where women and men are concentrated at different levels of seniority within organisations. The problem of vertical gendered segregation, where men are more likely to work in senior leadership while women are concentrated in junior roles, is discussed further under Indicator 1: Gender composition of the workforce.
Gendered segregation is a major driver of workplace gender inequality. It shapes who does particular types of work, who progresses into leadership, who has access to higher-paid occupations and industries. It is reinforced by gender stereotypes about who is suited to particular work, unequal caring responsibilities, limited access to flexible work, bias against people working in non-traditional roles (such as women in men-concentrated occupations), and intersecting forms of discrimination.
Gendered segregation is a key driver of the gender pay gap. Pay tends to be lower in women-concentrated industries and occupations, such as health care and education, and higher in men-concentrated ones, which are often more highly valued. It also entrenches unequal divisions of paid and unpaid work. Because women are more often paid less, heterosexual couples tend to fall back into traditional breadwinner and homemaker roles.
This is one of the hardest forms of gender inequality to shift, because the social and gender norms that shape it are formed early in life. They influence educational choices and career pipelines long before people enter the workforce. Organisations can contribute to change, but they are one part of a much larger picture.
You can read more about how gendered segregation perpetuates gender inequality in the Baseline report (2021, pp. 22-23).
How we define progress
Gendered occupational segregation exists when men and women are clustered in different roles. Progress means moving towards gender balance across all occupations and industries over time. The Commission defines balance using a 45:45:10 framework (45% women, 45% men, 10% any gender). As this is a goal of balance, it is not about changing the representation of any one group for its own sake.
The Victorian public sector is women-concentrated overall and so needs to move towards greater balance. But at the industry and occupational level, the picture varies widely, with some workforces highly men-concentrated. Certain fields have long been understood as ‘men’s’ or ‘women’s’ work: public health care and education are women-concentrated, while police and emergency services are men-concentrated.
The Commission uses ANZSCO codes (Australian and New Zealand Standard Classification of Occupations) to report on occupations. ANZSCO codes are the skill-based classification system used by Australian and New Zealand governments (ABS 2022). These codes offer a widely accepted and familiar standard for duty holders reporting under the Act. They also enable comparison between the Commission’s data and other Australian datasets.11
The Commission also considers gendered segregation at the industry level. To see a breakdown of duty holders by industry, see Appendix 2.
Gendered segregation is a persistent feature of the whole Australian labour market (JSA 2025), because rigid gender norms shape behaviour from early childhood through education and training and into the jobs people pursue. For this reason, some of the most effective levers for change sit beyond any single employer, resting with governments, peak bodies and the education and training system. These operate alongside the actions duty holders can take themselves, set out in the Commissioner expectations below.
Progress between 2021 and 2025
Progress on gendered segregation was gradual and uneven. There were genuine signs of progress in some traditionally men-concentrated areas. More women were working as machinery operators and drivers, in technical and trades roles, and in management. The transport industry shifted from ‘highly’ to ‘moderately’ men-concentrated. These changes matter, because gendered segregation is both a major driver of the gender pay gap and notoriously slow to change.
At the same time, most occupations remained either men- or women-concentrated, and the overall distribution did not move towards balance. As discussed below, the share of occupations classified as ‘balanced’ fell over the period. While this finding needs careful interpretation, it underlines that the sector is some way from gender-balanced occupations and industries.
Key data measures are presented in Tables 7.1 to 7.3. Findings are discussed in further detail after the tables.
Table 7.1: Occupational segregation trends by gender (women) – ANZSCO categories
| Occupation | 2021 | 2023 | 2025 | Percentage point change 2021-2025 | Classification change |
|---|---|---|---|---|---|
| Clerical and administrative | 73.7% | 72.7% | 72.9% | -0.8pp | No change – Moderately women-concentrated |
| Community and personal service | 62.2% | 63.0% | 63.8% | +1.6pp | No change – Slightly women-concentrated |
| Labourers | 51.1% | 51.3% | 51.7% | +0.6pp | No change – Gender balanced |
| Machinery operators and drivers | 10.6% | 15.4% | 16.9% | +6.3pp | No change – Highly men-concentrated |
| Managers | 52.5% | 54.8% | 55.9% | +3.4pp | More segregation – Slightly women-concentrated |
| Professionals | 70.2% | 70.1% | 69.5% | -0.7pp | No change – Moderately women-concentrated |
| Sales workers | 52.8% | 56.3% | 56.6% | +3.8pp | More segregation – Slightly women-concentrated |
| Technicians and trades | 38.8% | 40.2% | 40.9% | +2.1pp | No change – Slightly men-concentrated |
Source: Workplace gender audit workforce data, 2021, 2023 and 2025.
Notes: To understand how to interpret the different types of progress ratings, see Data measures in Appendix 1. The percentage point change column may not always reflect the exact difference between years due to rounding.
Table 7.2: Occupational balance trends
| Segregation Category | 2021 | 2023 | 2025 | Percentage point change 2021-2025 |
|---|---|---|---|---|
| Balanced occupations (45-55%) | 37.5% | 25.0% | 12.5% | -25.0pp |
| Men-concentrated (>55% men) | 25.0% | 25.0% | 25.0% | 0.0pp |
| Women-concentrated (>55% women) | 37.5% | 50.0% | 62.5% | +25.0pp |
Source: Workplace gender audit workforce data, 2021, 2023 and 2025.
Notes: To understand how to interpret the different types of progress ratings, see Data measures in Appendix 1. The percentage point change column may not always reflect the exact difference between years due to rounding.
Table 7.3: Industry segregation trends by gender (women)
| Industry | 2021 | 2023 | 2025 | Percentage point change 2021-2025 | Current tatus |
|---|---|---|---|---|---|
| Community and cultural services | 59.7% | 59.0% | 61.6% | +1.9pp | No change – Slightly women-concentrated |
| Finance and insurance | 61.3% | 62.9% | 64.3% | +3.0pp | No change – Slightly women-concentrated |
| Local government | 63.0% | 62.5% | 61.7% | -1.2pp | No change – Slightly women-concentrated |
| Other | 45.7% | 48.3% | 48.8% | +3.1pp | No change – Gender balanced |
| Police and emergency services | 36.4% | 38.0% | 38.2% | +1.7pp | No change - Slightly men-concentrated |
| Public health care | 78.2% | 77.4% | 77.1% | -1.0pp | No change – Highly women-concentrated |
| TAFE and other education | 59.7% | 60.0% | 60.0% | +0.3pp | No change – Slightly women-concentrated |
| Transport | 24.4% | 27.3% | 29.4% | +4.9pp | Less segregation – Moderately men-concentrated |
| Universities | 58.1% | 59.3% | 59.6% | +1.5pp | No change – Slightly women-concentrated |
| Victorian Public Service | 69.7% | 69.7% | 69.5% | -0.2pp | No change – Moderately women-concentrated |
| Water and land management | 41.0% | 43.0% | 42.9% | +1.9pp | No change – Slightly men-concentrated |
Source: Workplace gender audit workforce data, 2021, 2023 and 2025.
Notes: To understand how to interpret the different types of progress ratings, see Data measures in Appendix 1. The percentage point change column may not always reflect the exact difference between years due to rounding.
Signs of progress
More women worked in traditionally men-concentrated occupations
There was improvement in some traditionally men-concentrated occupations, where women’s representation rose:
- machinery operators and drivers (16.9%, up 6.3 percentage points)
- technicians and trades workers (40.9%, up 2.1 percentage points)
- labourers (51.7%, up 0.6 percentage points).
These increases did not always shift an occupation’s overall classification. Machinery operators and drivers, for instance, remain highly men-concentrated despite the largest single rise. Some changes are built on smaller workforce numbers, so should be read as early movement rather than transformation. Even so, growing participation by women in traditionally masculine roles is an encouraging result.
More women worked in transport, finance and insurance
Transport shifted from a ‘highly’ to ‘moderately’ men-concentrated industry. This represents meaningful progress in a traditionally men-concentrated industry and is consistent with the sector’s sustained effort to support women into transport careers (see Ghalebeigi et al.). In finance and insurance, women’s representation rose by 3 percentage points. While this part of the public sector is not highly men-concentrated, the broader finance and insurance industry traditionally has been. Increased representation of women in this part of the public sector therefore represents positive progress towards greater gender balance.
Women’s representation in management continued to grow
Women’s representation in management increased from 52.5% in 2021 to 55.9% in 2025 (up 3.4 percentage points). Given management roles are traditionally men-concentrated, this increase points to improving access to management for women. This reduction in vertical gendered segregation matters, as progress in who leads organisations is as important as progress in who works in particular occupations and industries. The shift in the gender composition of managers tipped this occupation into the slightly women-concentrated category. This is because more than 55% of employees in this group are women, outside the 45:45:10 threshold. Although managers are now classified as slightly women-concentrated, this reflects women reaching a share of management that is closer to their representation in the public sector workforce, not an overconcentration of women in leadership.
Areas for attention
Most occupations remained gender concentrated
Despite encouraging movement in some men-concentrated occupations, gendered segregation remains entrenched across the Victorian public sector. In 2025, 7 of 8 occupations were gender-concentrated (5 women-concentrated, 2 men-concentrated). Six occupational groups remained in the same category as in 2021.
At first glance, the distribution of occupational groups appears to have become more gender segregated. The share of occupations classified as ‘balanced’ fell from 37.5% to 12.5% over the period, while the women-concentrated share rose correspondingly. However, it is worth considering this shift in context. The occupations that changed category (managers and sales workers) shifted from ‘balanced’ into ‘slightly women-concentrated’ as women’s representation grew. In the case of managers, that movement is towards women gaining ground in a traditionally male-concentrated, higher-status occupation. This is a positive development, even though it registers as ‘more segregation’. Because sales workers form the smallest occupation group in the dataset (around 1,200 of close to 500,000 sector employees) relatively small workforce changes can move it between categories, and it is prone to fluctuation between reporting years.
There have been small shifts in the distribution of occupations across categories. Importantly though, the sector has not become meaningfully more segregated in a way that disadvantages women. But nor has it moved towards balance. With only 8 occupational categories, each shift moves the percentages substantially. This is why the occupation-level distribution should be read alongside the more granular industry and occupation data rather than on its own.
While gendered segregation remains deeply entrenched, a small number of encouraging shifts are underway. Achieving a more gender-balanced workforce will require sustained action across education, career pathways, workplaces, industries and government, extending well beyond the influence of any single employer.
Commissioner expectations
The Commissioner expects duty holders to make sustained, deliberate efforts to reduce gendered segregation. It is one of the most persistent forms of workplace gender inequality, shaped by social norms and stereotypes that develop over a lifetime. Progress will take time, but organisations are not powerless to influence it.
Smaller duty holders should look for ways to act collectively at the industry level to recruit and retain underrepresented genders. This may involve working with similar organisations or peak bodies, schools, TAFEs and other education providers to strengthen talent pipelines and encourage people into non-traditional careers from an early stage. Larger organisations may may be able to invest directly in targeted pathways, traineeships, mentoring, scholarships and networks that support more gender-balanced recruitment over time.
Within their own workforces, duty holders should focus on attracting and retaining underrepresented genders into specific occupations, roles, and areas. This includes building internal pathways through upskilling, job-shadowing and development opportunities, and critically reviewing role requirements that act as unnecessary barriers for a particular gender. Organisations should also consider where skills can be developed on the job or through traineeships rather than requiring prior experience. Gendered imagery and language are not the whole story, but they are powerful signals of who belongs in a role or industry. Recruitment campaigns and internal and public communications should show people of different genders across the full range of roles.
Many of the strongest levers on gendered segregation lie beyond the control of any single employer – including the education system, occupational pipelines and broader social norms. However, organisations still have significant influence over who they recruit, develop, promote and retain. The Commissioner therefore expects duty holders to use every lever available to them while working collaboratively with governments, education providers, industry bodies and other employers to achieve lasting change.
Footnotes
- ANZSCO codes have been critiqued for being insensitive to gender equality issues and perpetuating the undervaluation of women’s work (Risse 2025). In acknowledgement of these issues, and to better reflect the differences between Australian and New Zealand workforces, Australia is shifting to the OSCA (Occupation Standard Classification for Australia) framework (ABS 2024).
Appendix 1: Data and methods
About our data
This report uses data from duty holders’ 2021, 2023 and 2025 workplace gender audits. Under the Gender Equality Act, duty holders must submit workplace gender audits to the Commissioner every 2 years. This is part of their requirement to develop gender equality action plans and report on progress.
Duty holders submit audit data for 7 workplace gender equality indicators:
- gender composition at all levels of the workforce
- gender composition of governing bodies
- gender pay gap
- sexual harassment in the workplace
- recruitment and promotion practices
- leave and flexibility
- gendered segregation within the workplace.
Duty holders must collect gender-disaggregated data. This is data that is broken down separately for women, men and gender diverse people. If available, duty holders are also required to report demographic data about:
- Aboriginality
- age
- disability
- ethnicity
- gender identity
- race
- religion
- sexual orientation.
Duty holders must analyse this demographic data and take steps to address any intersecting forms of disadvantage or discrimination that a person may experience. The Act conveys this requirement through the language of ‘compounded inequality.’ You can read more about how the Commission collects and analyses demographic data in the Intersectionality section below. Intersectionality at work (2023) also provides further advice about collecting and analysing demographic data with an intersectional lens.
Data types
The Commission holds 3 types of data, all of which have been used to create this report. These are aggregated workforce data, unit-level workforce data and unit-level employee experience data. Each is described below.
Aggregated workforce data
Workforce data is collected from organisations’ payroll and HR systems. Aggregated workforce data is data that the duty holder has grouped together before submitting. This data mainly consists of headcounts. For example, an organisation may have provided the total number of women working full time at the most junior level of the organisation. The Commission used this type of data for the 2021 audit, where 177 organisations met quality standards.
You can read more about the aggregated workforce data used in 2021 in the Baseline report (2021).
Unit-level workforce data
From 2023 onwards, duty holders submitted de-identified individual employee data extracted from payroll and HR systems. This data provides a range of information about each employee in an organisation, which makes it easier to calculate a variety of data measures. In the 2023 audit, 257 organisations met quality standards. In the 2025 audit, 298 organisations met quality standards. The number of organisations whose data was used to calculate each individual measure in this report varies. This is because an organisation may provide data that meets quality standards for some measures, but not others. Submitting this kind of data was optional in 2021.
Unit-level employee experience data
This type of data is collected through surveys and is used across all reporting years. Duty holders have 3 options to collect employee experience data:
- undertake the annual People matter survey or the shorter People matter survey for gender equality reporting (collectively referred to in this report as the People matter survey). The People matter survey is administered by the Victorian Public Sector Commission (VPSC)
- use a third-party provider to independently administer the survey
- conduct the survey in-house.
In this report, only People matter survey data is used to calculate survey results. This is because duty holders who do not use the People matter survey do not submit raw data to the Commission, limiting the analysis that is possible. In every reporting year, around 90% of duty holders use the People matter survey to provide employee experience data for their workplace gender audit. This means People matter survey results are broadly representative of the sector. People matter survey data in this report uses anonymous individual data from participating duty holders. This includes:
- 2021 data from 106,069 people across 271 organisations
- 2023 data from 131,852 people across 276 organisations
- 2025 data from 114,396 people across 281 organisations.
It is important to note 3 things in relation to the People matter survey.
First, because so many public sector employees take the survey, small percentage changes can mean a large number of people have experienced a change.
Second, VPSC administers the People matter survey, not the Commission. The Commission works with VPSC to include the questions required by the Commission for audits. VPSC then provides the Commission with raw data from each participating duty holder. This means that the Commission’s results database includes individual responses to the required workplace gender audit questions. For the Baseline report (2021), the Commission did not have access to the raw data for all duty holders. This is because VPSC initially reported the results to the Commission as a percentage of respondents. Items with fewer than 10 responses were suppressed by the survey provider to protect respondents’ privacy. In late 2022, the Commission received the unit level individual data. The Commission has used this raw People matter survey data for analysis in all insights reporting since the Baseline report. Raw People matter survey data allows the Commission to calculate percentages for different groups across the whole dataset.
Finally, the Commission’s People matter survey dataset is a different sample to that used by VPSC. VPSC’s reporting of People matter survey results does not include local government organisations, universities or library corporations. It does, however, include public sector organisations with fewer than 50 employees that are not duty holders under the Act. These differences can lead to discrepancies between analysis from VPSC and the Commission.
For more information on how the Commission uses the People matter survey to produce data insights, see the methodology section of Intersectionality at work (2023).
Intersectionality
Intersectionality seeks to reveal how discriminatory systems such as sexism, racism, classism and ableism interact to produce new forms of inequality. The Commission focuses specifically on intersectional gender inequality. This is where gender inequality intersects with other forms of inequality to produce unique forms of discrimination.
The Act requires that, where possible, duty holders should collect data about additional forms of disadvantage or discrimination that a person may experience based on:
- Aboriginality
- age
- disability
- ethnicity
- gender identity
- race
- religion
- sexual orientation
- other attributes.
The Act requires duty holders to use this data to consider how gender inequality may be compounded. Duty holders must then use this data to drive positive and transparent progress towards intersectional gender equality.
Intersectionality focuses on the systems and structures that create and sustain inequality. You can read more about intersectionality, including how to measure and apply it, in the Intersectionality at work report (2023).
The Commission adopts a ‘gender-plus-one-other-attribute’ approach to intersectional analysis. This approach offers a practical starting point for exposing previously hidden patterns of intersectional inequality. However, it is not the final goal. As the Victorian public sector improves its ability to collect demographic data, we will also be able to analyse more complex data combinations that better reflect the experiences of all Victorians.
As was the case in 2021 and 2023, only a small proportion of duty holders returned reliable demographic data beyond gender and age in 2025. Because of this, the Commission relies on anonymous People matter survey data to analyse experiences of intersectional inequality.
This report offers intersectional analysis for 2 workplace gender equality indicators: gender pay gaps and sexual harassment. Gender pay gaps and sexual harassment are regulatory focus areas for the Commissioner. Both continue to be the cause of the most significant and persistent gendered harms. They also offer the greatest opportunity for meaningful and systemic change.
The Commission has not assigned progress ratings to measures with an intersectional lens due to complexities in the data and inconsistent reporting.
Data measures
In the 2021 Baseline report and the 2023 Intersectionality at work report, the Commission established the baseline for intersectional gender inequality in the Victorian public sector. This current report publishes a suite of measures to track progress towards a more gender equal Victoria over time.
Five years into the implementation of the Act, the Commission can now provide more detailed information about:
- what good progress looks like against measures under each workplace gender equality indicator
- how to best measure progress at industry and sector levels.
To arrive at the suite of data measures presented in this report, and produce their corresponding progress ratings (where relevant), the Commission:
- undertook an extensive review of local and international literature, conducted internal consultation, and commissioned expert advice from Associate Professor Leonora Risse
- assessed which datapoints collected under the workplace gender audit are the most meaningful to understand the state of gender (in)equality against each workplace gender equality indicator
- considered how progress could be rigorously assessed for each measure across multiple audit years.
Understanding what ‘good’ looks like on each data measure and how to interpret changes in the data as evidence of progress is a complex process. It involves first determining what the numerical gender equality ‘goal’ is on each measure. It then involves identifying whether changes in that measure can be understood as ‘positive’ for gender equality, based on the direction and size of the change. Overall, the Commission designed 4 types of progress ratings. These include matrix ratings, holistic ratings, proportionality ratings and gender-composition ratings.
Duty holders can use these measures to track their progress against their industry group to understand how their performance aligns or deviates from industry averages. However, it is important to note that measures at the industry and sector level do not always meaningfully translate at the organisational level. Duty holders should consult the Commission’s progress reporting guidance when seeking to assess organisational progress.
Gender gaps
This report presents several ‘gender gap’ measures to reveal structural inequalities. The most familiar of these will be the gender pay gap measure. These measures are calculated differently depending on the type of data being reported. For measures where women’s or men’s experience sits along a spectrum (for example, pay, or weeks of parental leave taken), the Commission calculated the difference between the average for men and women (for example, average earnings or average weeks of parental leave). This outcome was then divided by men’s average (earnings or parental leave) and expressed as a percentage.
A different approach is used for measures based on proportions. These measures compare the proportion of women with the proportion of men who experience, access or participate in a particular workplace arrangement or opportunity. Examples include:
- the uptake of part-time work
- promotion rates
- access to development opportunities
- the uptake of flexible work.
For these measures, the gender gap is expressed as the percentage point difference between men and women.
Values greater than zero indicate that men have the more favourable outcome for the measure being reported (that is, they are promoted at a greater rate, or are paid more), while values less than zero indicate that women have the more favourable outcome.
Matrix ratings
The Commission developed matrices to assign progress ratings for most measures. Three types of matrixes are used in this report to assess progress on three different types of data measure:
- Matrix 1: Gender composition ratings. Used to assess progress on measures that look at the gender split of a population. This includes, for example, changes in overall gender composition at sector and industry levels.
- Matrix 2: Directional change ratings. Used to assess directional change against measures such as the sexual harassment occurrence and reporting rates, perceptions of fairness in recruitment, and promotion rates.
- Matrix 3: Gender gap ratings. Used to assess whether gender gaps are narrowing or widening.
Each type of matrix was designed to rate both the movement (the degree of change over time, or how far an industry or the sector has moved towards or away from gender equality) and the overall performance (the final landing position in 2025).
The matrices calculate the degree of change over each 2-year reporting period. This means that the 4-year percentage point change presented in the Tables in the report is divided by 2 before being entered into the matrix.
Below, each matrix cell provides further information about how to interpret progress scores. Each cell includes:
- The overall assessment (Excellent – Moderate – Poor – Very poor)
- The movement assessment (Substantial progress – Good progress – Stable – Stagnant – Slight decline – Worsening)
- The performance assessment (Equality achieved – Equality maintained – On track – Not on track)
- The numerical assessment (1 – 20).
Matrix 1 – Gender composition ratings
| Matrix 1: Gender composition ratings | Performance scale | ||||
| Within gender-balanced range (Specific to measure) | Some distance from gender-balanced range (Specific to measure) | Moderate distance from gender-balanced range (Specific to measure) | Large distance from gender-balanced range (Specific to measure) | ||
| Movement scale | 5 percentage points or more in direction of optimal outcome | Excellent Substantial progress – Equality achieved (20) | Moderate Substantial progress – On track (15) | Moderate Substantial progress – On track (14) | Moderate Substantial progress – On track (13) |
| Between 2 and 5 percentage points in direction of optimal outcome | Excellent Good progress – Equality achieved (19) | Moderate Good progress – On track (12) | Moderate Good progress – On track (11) | Moderate Good progress – On track (10) | |
| Less than 2 percentage points in either direction of optimal outcome | Excellent Stable - Equality maintained (18) | Moderate Stable (9) | Poor Stagnant – Not on track (8) | Poor Stagnant – Not on track (7) | |
| Between 2 and 5 percentage points away from optimal outcome | Excellent Slight decline - Equality maintained (17) | Poor Slight Decline - Not on track (6) | Poor Slight Decline- Not on track (5) | Very poor Slight Decline – Not on track (4) | |
| 5 percentage points or more away from optimal outcome | Excellent Worsening - Equality maintained (16) | Very poor Worsening – Not on track (3) | Very poor Worsening – Not on track (2) | Very poor Worsening - Not on track (1) | |
Matrix 2 – Directional change ratings
| Matrix 2: Directional change ratings | Performance Scale | ||||
| Within small range of ideal value (+/- 3%) | Some distance from ideal value +/- (>3% to 10%) | Moderate distance from ideal value +/- (>10% to 20%) | Large distance from ideal value +/- (>20%) | ||
| Movement Scale | 5 percentage points or more in direction of optimal outcome | Excellent Substantial progress – Equality achieved (20) | Moderate Substantial progress – On track (15) | Moderate Substantial progress – On track (14) | Moderate Substantial progress – On track (13) |
| Between 2 and 5 percentage points in direction of optimal outcome | Excellent Good progress – Equality achieved (19) | Moderate Good progress – On track (12) | Moderate Good progress – On track (11) | Moderate Good progress – On track (10) | |
| Less than 2 percentage points in either direction of optimal outcome | Excellent Stable - Equality maintained (18) | Moderate Stable (9) | Poor Stagnant – Not on track (8) | Poor Stagnant – Not on track (7) | |
| Between 2 and 5 percentage points away from optimal outcome | Excellent Slight decline - Equality maintained (17) | Poor Slight Decline - Not on track (6) | Poor Slight Decline- Not on track (5) | Very poor Slight Decline – Not on track (4) | |
| 5 percentage points or more away from optimal outcome | Excellent Worsening - Equality maintained (16) | Very poor Worsening – Not on track (3) | Very poor Worsening – Not on track (2) | Very poor Worsening - Not on track (1) | |
Matrix 3 – Gender gap ratings
| Matrix 3: Gender gap ratings | Performance Scale | ||||
| Within small range (+/- 3%) | Some gap +/- (>3% to 10%) | Moderate gap +/- (>10% to 20%) | Large gap +/- (>20%) | ||
| Movement Scale | 5 percentage points or more in direction of optimal outcome | Excellent Substantial progress – Equality achieved (20) | Moderate Substantial progress – On track (15) | Moderate Substantial progress – On track (14) | Moderate Substantial progress – On track (13) |
| Between 2 and 5 percentage points in direction of optimal outcome | Excellent Good progress – Equality achieved (19) | Moderate Good progress – On track (12) | Moderate Good progress – On track (11) | Moderate Good progress – On track (10) | |
| Less than 2 percentage points in either direction of optimal outcome | Excellent Stable - Equality maintained (18) | Moderate Stable (9) | Poor Stagnant – Not on track (8) | Poor Stagnant – Not on track (7) | |
| Between 2 and 5 percentage points away from optimal outcome | Excellent Slight decline - Equality maintained (17) | Poor Slight Decline - Not on track (6) | Poor Slight Decline- Not on track (5) | Very poor Slight Decline – Not on track (4) | |
| 5 percentage points or more away from optimal outcome | Excellent Worsening - Equality maintained (16) | Very poor Worsening – Not on track (3) | Very poor Worsening – Not on track (2) | Very poor Worsening - Not on track (1) | |
Holistic ratings
The Commission identified 3 areas that require a more holistic interpretation of progress. These are:
- uptake of part-time work
- uptake of flexible work
- uptake of parental leave.
In these cases, it was not possible to assign an ideal outcome and produce a corresponding matrix. This was because assessing progress relied on interpreting 2 distinct measures in relation to one another. For example, in the case of parental leave, there is no ideal number of weeks that men and women should be taking. Instead, to assess progress, expert assessors considered changes in the duration of leave by gender, combined with whether the gender gap in the average number of weeks of parental leave taken was getting bigger or smaller.
The progress rating scale for measures assessed holistically mirrors the matrix rating scale of:
- Excellent
- Moderate
- Poor
- Very poor
Holistic measures are indicated in the tables in the report by including (Holistic) after the progress rating.
Proportionality ratings
Proportionality ratings are used in Indicator 1 to assess progress on the gender composition of senior leaders in relation to the overall gender composition of the workforce. In these cases, the progress rating scale is:
- Improving (assigned when the 2025 data for the measure has moved closer to the overall gender composition since 2021)
- Proportional (assigned when the 2025 data for the measure is within +/-5% of the overall gender composition)
- Worsening (assigned when the 2025 data for the measure has moved further away from the overall gender composition since 2021).
Gender-concentration ratings
Gender-concentration ratings are used in Indicator 7 to indicate how gender-concentrated an occupation or industry is. They are comprised of two parts. The first part summarises the change:
- More segregation
- No change
- Less segregation
The second part relates to the density of the gender concentration:
- Highly men-concentrated (more than 75% men)
- Moderately men-concentrated (more than 65% to 75% men)
- Slightly men-concentrated (more than 55% to 65% men)
- Gender-balanced (45% to 55% women; 45% to 55% men; up to 10% any gender)
- Slightly women-concentrated (more than 55% to 65% women)
- Moderately women-concentrated (more than 65% to 75% women)
- Highly-women concentrated (more than 75% women).
Data caveats
The Commission holds the most comprehensive public sector workplace gender equality dataset in Australia. There are certain complexities to such a large dataset and the way the Commission handles it.
Data quality and consistency
The Commission’s data can shift slightly over time. This is because duty holders can update their audit submissions if they identify ways to improve or correct their data. Resubmissions can lead to changes in the underlying data used in the Commission’s reports. As such, data in this report may be different from previous releases. The data used in the current report was locked on 11 May 2026.
For each measure calculated, the Commission only includes the audit results from a given duty holder if their underlying data passed the Commission’s data quality standard. For example, if there were issues in an organisation’s base salary data, their audit is excluded from base salary pay gap results.
Survey participation and comparability between years
Participation in the People matter survey is not identical between survey rounds. The mix of organisations responding, as well as the proportion of employees from each organisation who complete the survey, differs from year to year. The most notable variation in this cycle was in public health, which made up a smaller share of responses in 2025 than in 2023. Total responses were broadly stable across rounds.
The Commission tested whether this affected the sexual harassment experience results by reweighting 2025 to the earlier participation mix and by excluding public health from all years. Results were consistent across all approaches, and the findings reported here hold regardless of method. Because public health was under-represented in 2025 and reported rates in that part of the sector are above average, the 2025 sexual harassment experience estimates are likely to be conservative.
Improvements to the workplace gender audit
Since the Act came into effect in March 2021, the Commission has continued to refine its data collection through improved data definitions and processes. This means that some measures are newer than others and may not be available across all reporting years. For example, the senior leader category was introduced to the audit in 2023. You can review the definition of senior leader in the audit guidance.
In other cases, the Commission updated guidance materials to improve duty holder interpretation of a measure, resulting in vast differences in data reported. For example, from 2023 onwards, the guidance for calculating the average number of weeks of parental leave taken was updated. For this reason, 2021 parental leave data is excluded from this report.
Many fields will become mandatory to report fully in 2027 audits. As a result, 2025 results may not be of a sufficient quality to publish for many duty holders. See the list of fields changed to mandatory in 2025 to learn more.
While it has always been mandatory to provide remuneration data, the Commission has improved its standard in 2025. This means that the Commission has excluded data from some organisations in 2021 and 2023 where it didn’t meet this revised standard.
Gender diverse and intersectional data
The data in this report is limited in relation to employees of self-described gender. Many duty holders still only collect gender data as male/female or men/women. This means that often the sample size for people who self-describe their gender is too small to analyse meaningfully. Where the data was reliable, the Commission included insights beyond just the categories of women and men.
The Commission does not assign progress ratings for data about people who self-describe their gender. This is due to incomplete data and complexities in calculating progress for this group.
Similarly, many organisations are unable to provide demographic data beyond gender and age. This limits the extent to which the Commission can undertake intersectional analysis. The People matter survey provides the key data source to consider forms of intersecting inequalities.
Please email: enquiries@genderequalitycommission.vic.gov.au if you would like more detail on the Commission’s methodological approach.
Appendix 2: Duty holders by industry
Audit data from the following organisations is used in this report.
Some organisations may not have submitted data in every reporting year due to changes in their status as a duty holder. A list of duty holders included in 2021 reporting is available in the Baseline Report.
Visit our website for an up-to-date list of current duty holders.
Community and cultural services
- Australian Centre for the Moving Image
- Australian Grand Prix Corporation
- Geelong Cemeteries Trust
- Geelong Performing Arts Centre Trust
- Geelong Regional Library Corporation
- Greater Metropolitan Cemeteries Trust
- Greyhound Racing Victoria
- Harness Racing Victoria
- Melbourne and Olympic Parks Trust
- Melbourne Recital Centre
- Museums Victoria
- National Gallery of Victoria
- North Central Goldfields Library Corporation
- Phillip Island Nature Park Board of Management
- Puffing Billy Railway Board
- Royal Botanic Gardens Board
- Southern Metropolitan Cemeteries Trust
- State Library of Victoria
- State Sport Centres Trust
- Victoria Legal Aid
- Victorian Arts Centre Trust
- Victorian Institute of Sport
- Visit Victoria
- Whitehorse Manningham Libraries
- Zoological Parks and Gardens Board
Finance and insurance
- State Trustees Limited
- Transport Accident Commission
- Treasury Corporation of Victoria
- Victorian Funds Management Corporation
- Victorian Managed Insurance Authority
- WorkSafe Victoria
Local government
- Alpine Shire Council
- Ararat Rural City Council
- Ballarat City Council
- Banyule City Council
- Bass Coast Shire Council
- Baw Baw Shire Council
- Bayside City Council
- Benalla Rural City Council
- Boroondara City Council
- Borough of Queenscliffe
- Brimbank City Council
- Buloke Shire Council
- Campaspe Shire Council
- Cardinia Shire Council
- Casey City Council
- Central Goldfields Shire Council
- Colac Otway Shire Council
- Corangamite Shire Council
- Darebin City Council
- East Gippsland Shire Council
- Frankston City Council
- Gannawarra Shire Council
- Glen Eira City Council
- Glenelg Shire Council
- Golden Plains Shire Council
- Greater Bendigo City Council
- Greater Dandenong City Council
- Greater Geelong City Council
- Greater Shepparton City Council
- Hepburn Shire Council
- Hindmarsh Shire Council
- Hobsons Bay City Council
- Horsham Rural City Council
- Hume City Council
- Indigo Shire Council
- Kingston City Council
- Knox City Council
- Latrobe City Council
- Loddon Shire Council
- Macedon Ranges Shire Council
- Manningham City Council
- Mansfield Shire Council
- Maribyrnong City Council
- Maroondah City Council
- Melbourne City Council
- Melton City Council
- Merri-bek City Council
- Mildura Rural City Council
- Mitchell Shire Council
- Moira Shire Council
- Monash City Council
- Moonee Valley City Council
- Moorabool Shire Council
- Mornington Peninsula Shire Council
- Mount Alexander Shire Council
- Moyne Shire Council
- Murrindindi Shire Council
- Nillumbik Shire Council
- Northern Grampians Shire Council
- Port Phillip City Council
- Pyrenees Shire Council
- South Gippsland Shire Council
- Southern Grampians Shire Council
- Stonnington City Council
- Strathbogie Shire Council
- Surf Coast Shire Council
- Swan Hill Rural City Council
- Towong Shire Council
- Wangaratta Rural City Council
- Warrnambool City Council
- Wellington Shire Council
- West Wimmera Shire Council
- Whitehorse City Council
- Whittlesea City Council
- Wodonga City Council
- Wyndham City Council
- Yarra City Council
- Yarra Ranges Shire Council
- Yarriambiack Shire Council
Other
- Accident Compensation Conciliation Service
- Building and Plumbing Commission
- Departments of Parliament
- Energy Safe Victoria
- Melbourne Arts Precinct Corporation
- SEC Victoria Pty Ltd
- Victorian Convention and Event Trust
- Victorian Gambling and Casino Control Commission
Police and emergency services
- Ambulance Victoria
- Country Fire Authority
- Fire Rescue Victoria
- Triple Zero Victoria
- Victoria Police
- Victoria State Emergency Service
Public health care
- Albury Wodonga Health
- Alexandra District Health
- Alfred Health
- Alpine Health
- Austin Health
- Bairnsdale Regional Health Service
- Ballarat Health Services
- Barwon Health
- Bass Coast Health
- Beaufort and Skipton Health Service
- Beechworth Health Service
- Benalla Health
- Bendigo Health Care Group
- Boort District Health
- BreastScreen Victoria
- Casterton Memorial Hospital
- Castlemaine Health
- Central Gippsland Health Service
- Central Highlands Rural Health
- Cohuna District Hospital
- Colac Area Health
- Corryong Health
- Dhelkaya Health
- East Grampians Health Service
- East Wimmera Health Service
- Eastern Health
- Echuca Regional Health
- Edenhope and District Memorial Hospital
- Gippsland Southern Health Service
- Goulburn Valley Health Services
- Grampians Health
- Great Ocean Road Health
- Health Share Victoria
- Heathcote Health
- Hesse Rural Health Service
- Heywood Rural Health
- Inglewood and Districts Health Service
- Kerang District Health
- Kilmore District Health
- Kooweerup Regional Health Service
- Kyabram and District Health Service
- Latrobe Regional Hospital
- Maldon Hospital
- Mallee Track Health and Community Service
- Mansfield District Hospital
- Maryborough District Health Service
- Melbourne Health
- Mildura Base Public Hospital
- Monash Health
- Moyne Health Services
- NCN Health
- Northeast Health Wangaratta
- Northern Health
- Omeo District Health
- Oral Health Victoria
- Orbost Regional Health
- Peninsula Health
- Peter MacCallum Cancer Centre
- Portland District Health
- Robinvale District Health Services
- Rochester and Elmore District Health Service
- Royal Children’s Hospital
- Royal Victorian Eye and Ear Hospital
- Royal Women’s Hospital
- Rural Northwest Health
- Seymour Health
- South Gippsland Hospital
- South West Healthcare
- Stawell Regional Health
- Swan Hill District Health
- Tallangatta Health Service
- Terang and Mortlake Health Service
- The Queen Elizabeth Centre
- Timboon and District Healthcare Service
- Tweddle Child and Family Health Service
- Victorian Health Promotion Foundation
- Victorian Institute of Forensic Mental Health
- West Gippsland Healthcare Group
- West Wimmera Health Service
- Western District Health Service
- Western Health
- Wimmera Health Care Group
- Yarram and District Health Service
- Yarrawonga Health
- Yea and District Memorial Hospital
TAFE and other education
- AMES Australia
- Bendigo Kangan Institute
- Box Hill Institute
- Chisholm Institute
- Gippsland Institute of TAFE
- Gordon Institute of TAFE
- Goulburn Ovens Institute of TAFE
- Holmesglen Institute
- Melbourne Polytechnic
- South West Institute of TAFE
- Sunraysia Institute of TAFE
- Victorian Institute of Teaching
- William Angliss Institute of TAFE
- Wodonga Institute of TAFE
Transport
- Ports Victoria
- V/Line Corporation
- Victorian Rail Track Corporation
Universities
- Australian Catholic University
- Deakin University
- Federation University
- La Trobe University
- Monash University
- RMIT University
- Swinburne University of Technology
- University of Melbourne
- Victoria University
Victorian Public Service
- CenITex
- Cladding Safety Victoria
- Commercial Passenger Vehicles Victoria
- Commission for Children and Young People
- Court Services Victoria
- Department of Education
- Department of Energy, Environment and Climate Action
- Department of Families, Fairness and Housing
- Department of Health
- Department of Jobs, Skills, Industry and Regions
- Department of Justice and Community Safety
- Department of Premier and Cabinet
- Department of Transport and Planning
- Department of Treasury and Finance
- Emergency Services Superannuation Board
- Environment Protection Authority
- Essential Services Commission
- Independent Broad-based Anti-corruption Commission
- Labour Hire Licensing Authority
- Office of Public Prosecutions
- Office of the Legal Services Commissioner
- Office of the Ombudsman Victoria
- Office of the Victorian Electoral Commissioner
- Office of the Victorian Information Commissioner
- Portable Long Service Authority
- Public Record Office Victoria
- Safe Transport Victoria
- Safer Care Victoria
- Service Victoria
- State Revenue Office
- Suburban Rail Loop Authority
- Sustainability Victoria
- Victorian Auditor-General’s Office
- Victorian Commission for Gambling and Liquor Regulation
- Victorian Equal Opportunity and Human Rights Commission
- Victorian Fisheries Authority
- Victorian Government Solicitor’s Office
- Victorian Infrastructure Delivery Authority
- Victorian Institute of Forensic Medicine
- Victorian Public Sector Commission
- Victorian Responsible Gambling Foundation
Water and land management
- Alpine Resorts Victoria
- Barwon Asset Solutions Pty Ltd
- Barwon Coast Committee of Management
- Barwon Region Water Corporation
- Central Gippsland Region Water Corporation
- Central Highlands Region Water Corporation
- Coliban Region Water Corporation
- Development Victoria
- East Gippsland Region Water Corporation
- Falls Creek Alpine Resort Management Board
- Gippsland and Southern Rural Water Corporation
- Gippsland Ports Committee of Management
- Goulburn Broken Catchment Management Authority
- Goulburn Murray Rural Water Corporation
- Goulburn Valley Region Water Corporation
- Grampians Wimmera Mallee Water Corporation
- Great Ocean Road Coast and Parks Authority
- Greater Western Water
- Lower Murray Urban and Rural Water Corporation
- Mallee Catchment Management Authority
- Melbourne Water Corporation
- Mount Buller and Mount Stirling Alpine Resort Management Board
- Mount Hotham Resort Management Board
- North Central Catchment Management Authority
- North East Region Water Corporation
- Parks Victoria
- South East Water Corporation
- South Gippsland Region Water Corporation
- Southern Alpine Resort Management Board
- Trust for Nature (Victoria)
- VicForests
- Victorian Planning Authority
- Wannon Region Water Corporation
- Westernport Region Water Corporation
- Yarra Valley Water Corporation
This report categorises industries within the sector slightly differently to the Commission’s previous reporting. This report separates several industries – community and cultural services, finance and insurance, other and transport – that were grouped together as ‘creative industries, finance, transport and other’ in previous reports. This change was made to ensure that where possible, smaller industry groups contain similar types of organisations, which experience similar gender equality challenges.
References
ABS (Australian Bureau of Statistics) (November 2022) ‘Conceptual basis of ANZSCO’, ANZSCO – Australian and New Zealand Standard Classification of Occupations, 2022, accessed 18 June 2026.
ABS (December 2024) ‘Summary of major changes between ANZSCO v1.3/2021/2022 and OSCA 2024 v1.0, OSCA – Occupation Standard Classification for Australia, 2024, Version 1.0, accessed 18 June 2026.
ABS (April 2026) ‘Table 3: Labour force status by Sex, Victoria – Trend, Seasonally adjusted and Original’, Labour Force, Australia, accessed 14 June 2026.
Adamecz-Völgyi A and Shure N (2022) The gender gap in top jobs – the role of overconfidence, Labour Economics, 79:1-29.
AHRC (Australian Human Rights Commission) (2020) Respect@Work: Sexual harassment national inquiry report, AHRC website, accessed 18 June 2026.
AHRC (2022) Time for respect: Fifth national survey sexual harassment workplaces(opens in a new window), AHRC website, accessed 19 June 2026.
AHRC (2025) Speaking from experience: What needs to change to address workplace sexual harassment, AHRC website, accessed 15 June 2026.
Aletraris L (2010) How satisfied are they and why? A study of job satisfaction, job rewards, gender and temporary agency workers in Australia, Human relations, 63(8):1129-1155.
Artz B, Goodall AH and Oswald AJ (2016) “Do women ask?”, IZA Institute of Labor Economics, No. 10183.
ASFA (Association of Superannuation Funds Australia) (2023) Retirement savings improving but still a savings gap for many(opens in a new window), ASFA website, accessed 30 June 2026.
Burns L, Clark J and Willis J (2015) ‘Mapping the (invisible) salaried woman architect: The Australian parlour research project’, Footprint, 9(2):143-160.
Carson A and Ruppanner L (2024) Breaking barriers: A study of women’s participation and representation in local government, La Trobe University website, accessed 29 April 2026.
Carvajal MJ, Popovici I and Hardigan PC (2021) ‘Gender and pharmacists’ career satisfaction in the United States’, Pharmacy, 9(4), 173-189.
Cassells R and Duncan A (2020) Gender equity insights 2020: Delivering the business outcomes, BCEC|WGEA Gender Equity Series, Issue #5, accessed 1 July 2026.
Commission for Gender Equality in the Public Sector (2021) Baseline report:2021 workplace gender audit data analysis, Commission for Gender Equality in the Public Sector website, accessed 25 February 2026.
Commission for Gender Equality in the Public Sector (2023) Intersectionality at work: Building a baseline on compounded gender inequality in the Victorian public sector, Commission for Gender Equality in the Public Sector website, accessed 25 February 2026.
Commission for Gender Equality in the Public Sector (2025) Insights report: Gender pay gap, Commission for Gender Equality in the Public Sector website, accessed 25 February 2026.
Commission for Gender Equality in the Public Sector (2025) Insights report: Sexual harassment, Commission for Gender Equality in the Public Sector website, accessed 25 February 2026.
Chilazi S, Bohnet I and Hauser O (2021) Achieving gender balance at all levels of your company, Harvard Business Review website, accessed 18 June 2026.
Dangar K, Gunawansa M, Blackham A, Ruppanner L, Gaze B, Ainsworth S, Churchill B, Acosta Rueda L and Patrick C (2023) ‘Caring and workplace gender equality in the Public Sector in Victoria: Final Project Report’, University of Melbourne, accessed 15 April 2025.
Dockery AM and Buchler S (2023) ‘Women’s work: Myth or reality? occupational feminisation and women’s job satisfaction in Australia’, Australian Journal of Labour Economics, 26(1):51-83.
Eikhof DR (2012) “A double-edged sword”: Twenty-first century workplace trends and gender equality, Gender in Management: An International Journal, 27(1):7-22.
Elson D (2017) ‘Recognize, reduce, and redistribute unpaid care work: How to close the gender gap’, New Labor Forum, 26(2):52-61.
Fleming C and Kler P (2014) ‘Female overeducation, job satisfaction and the impact of children at home in Australia’, Economic Analysis and Policy, 44(2):143-155.
Gerson LB, Twomey K, Hecht G, Lee L, McQuaid K, Pizarro TT, Street S, Yoshida C and Early D (2007) ‘Does Gender affect career satisfaction and advancement in gastroenterology? Results of an aga institute–sponsored survey’, Gastroenterology, 132(4):1598-1606.
Ghalebeigi A, Gekara V, Douglas K, Ferraro S, Wang L and Safari M (2022) ‘Assessing progress in implementing the Gender Equality Act 2020’, RMIT University, accessed 1 June 2026.
Gould JA, Kulik CT and Sardeshmukh SR (2018) ‘Gender diversity from the top: the trickle-down effect in the Australian public sector’, Asia Pacific Journal of Human Resources, 56(1):6-30.
JSA (Jobs and Skills Australia) (2025) Gender economic equality study, JSA, Australian Government website, accessed 25 February 2026.
Keenan C, von Hippel C, Neall A, Barlow FK (2024) ‘Blurred ideas: How perpetrator behaviour, target response, and observer gender can influence perceptions of workplace sexual harassment’, Journal of Interpersonal Violence, 40(13-14):3132-3161.
Kifle, T, Kler, P, & Shankar, S (2014). ‘The power of the pram: do young children determine female job satisfaction?’, Applied Economics Letters, 21(4):289-292.
Lind G and Colquhoun R (2021) Analysis of gender segregation within detailed occupations and industries in Australia, Australian Journal of Labour Economics, 24(1):47-69.
Long A (2005) Happily ever after? A study of job satisfaction in Australia, Economic Record, 81(255):303-321.
McDonald P and Charlesworth S (2016) ‘Workplace sexual harassment at the margins’, Work, Employment and Society 30(1):118-134.
Nielsen, MB, Bjørkelo B, Notelaer G and Einarsen S (2010) ‘Sexual harassment: Prevalence, outcomes, and gender differences assessed by three different estimation methods’, Journal of Aggression, Maltreatment & Trauma, 19(3): 252–274
Petersen M and Tilse C (2024) ‘Women’s life course and precarious housing in older age: an Australian qualitative study’, Housing Studies, 39(12):3245–3267.
Prime Minister and Cabinet (July 2024) More paid parental leave for Australian families than ever before, Australian Government website, accessed 18 June 2016.
Risse L (2025) By how much Is “women’s work” undervalued in the economy? The Economist record 421, 101(335).
Rudman LA and Phelan JE (2008) ‘Backlash effects for disconfirming gender stereotypes in organizations’, Research in Organizational Behavior, 28:61-79.
Summers A (2022) The choice: violence or poverty, University of Technology Sydney, accessed 30 June 2026.
Tischler C, McDonald K, Dallamora E and Reeves K (2023) Workforce participation: Exploring prevalence of part-time and insecure work in Grampians public service roles, Federation University Australia, accessed 27 May 2026.
Vecchio N, Scuffham PA, Hilton MF and Whiteford HA (2013) ‘Differences in wage rates for males and females in the health sector: A consideration of unpaid overtime to decompose the gender wage gap’, Hum Resour Health 11(9).
Victorian Government (August 2023) Our equal state: Victoria’s gender equality strategy and action plan 2023-2027, Victorian Government website, accessed 25 February 2026.
VPSC (Victorian Public Sector Commission) (2022) Board numbers and demographics, Victorian Government website, accessed 29 April 2026.
Walters S (2005) Making the best of a bad job? Female part-timers’ orientations and attitudes to work’, Gender, Work & Organization, 12(3): 193-216.
Węziak-Białowolska D, Białowolski P, Mordukhovich I and McNeely E (2020) ‘Work, gender, and sexual harassment on the frontlines of commercial travel: A cross-sectional study of flight crew well-being’, The International Journal of Aerospace Psychology, 30(3-4):171–189.
WGEA (Workplace Gender Equality Agency) (2018) Gender and negotiation in the workplace, WGEA website, accessed 10 June 2026.
WGEA (2026) Employer gender pay gaps report, WGEA website, accessed 18 June 2026.
WGEA, DCA (Diversity Council Australia) and KPMG (2026) She’s price(d)less: The economics of the gender pay gap, WGEA website, accessed 14 June 2026.
Wibrow B (2022) VET and higher education pathways – do outcomes differ for the same occupation? National Centre for Vocational Education Research (NCVER), Adelaide, accessed 9 June 2026.
Zou M (2015) ‘Gender, work orientations and job satisfaction’, Work, Employment and Society, 29(1): 3-22.