

Follow the steps in Accessing the reporting platform (opens in a new window)to login to the reporting platform.
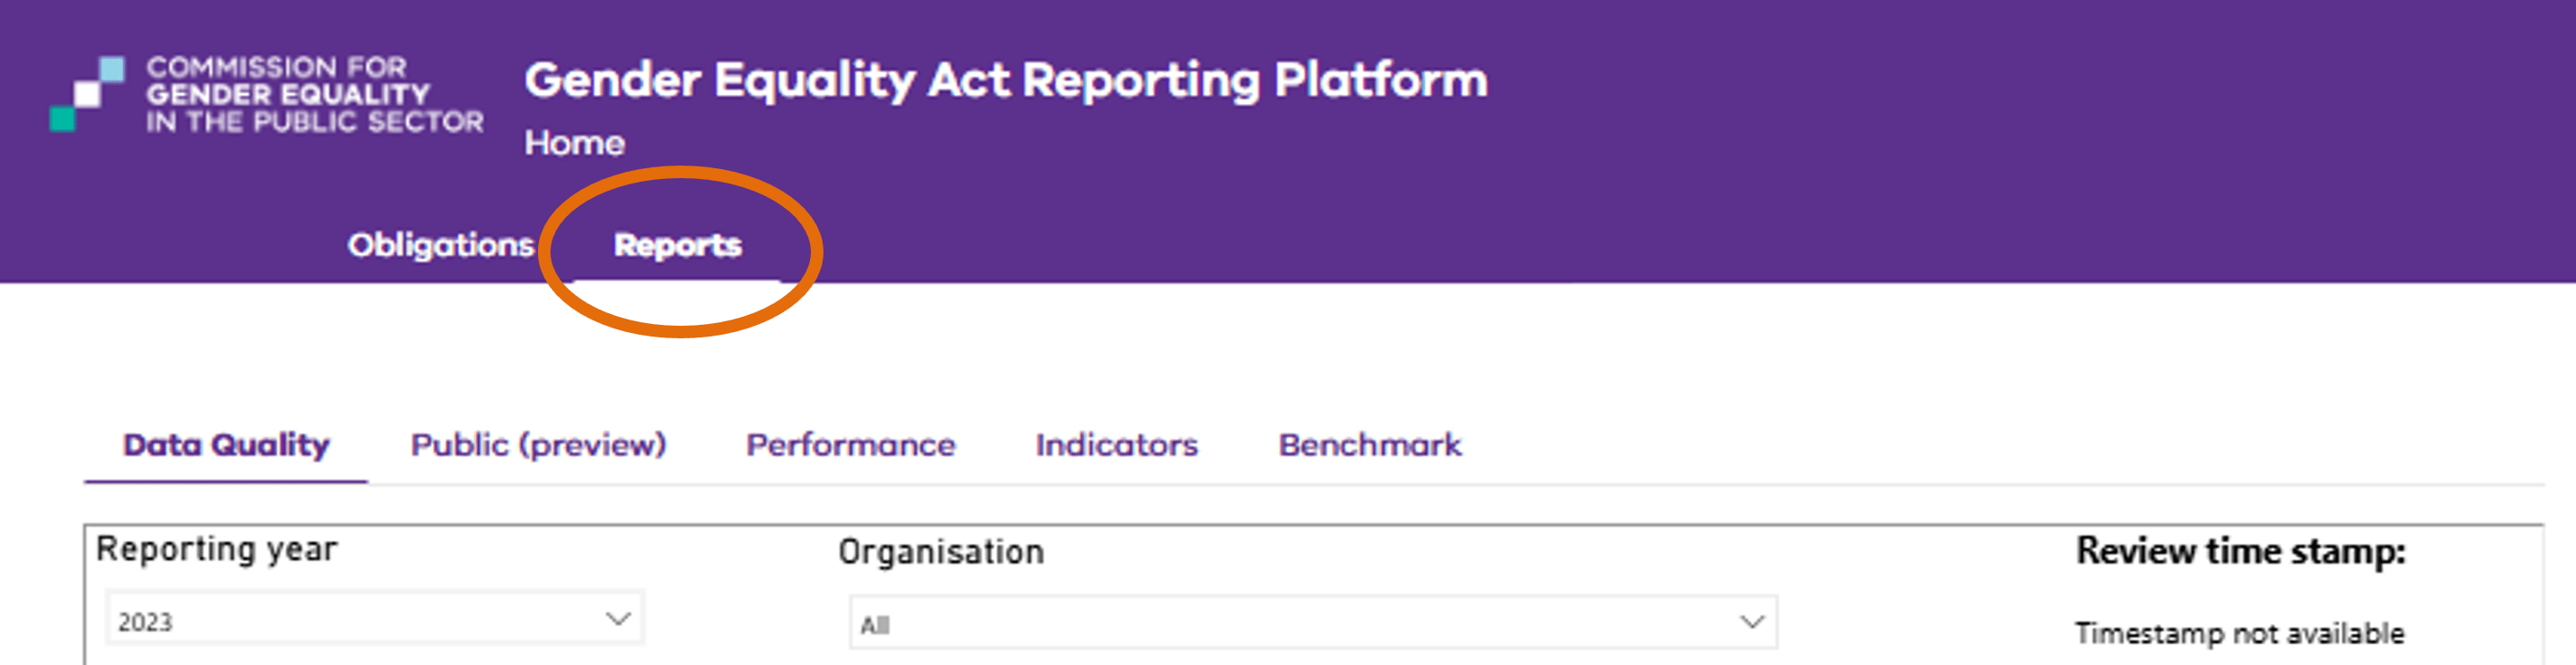
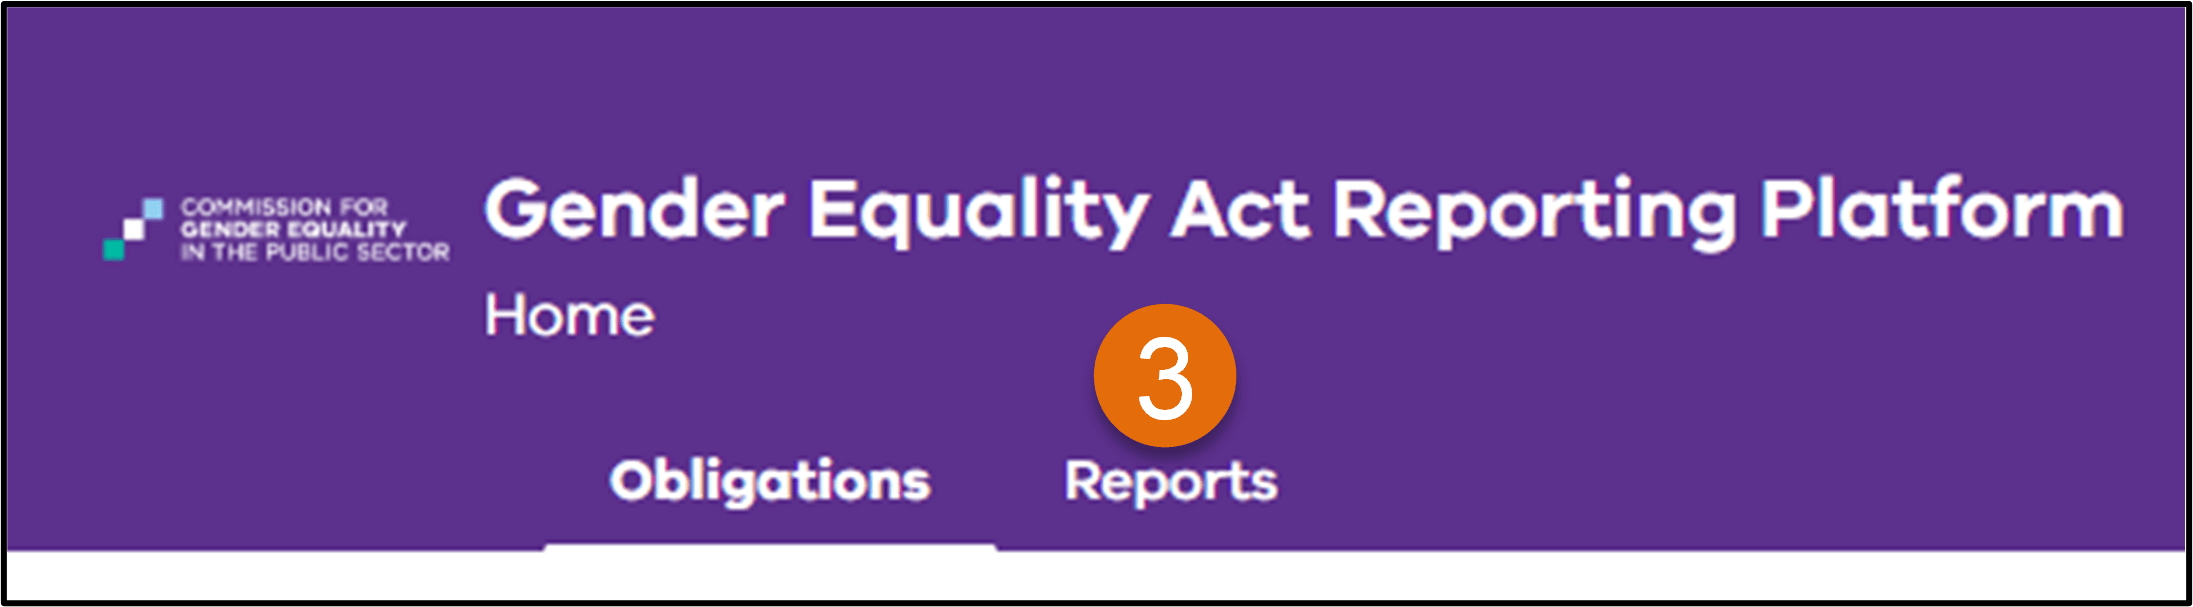
When logged in, click on the ‘Reports’ tab to view a suite of reports that you can use to:
- better understand your data
- review the quality of your data
- identify trends or gaps
- inform your gender equality action plan or progress report discussions
- inform internal business conversations.
Figure 13: The Reports tab

Access the reports on the reporting platform by clicking on each tab:
1. The ‘Data Quality’ report – provides information about the quality of your data and provides an indication about whether your audit meets the Commissioner’s compliance requirements.
2. The ‘Public (preview)’ report – provides a preview of how your organisation’s data will be presented to the public on the Insights Portal(opens in a new window).
3. The ‘Performance’ report – displays your organisation’s data against the performance measures for each of the 7 workplace gender equality indicators.
4. The ‘Indicators’ report – displays the data in the form of gender equality indicator data measures. Refer to Indicators report(opens in a new window) for information on how to navigate this detailed report.
5. The ‘Benchmark’ report - allows data comparisons across multiple years, or against published benchmarks.
Refer to the website page Analysing your workplace gender audit results(opens in a new window) for a detailed reference on how to analyse workplace gender audit data.
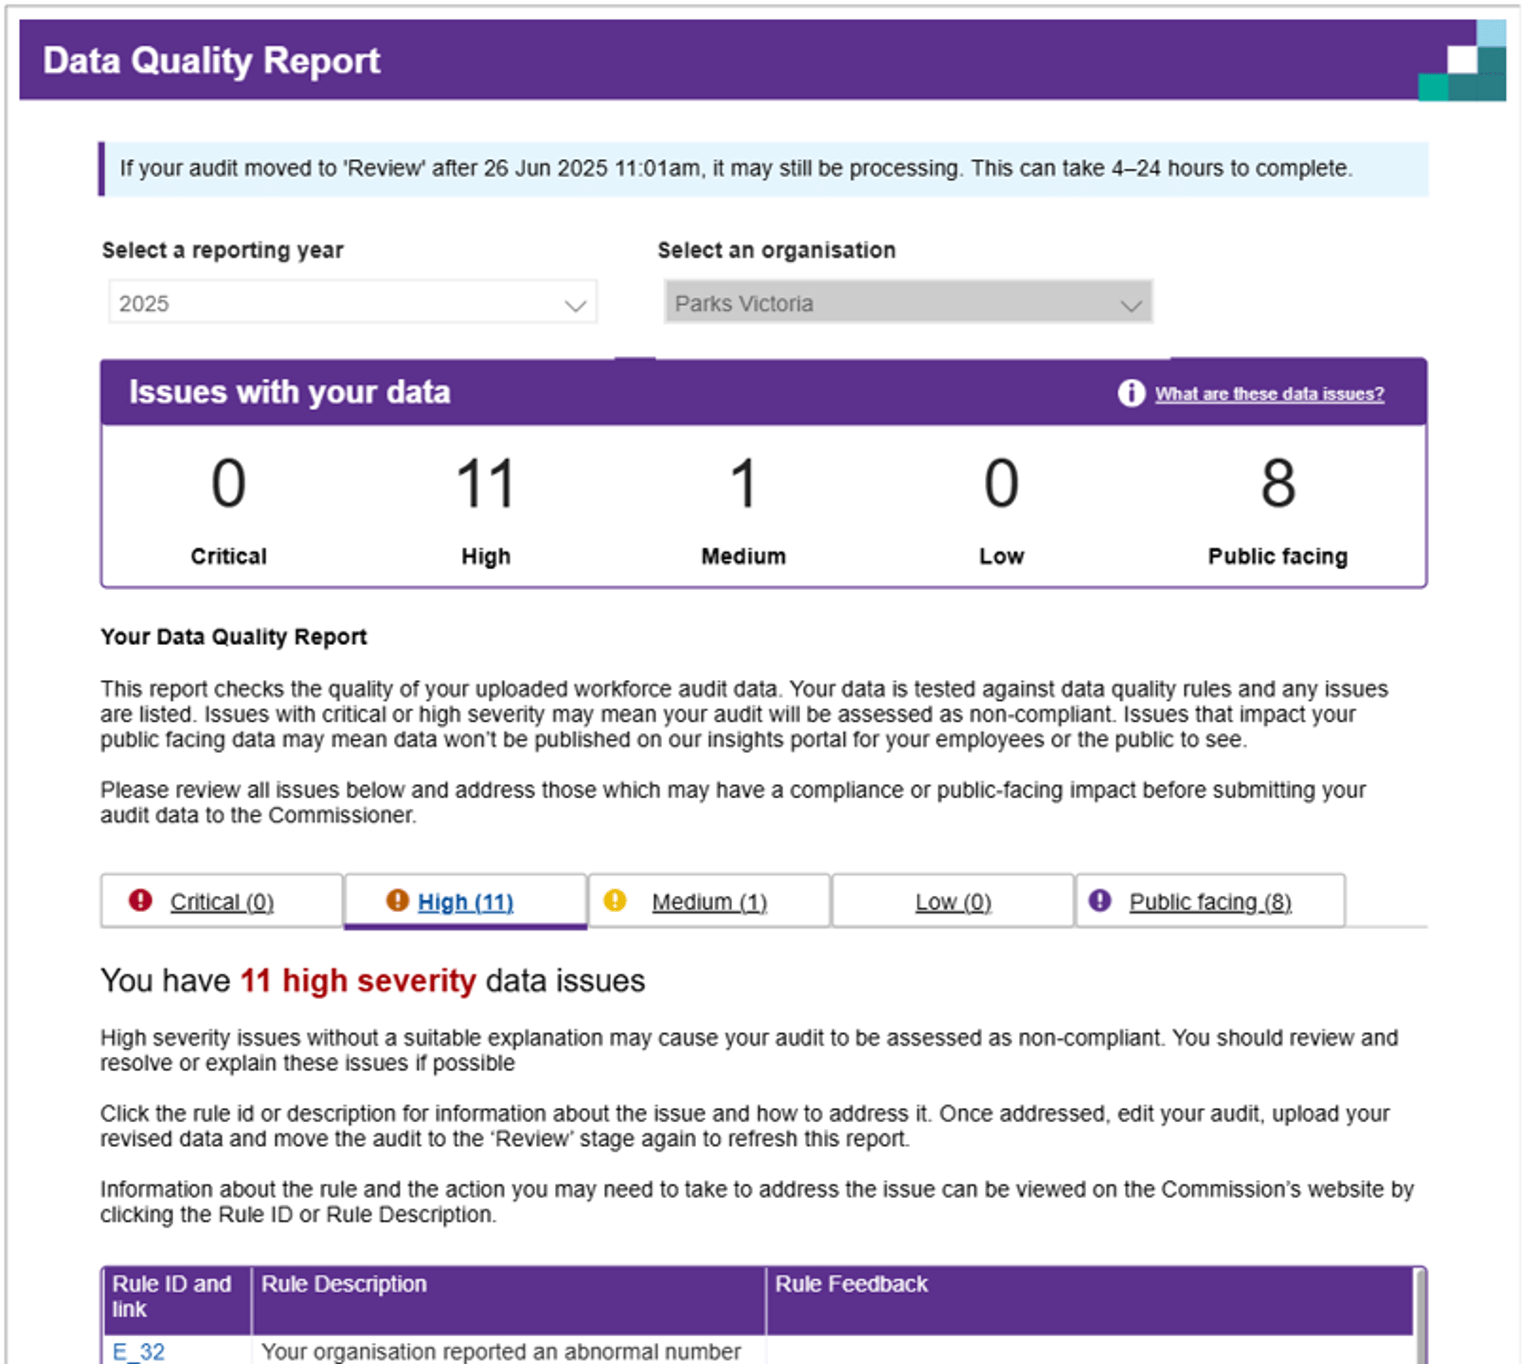
Data Quality report
This report checks the quality of the workforce audit data currently loaded for the selected reporting year. Audit data is tested against data quality rules and if any issues are found, they are listed in this report.
Issues with critical or high severity may mean the audit will be assessed as non-compliant. Issues that impact public facing data may mean that data cannot be published on the insights portal for the public to see.
You should review all issues below and address those which may have a compliance or public-facing impact before submitting your audit data to the Commissioner.
The Commission has identified 5 categories of potential data issues that should be reviewed:
- Critical severity issues, without a suitable explanation will cause your audit to be assessed as non-compliant. You must resolve or explain these issues.
- High severity issues, without a suitable explanation may cause your audit to be assessed as non-compliant. You should review and resolve or explain these issues if possible.
- Medium severity issues will not affect your compliance assessment. If not resolved, some audit data may be hidden from your public report or excluded from the Commission’s analysis of the sector. You are encouraged but not required to resolve or explain these issues.
- Low severity issues will not affect your compliance assessment. If not resolved, some audit data may be excluded from the Commission’s analysis of the sector. You are encouraged but not required to resolve or explain these issues.
- Public facing issues may cause some audit data to be hidden from the public reports on the Insights Portal(opens in a new window). To read more about the consequences of not addressing these issues, go to Indicative-only preview below.
To use the Data Quality report:
1. Click on the ‘Data Quality Report’ tab under the ‘Reports’ tab.
2. Refer to the blue banner and ensure the obligation has been in ‘Review’ status for the required time.
3. Select the relevant reporting year at the top.
4. To view all data issues found, click on either
- the numbers in the ‘Issues with your data’ summary panel, or
- the tabs labelled critical, high, medium, low and public facing.
Figure 14: The Data Quality Report
5. The ‘Issues with your data’ summary panel has an information link in the top right corner called ‘what are these data issues?’. Click this to view more information.
6. Scroll down to the table to review results.
The ‘Rule description’ column describes the data issue, while ‘Rule feedback’ provides brief guidance on how to address the issue. More detailed advice on the data issue can be found by clicking the link on the ‘Rule ID and link’ field.
For questions regarding these reports, contact the Commission. See Getting help.
Public (preview) report
You can preview an indication of how your audit results will be presented through the Commissions Insights Portal(opens in a new window) by going to the ‘Public (preview)’ tab under the ‘Reports’ tab on the reporting platform.
To use this report:
1. Select the ‘Reporting year’ at the top left of the report.
2. Confirm that you are viewing the most recent version of audit data by checking that the ‘Review time stamp’ at the top right matches with obligation upload times
3. Scroll down to view an indication of how the public data will display. See Indicative-only preview for more information.
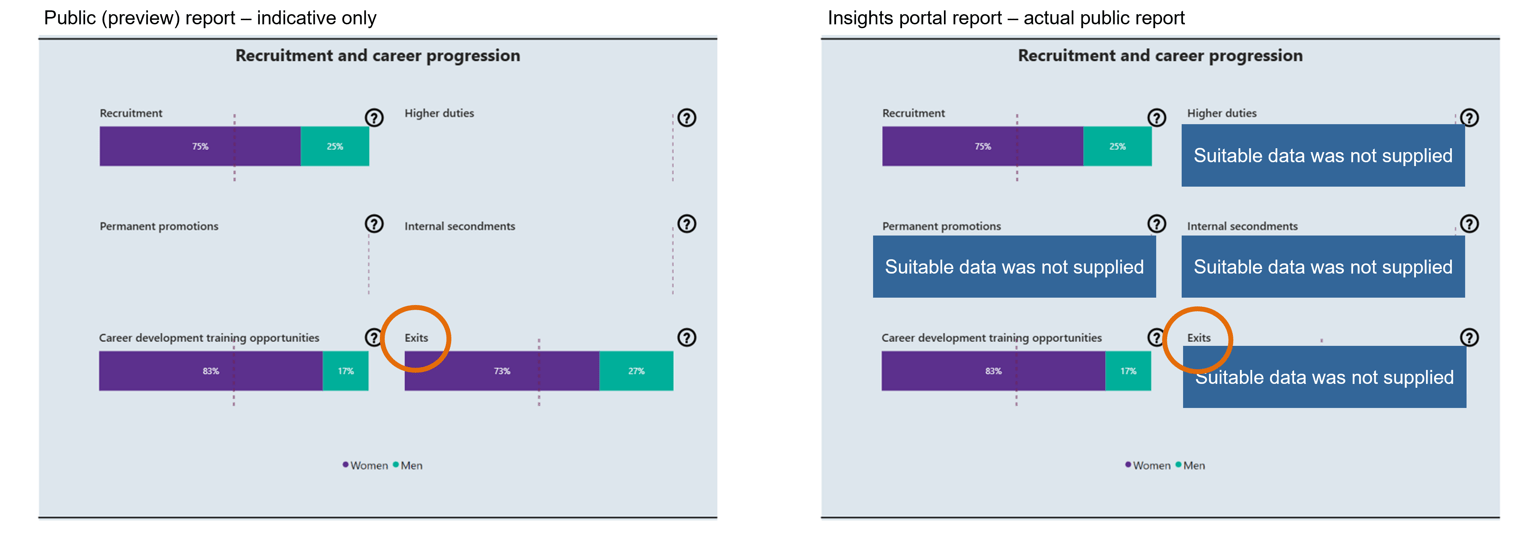
Indicative-only preview
Note that prior to the Commissioner publishing your organisation’s results, following successful compliance assessment, the public preview report should only be considered indicative of how the data will appear to the public.
For example, if the Commission identifies data issues impacting the public insights report(opens in a new window), the relevant part of the public report may be hidden. The left-hand figure below shows how the public (preview) report looks to the organisation, while the right-hand figure shows how it will present to the public, if the data issues reported in the Data Quality report on the ‘Public facing’ tab are not addressed.
Figure 15: Public (preview) report versus actual public insights report
To minimise the chance that your organisation’s public report will show some results as hidden, refer to the Data Quality report to review and address the listed public facing issues.
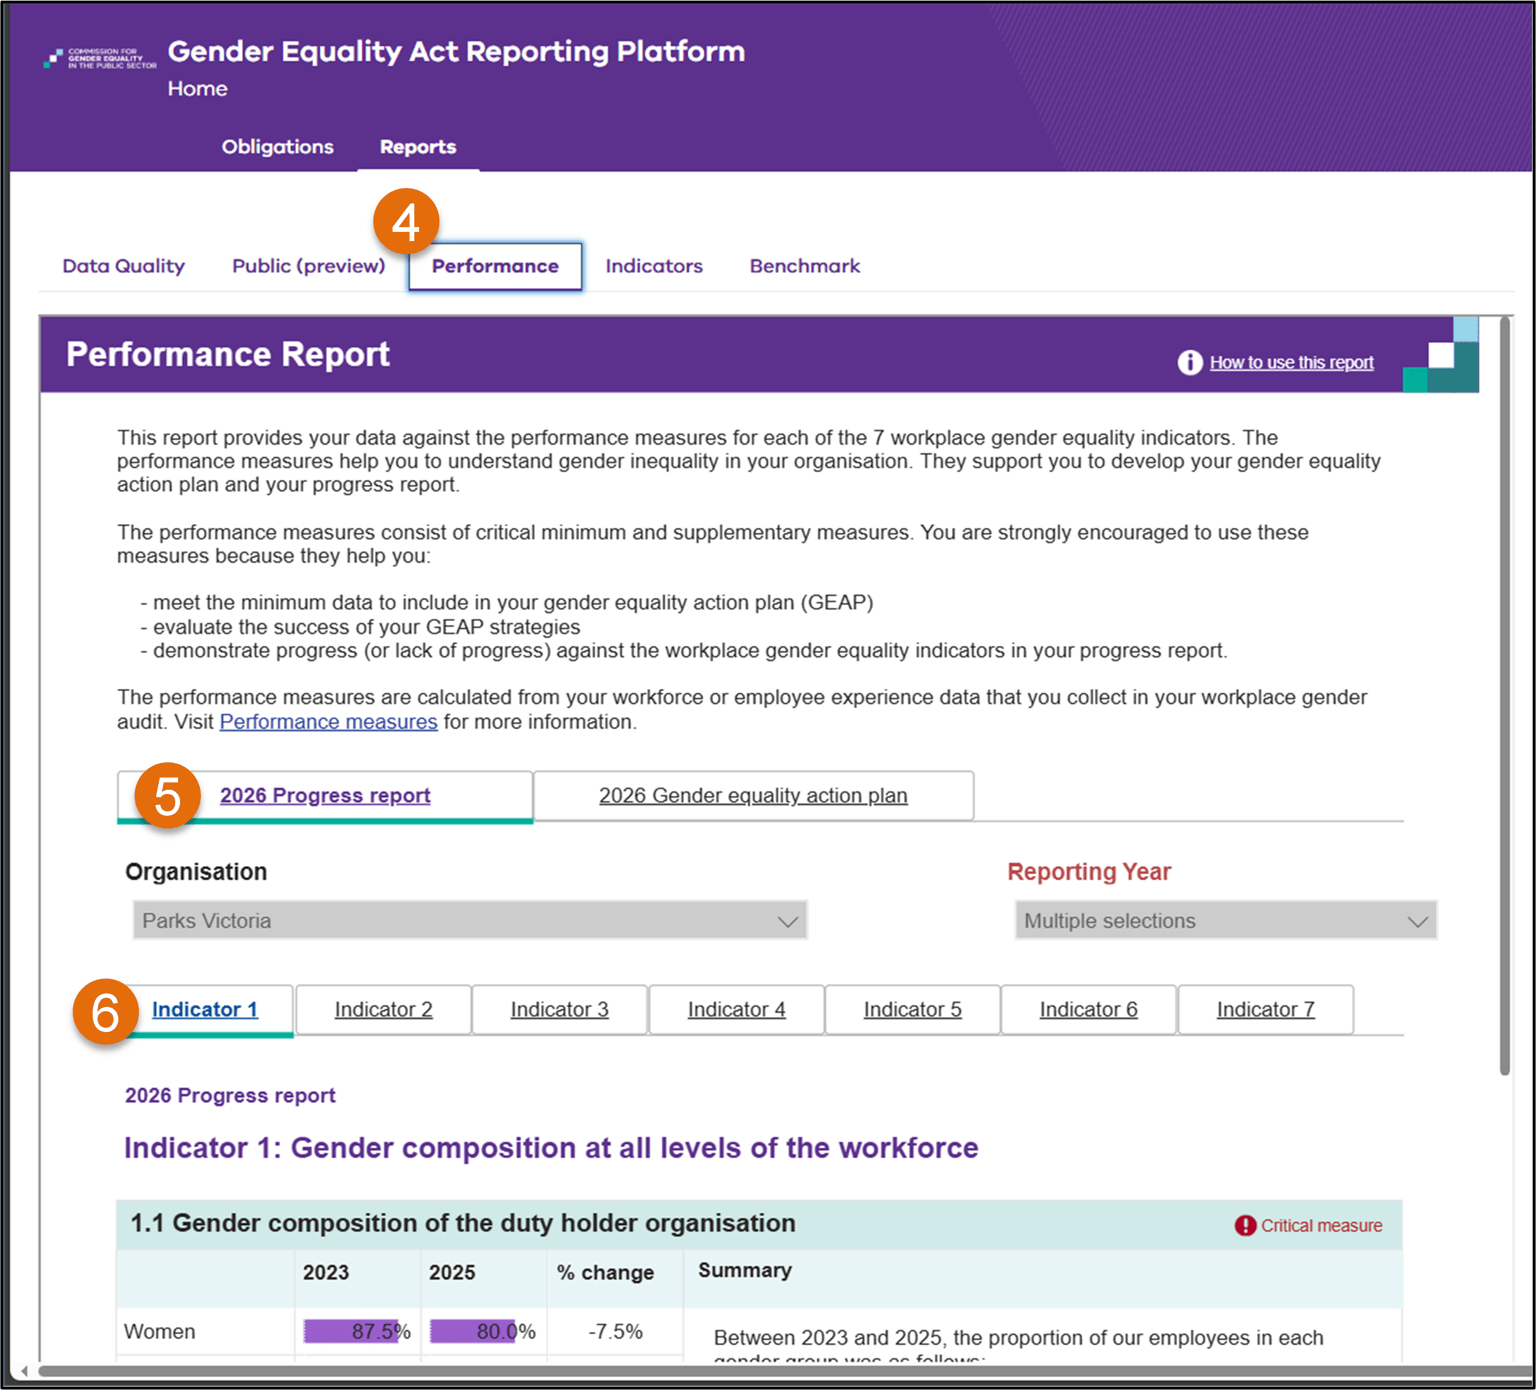
Performance report
This report provides your organisation’s data against the performance measures for each of the 7 workplace gender equality indicators. The performance measures help you understand gender inequality in your organisation. They support you to develop gender equality action plans and progress reports.
Follow these steps to review performance measures using the Gender Equality Act reporting platform:
1. Register to use our reporting platform(opens in a new window), if you don't have access.
2. Login to the reporting platform(opens in a new window)
3. Click the reports tab
4. Click the performance tab to review your performance report.
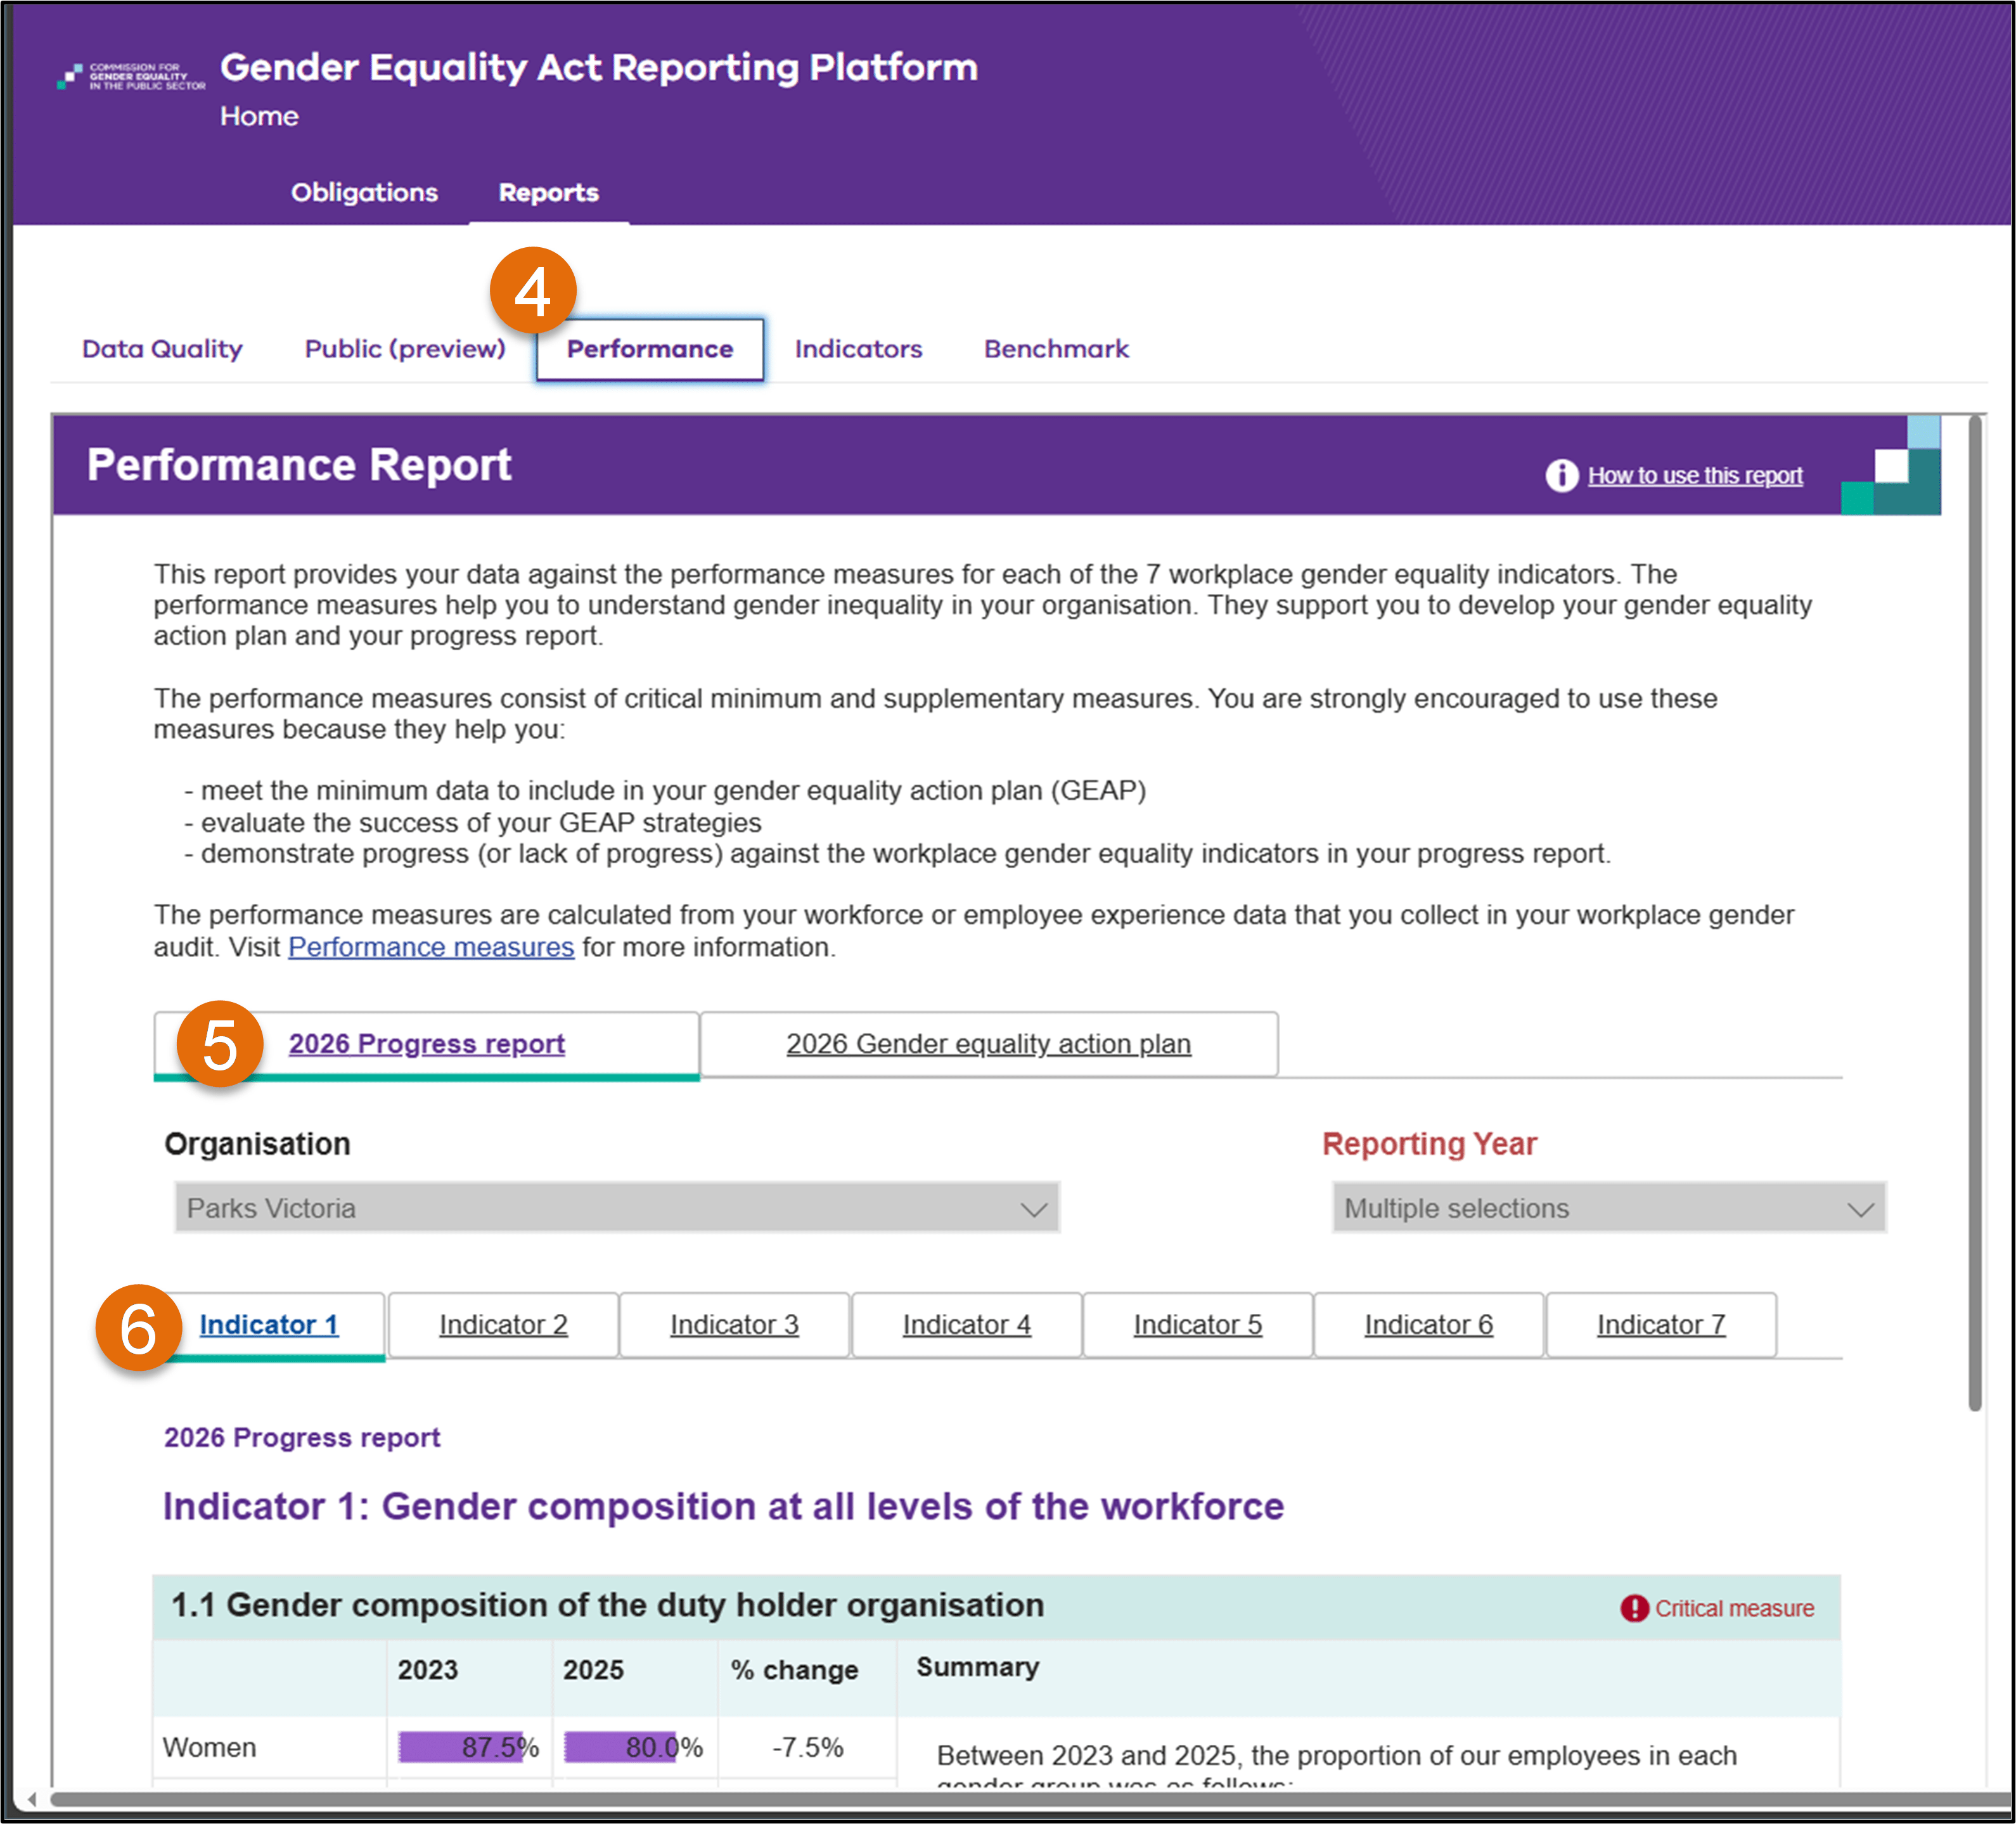
Figure 16: Reports tab in the Gender Equality Act Reporting Platform

Figure 17: Performance tab in the Reports section
5. You have two ways to view your data:
- The progress report tab compares results from your 2023 and 2025 audits against each performance measure
- The gender equality action plan (GEAP) tab shows the results of your 2025 audit against each performance measure
6. Within the progress report and GEAP tabs, you can select from each of the 7 workplace gender equality indicators. When you click on an indicator, you will see the performance measures associated with that indicator.
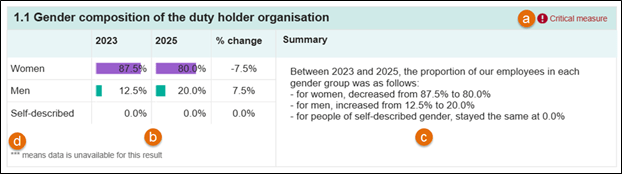
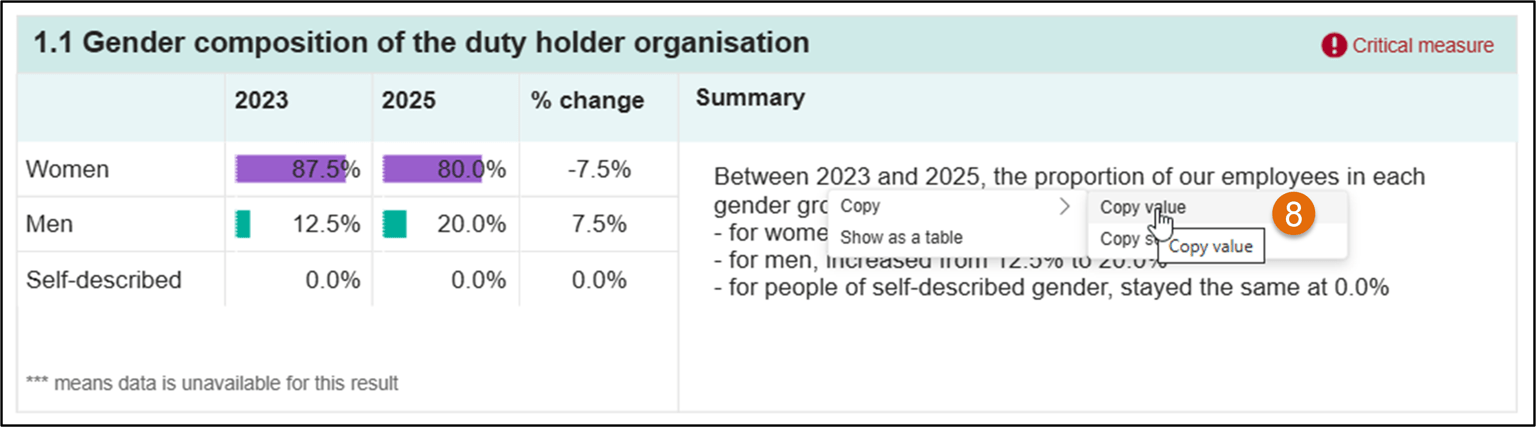
7. Each performance measure is shown in the following way
Figure 18: Parts of the performance measure as displayed in the performance report

- Title of the performance measure: it will also tell you if the performance measure is critical or supplementary.
- Results: these are presented in table and visual form in most measures.
- For progress report, it will show your 2023 and 2025 data, and the change between reporting periods.
- For GEAP, it will show your 2025 data.
- Summary: most performance measures will have a written summary of your data. The summary does not analyse your data. You must analyse your data to understand the gender inequality issues at your organisation (for your GEAP) and whether you have made progress (for your progress report, if you are required to do one). Refer to analysing your workplace gender audit results for further guidance.
- No data: If you see *** in the results, it means the data wasn’t available. This may be because:
- there weren't enough survey responses (for employee experience data), or
- your organisation couldn’t provide the data. - Rounded data: data results are rounded to one decimal point. This means that the sum of a group of data may be more or less than 100%. For instance, 99.9% or 100.1%.
- No data: If you see *** in the results, it means the data wasn’t available. This may be because:
Figure 19: Copying summary text from performance measures
8. You can copy the summary text. To do this, right-click on the summary text. Choose ‘copy’. Select ‘copy value’. Paste the text as relevant.
- The summary does not replace your analysis of your audit data. You will not be compliant if you only copy the summary text into your GEAP or progress report. You will also need to describe the gender equality issues your data reveals.
- The summary does not consider your workplace gender audit compliance outcome or the quality of your data.
- The summary does not apply a privacy filter to the presented results, except for performance measures related to sexual harassment (indicator 4). Ensure that the results in the summary respect your analysis privacy protocols and adjust them if needed.
- To review the quality of your audit data, use the data quality report. Refer to the reporting platform user guide(opens in a new window) for further information about how to use this report.
- To review the compliance outcome of your audit, refer to the reporting platform user guide(opens in a new window) for further information about how to review your compliance outcomes.
Indicators report
The indicators report presents your organisation’s audit data in the form of gender equality indicator data measures. This report is controlled by a series of indicator buttons which display interactive reports for each of the 7 gender equality indicators.
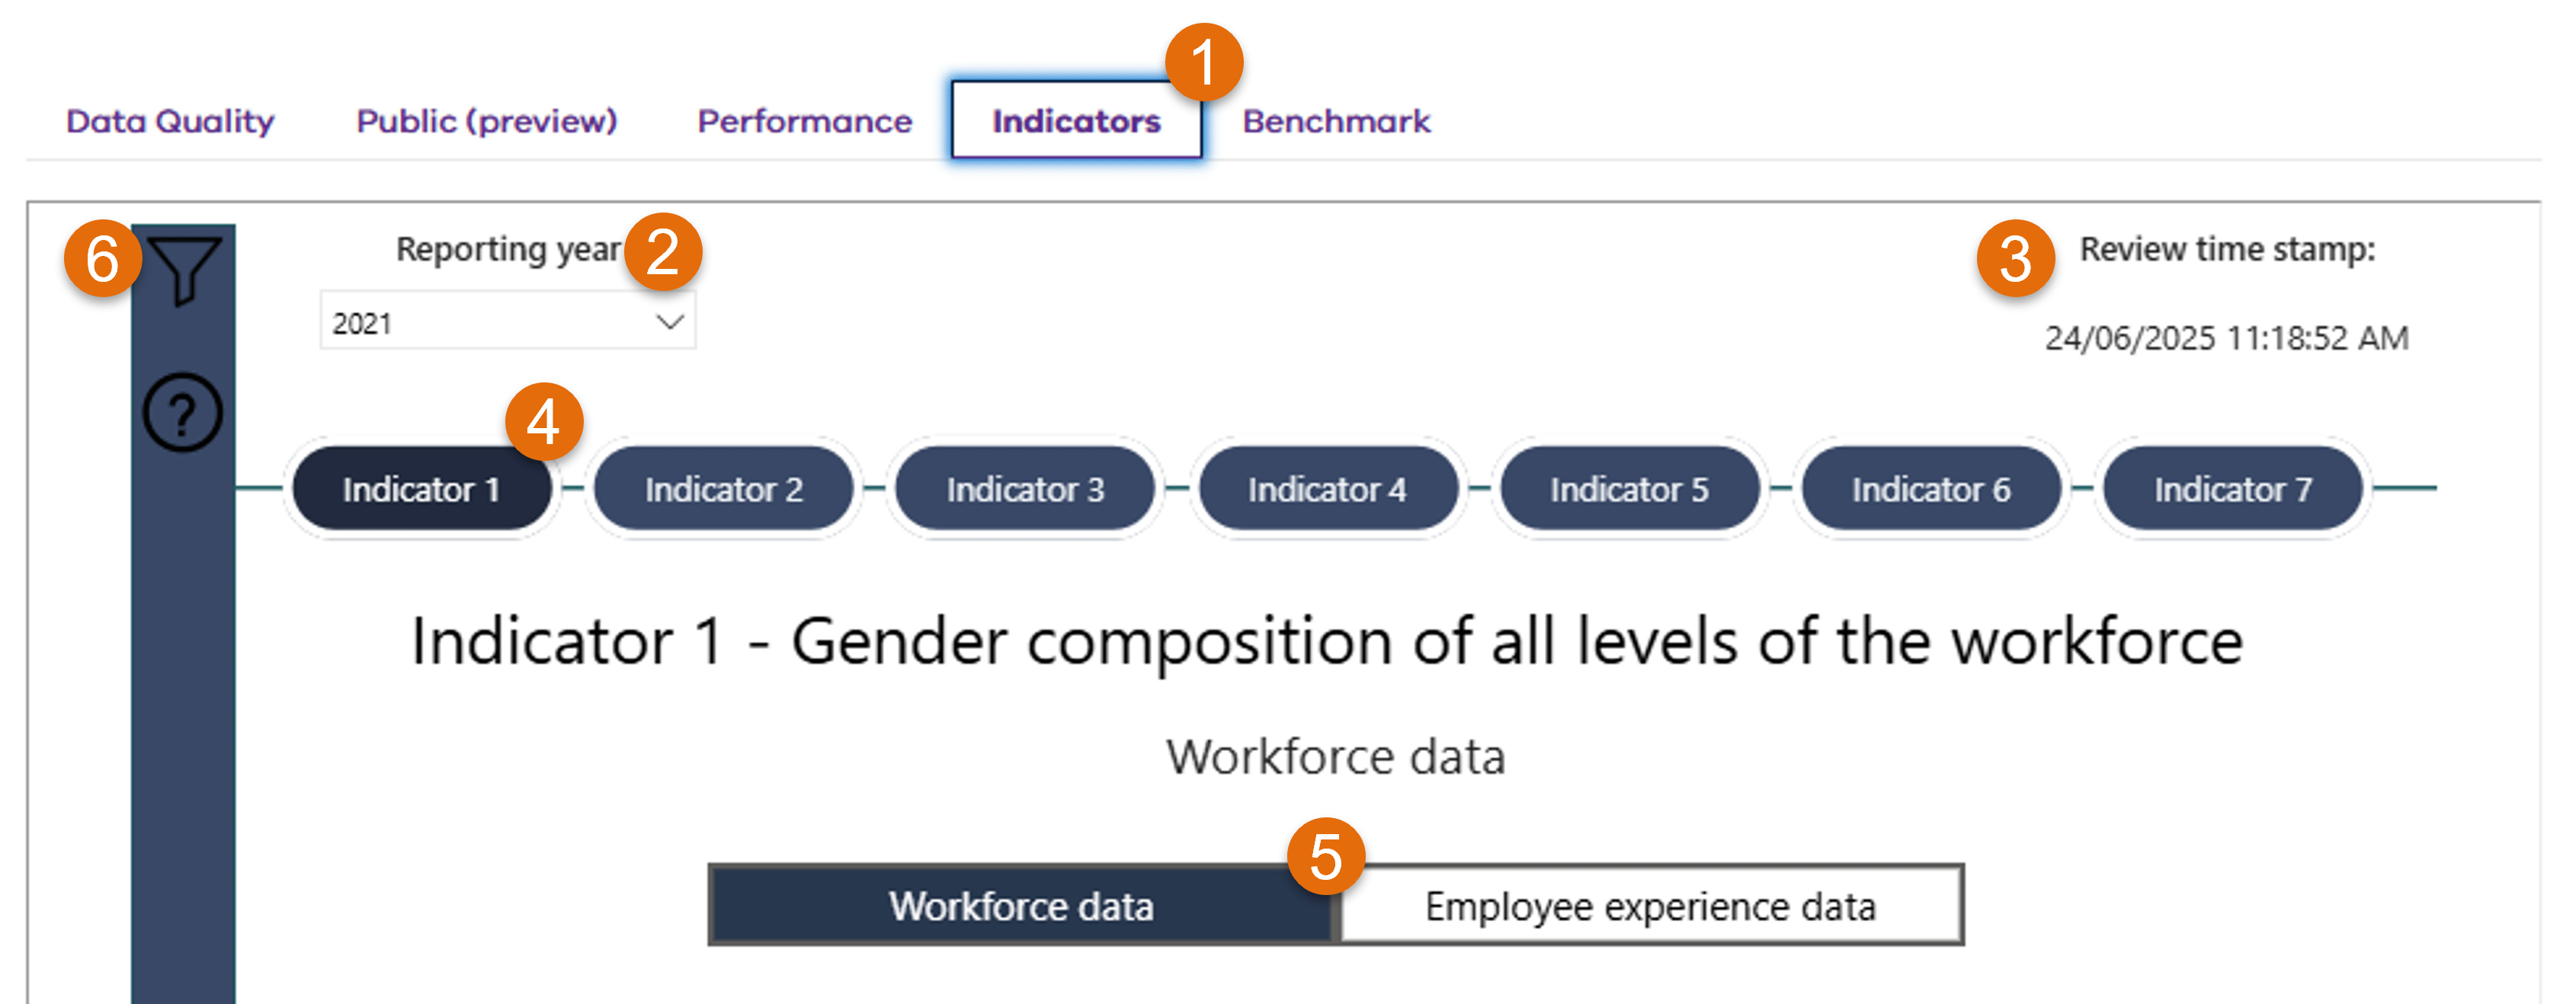
To view and navigate the indicators report:
1. Click on the ‘Indicators’ tab under the ‘Reports’ tab.
2. Select the relevant reporting year in the top left corner of the report.
3. To the right of the reporting year, look for the ‘Review time stamp’. Ensure the time roughly matches the time when the audit data moved to a status of ‘Review’. If this time stamp is older, the audit data has likely not completed processing. This step can take between 4-24 hours to complete.
4. Click on any Indicator button to view its data
Figure 20: The indicators report

5. Some indicators allow switching between workforce data and employee experience data. Click this control to change data source.
6. Slicers can control report data for more granular analysis. To open the slicers menu, click the filter (funnel) icon to the left of the report.
Each indicator has its own slicers. For example, slicers for indicator 1 allow you to see data on:
- Intersectionality – across Aboriginality, age, cultural identity, disability, religion, sexual orientation
- De-identification – by granularity of level to CEO and employment basis, and privacy threshold.
Benchmark report
The benchmark report presents data in two vertical panels. You can use it to compare your data across multiple years, or to compare your data against published benchmarks that the Commission has released.
To compare with a benchmark, select an indicator and do the following for each panel:
1. Select your organisation.
- You will see your own organisation and any benchmark organisation. You will not see other public sector organisations.
- To compare your data with itself, select your organisation in both panels.
2. Select a reporting year.
3. Select a privacy threshold (if required).
4. Select from the available slicers to refine the results you are viewing.
5. View and compare the results between the top and bottom panel.
6. If you need to reset your slicers, use the ‘Reset slicers’ control on the right.
Getting help
Duty holders can contact the Commission any time from our website on this page, or via email to enquiries@genderequalitycommission.vic.gov.au.
Updated